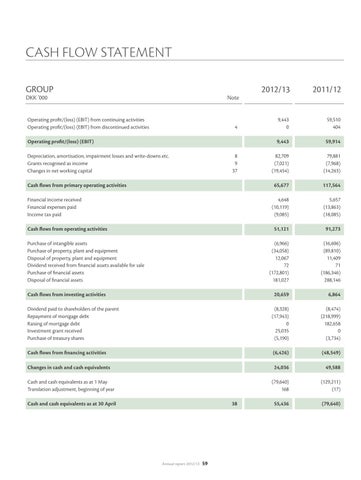
CASH FLOW STATEMENT GROUP DKK ’000
Note
Operating profit/(loss) (EBIT) from continuing activities Operating profit/(loss) (EBIT) from discontinued activities 4 Operating profit/(loss) (EBIT)
2012/13
2011/12
9,443 0
59,510 404
9,443
59,914
Depreciation, amortisation, impairment losses and write-downs etc. 8 Grants recognised as income 9 Changes in net working capital 37 Cash flows from primary operating activities
82,709 (7,021) (19,454)
79,881 (7,968) (14,263)
65,677
117,564
Financial income received Financial expenses paid Income tax paid Cash flows from operating activities Purchase of intangible assets Purchase of property, plant and equipment Disposal of property, plant and equipment Dividend received from financial assets available for sale Purchase of financial assets Disposal of financial assets Cash flows from investing activities Dividend paid to shareholders of the parent Repayment of mortgage debt Raising of mortgage debt Investment grant received Purchase of treasury shares Cash flows from financing activities Changes in cash and cash equivalents
4,648 (10,119) (9,085)
5,657 (13,863) (18,085)
51,121
91,273
(6,966) (34,058) 12,067 72 (172,801) 181,027
(16,606) (89,810) 11,409 71 (186,346) 288,146
20,659
6,864
(8,328) (17,943) 0 25,035 (5,190)
(8,474) (218,999) 182,658 0 (3,734)
(6,426)
(48,549)
24,036
49,588
(79,640) 168
(129,211) (17)
55,436
(79,640)
Cash and cash equivalents as at 1 May Translation adjustment, beginning of year Cash and cash equivalents as at 30 April 38
Annual report 2012/13
59