30 minute read
Monitoring Biodiversity and Water Pollution via High-Throughput eDNA Metabarcoding Jason Chang

By: Jason Chang; Research sponsor (PI): Rasmus Nielsen
ABSTRACT
Traditionally, monitoring of water pollution via detection of bioindicators has been a tedious and time-consuming task that involves the use of stereomicroscope and morphological dichotomous keys. In contrast, with high-throughput eDNA metabarcoding, the identification of a bioindicator is carried out in silico in a cost- and time-effective manner. This study focuses on demonstrating the application of Illumina’s MiSeq-based high-throughput amplicon sequencing to eDNA samples to characterize three freshwater ecosystems with substantial anthropogenic impacts in Berkeley, California. The method captures information that is indicative of the predator-prey relationships between arthropods and rotifers commonly found in freshwater ecosystems among all three habitats sampled. Furthermore, calculation of community pollution values revealed that Strawberry Creek possesses the worst water quality and ecosystem health across the three habitats sampled. A cost-benefit analysis demonstrated that the normalized cost per bioinformatic sample of high-throughput eDNA metabarcoding is estimated at 18.918 minutes and $10 in terms of total time and cost, respectively. This is to be put in contrast with the at least 10-fold increase in requirements of 250 minutes and $85 per traditional stereomicroscopic sample. We conclude with a novel quantitative approach that reproduces the same success regarding biodiversity documentation of a freshwater ecosystem elucidated by stereomicroscopic approaches using high-throughput eDNA metabarcoding in a cost- and time-efficient manner.
Major, Year, and Department: Computer Science and Microbial Biology, 3rd year, Departments of Integrative Biology and Statistics.
INTRODUCTION
Freshwater ecosystems are extremely vulnerable to anthropogenic impacts in a world of increasing human interventions. Species under such ecological environments are constantly threatened by the risk of an extinction event that results in drastic decline in biodiversity in the ecosystem. Thus, it is crucial to document the biodiversity of the ecosystem before it is permanently transformed beyond recovery. Living organisms shed traces of DNA in forms such as skin, scales, hair, and mucus from external interactions with the habitat, which accumulate in their surroundings and can be extracted as environmental DNA (eDNA). For clarification, we hereby adopt Thomsen and Willerslev’s definition of eDNA when the term was first coined as: genetic material obtained directly from environmental samples (soil, sediment, water, etc.) without any obvious signs of biological source material. 44 These traces of life provide information to predict and simulate the potential interspecies interactions within an ecosystem.
Under the prior approach, individual specimens must be carefully observed under the stereomicroscope prior to evaluating each of the criterions in the dichotomous keys. The use of dichotomous keys is oftentimes a complex and error-prone process that requires extensive knowledge into the clade that the specimen resides in. Additionally, establishing alternative methods for monitoring and documenting freshwater biodiversity is of high interest at the moment due to the decline in experienced taxonomic experts. 49,50 The technology of next generation sequencing (NGS) differs from the current generation of serial DNA sequencing platforms in that it is capable of performing sequencing on millions of small DNA fragments in parallel. 46 This advancement has allowed researchers to evaluate millions of amplicon reads all within the setting of one experiment. Subsequently, the sample pool of amplicon reads is computationally aligned to known genomic sequences of bioindicators from the reference genome sequence database to determine the abundance of each bioindicator present within the sample. The bioinformatic approach for bioindicator monitoring is no longer susceptible to observer errors or limitations of the dichotomous keys, thus yielding a more precise measurement of water pollution than the traditional morphological approach.
One novel technique to approach biodiversity documentation is DNA metabarcoding, which aims to survey multispecies and high-level taxon biodiversity using typically degraded eDNA sampled under unknown ecological environments without the need of additional information regarding organismal composition in advance. 45 This is to be put in contrast with the standard method for DNA barcoding that focuses on identification of one predetermined species. In a DNA metabarcoding study, eDNA samples are first amplified by polymerase chain reaction (PCR). DNA metabarcoding utilizes universal primers that are complementary to highly conserved loci, thus allowing the sequence reads to be mapped back to the genome of most species when performing sequence alignments. With the rapid advancement of NGS, we hypothesize that documenting biodiversity by DNA metabarcoding requires less effort in terms of both cost and time than the stereomicroscopic approaches.
Past studies have struggled to augment the scale of the project due to PCR inhibition and the lack of techniques in producing high-throughput amplicon sequencing with universal primers on eDNA samples. In molecular biology, the throughput of a method is defined by the rate at which samples can be processed. More specifically, extensive eDNA metabarcoding studies in the past have
often succumbed to the presence of compounds that inhibit DNA polymerase activity, thus hindering the PCR amplification process. The build-up of organic matter in a freshwater ecosystem can be a consequence of soil run-off from the streamflow and dense vegetation. The accumulated organic matter indirectly inhibits PCR amplification by undergoing non-enzymatic decay during the eDNA extraction process, producing a range of PCR inhibitors, including complex polysaccharides, humic acid, and tannin compounds. 15 In the present study, we were able to develop a thorough PCR amplification protocol to overcome DNA polymerase inhibitors present in the freshwater eDNA samples using an inhibitor-resistance DNA polymerase in combination with a “touchdown approach” in the PCR protocol, under which the annealing temperature is gradually reduced (Δt = -1.5ºC per cycle) to maximize the specificity of PCR amplification.
Samples in the present study were collected among three freshwater habitats across the eastern region of the San Francisco Bay Area to represent freshwater ecosystems. Lake Anza serves as a recreational swimming reservoir in Tilden Regional Park, located in Berkeley, California (Figure 1). Lake Anza spans a total surface area of 1.56 square miles with most of its lake area sitting above ground. With significant human interventions, Lake Anza is most frequently visited by swimmers between months of May and September. On the other hand, located on the east side of the Berkeley Hills, San Pablo Reservoir covers a watershed of 23.37 square miles with a water tunnel running underground from the west side of the reservoir for further treatment and distribution to various households (Figure 1). Due to its functionality as a drinking water storage facility, swimming and wading are prohibited at San Pablo Reservoir with restricted allowance for fishing, boating, and canoeing. Strawberry Creek covers a total area of 1.8 square miles with 60% of its water body flowing entirely underground. 13,14 The hydrologic structure of the aboveground portion diverges into two affluents, the North Fork and the South Fork, through the University of California, Berkeley, campus (Figure 1).
Although it is difficult to directly compare the intensity and susceptibility of anthropogenic impacts at each of the three samples, Lake Anza is expected to be particularly prone to pollutants resulting from human interventions due to its immediate exposure to organic contaminants, including human feces, urine, and dead skin cells. San Pablo Reservoir is expected to have the lowest level of water pollution due to its rigorous prohibitions on various recreational water activities as a drinking water storage unit. It is uncertain how the water quality of Strawberry Creek will compare to samples from the other static water bodies due to the lack of prior study on correlations between stream flow rates and ecosystem health under the influence of human activities.
In this study, we hypothesize that eDNA metabarcoding via a high-throughput sequencing platform will effectively monitor biodiversity and water pollution under freshwater ecosystems in a more practical and cost-efficient manner over the traditional morphological approach. This is partly motivated by a related prior study by Šigut et al., looking at the performance of DNA metabarcoding and morphological approach in detecting interspecies interactions, specifically host-parasitoid interactions. 51 Particularly, no significant differences in accuracy were found between the two methods regarding success of taxonomic identification. 51 To evaluate the viability of our method, we sampled across three freshwater ecosystems in Berkeley, California. We first looked for the presence of the frequently found predator-prey relationships between
Figure 1: Geographical locations of Strawberry Creek, Lake Anza, and San Pablo Reservoir and the proximal habitats on the eastern region of
the San Francisco Bay Area. Courtesy of the Google Maps, maps.google.com
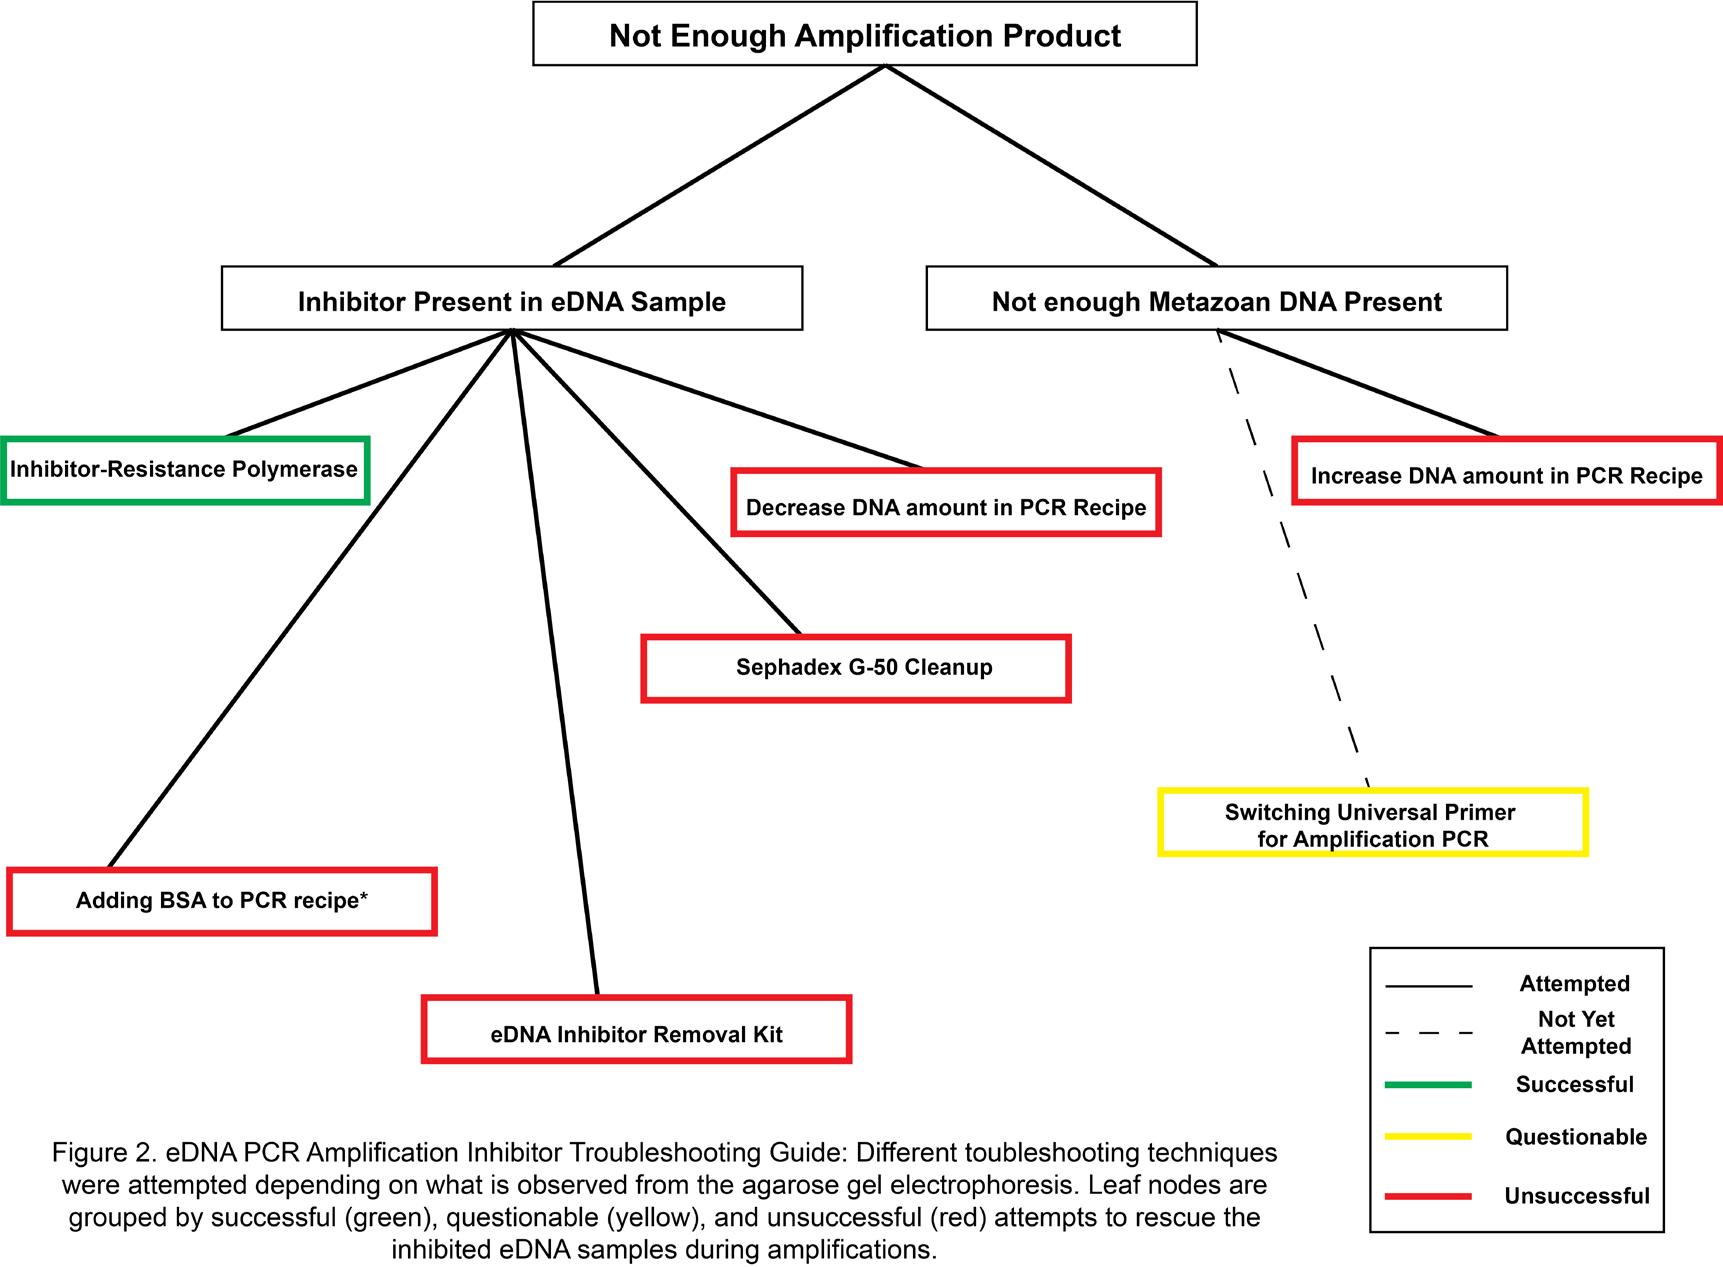
Figure 2: eDNA PCR Amplification Inhibitor Troubleshooting Guide: Different troubleshooting techniques were attempted depending on what is observed from the agarose gel electrophoresis. Leaf nodes are grouped by successful (green), questionable (yellow), and unsuccessful (red) attempts to rescue the inhibited eDNA samples during amplifications.
arthropods and rotifers, which would reveal whether our method is capable of capturing the interspecies interactions within a habitat. In addition, we were curious whether our method is capable of measuring the quality of water within a habitat by performing the traditional bioindicator experiment in silico. Thus, we computed the community pollution value across all three habitats to observe whether the trends in water pollution level agree with what we hypothesized based on the stringency of regulations on various recreational water activities at each sampling site. Further, through trial and error, we hereby also present a thorough PCR amplification protocol to overcome DNA polymerase inhibitors present in the freshwater eDNA samples (Figure 2). In closing, we conducted a cost-benefit analysis to evaluate whether high-throughput eDNA metabarcoding is indeed more efficient in efforts of both time and cost compared to the stereomicroscopic approaches as expected (Figure 3).
MATERIALS AND METHODS
eDNA Sampling and Extraction
The samples were collected in three freshwater ecosystems in Berkeley, California. Lake Anza, San Pablo Reservoir, and downstream of Strawberry Creek were independently sampled
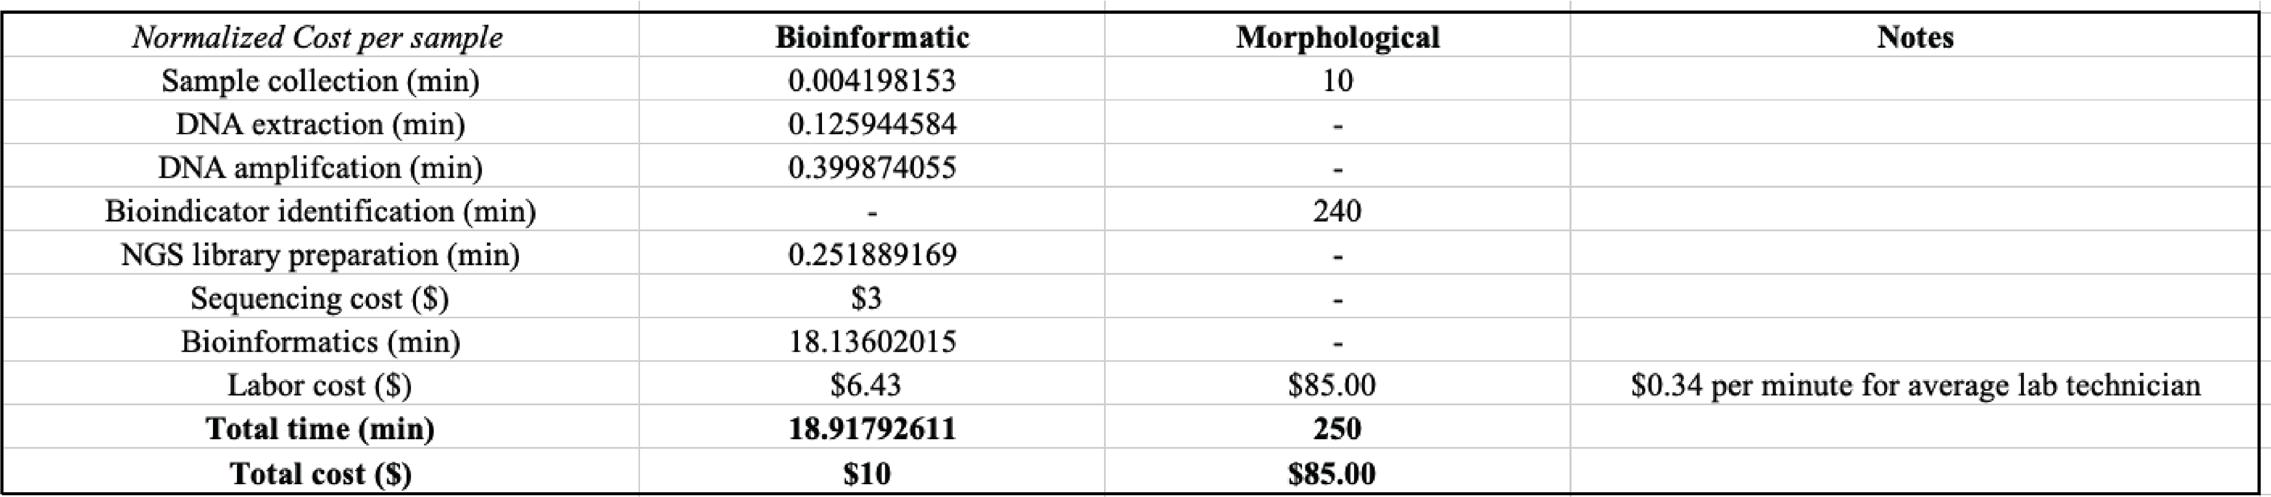
Figure 3: Cost and time estimates for identification of bioindicators by the bioinformatic and morphological approaches. Unit of time: minutes (min), unit of currency: U.S. dollars ($)
to represent different levels of human interventions and distinct stream flow rates. Lake Anza and San Pablo Reservoir represent standing bodies of water while Strawberry Creek is distinguished by its fast-moving streamflow. Two 1 L samples were taken from one sampling site at each of the three water bodies, totaling up to six samples (2x San Pablo Reservoir, 2x Lake Anza, 1x Strawberry Creek, 1x distilled water as blank Control Sample). Six samples were kept isolated throughout the complete procedure of sample processing to avoid the contaminations of omnipresent human DNA from the researcher into the samples. eDNA samples were isolated from water samples using Sterivex GP 0.22 μm filters (Catalogue Number: SVGPL10RC) and BD Luer-Lok 50 mL syringes (Catalogue Number: 13-689-8) following protocol described from a similar prior study on eDNA monitoring of freshwater crayfish with minor modifications. 1 Extractions of DNA from the filters were performed with Qiagen DNeasy Blood & Tissue kit (Catalogue Number: 69504).
mtDNA-CO1 Amplification from eDNA Samples
Samples of extracted DNA were amplified using the universal mitochondrially encoded cytochrome c oxidase I (mtDNA-CO1) primers (Forward Primer [mlCOIintF]: GGWACWGGWTGAACWGTWTAYCCYCC, Reverse Primer [jgHCO2198]: TANACYTCNGGRTGNCCRAARAAYCA) for metabarcoding animal and protist biodiversity. PCR amplification was performed in a total volume of 20 μl with 4 μl of 10 μM of each forward and reverse mtDNA-CO1 primers, 4 μl of Invitrogen Platinum GC Enhancer, 10 μl of Invitrogen Platinum II Hot-Start PCR Master Mix (2X) (Catalogue Number: 13000013), and 2 μl of the template DNA. To optimize the universality of our metabarcoding primers, we selected the degenerate mtDNA-CO1 primer set with some of the primer positions having multiple possible bases. The degeneracy of a primer sequence is defined by the number of unique sequence combinations it encodes. 26 Due to the degeneracy that arises from our primer sequences, PCR profile was modeled after a “touchdown approach” following supplied protocol of mtDNA-CO1 primers to minimize amplification of non-specific fragments with minor modifications. 24,26 Under this touchdown approach of PCR reaction, the annealing temperature is gradually reduced (Δt = -1.5ºC per cycle) to maximize the specificity of PCR amplification. We proceeded with 15min of denaturation at 95ºC, followed by 13 initial cycles: 30s of denaturation at 94ºC, annealing for 90s at 69.5ºC (Δt = -1.5ºC per cycle) and 90s of extension at 72ºC, followed by another 40 subsequent cycles: 30s of denaturation at 94ºC, annealing for 60s at 50ºC and 90s of extension at 72ºC, terminated by 10 min of extension at 72ºC and constant storage at 4ºC. The rationale behind the touchdown approach of the PCR profile can be illustrated as follows. At higher annealing temperature, molecules vibrate at a higher velocity, which makes it more difficult for primers to anneal to regions with low affinity and high number of mismatches, thus increasing the specificity of the annealing process. The purpose of dropping the annealing temperature per cycle is to make sure most of the primers in solution are properly incorporated into the PCR amplification reaction. With a lower annealing temperature, primers can now bind to regions of the template DNA with lower affinity despite the mismatches, increasing the likelihood of annealing. Performance of the amplification was evaluated by 1.5% agarose gel electrophoresis. A single clear band per lane indicates success of the PCR amplification, whereas the absence of band indicates failure of amplification of any product. Presence of multiple bands per lane represents amplification of mtDNA-CO1 gene along with non-specific markers.
NGS Library Preparation
Library preparation for Next-Generation Sequencing (NGS) was performed using KAPA Hyper Prep Kit (Catalogue Number: 07962363001). Individual amplicons of mtDNA-CO1 barcode were processed with end repairing and A-tailing, followed by adapter ligation, concluded by two cycles SPRI magnetic bead cleanup. Quality control for absence of contaminants was performed on both Qubit fluorometer and Agilent Bioanalyzer using 1 μl of final amplicon library product.
NGS Library Sequencing
The amplicon products were pooled into the library in equimolar concentration before performing paired-end sequencing on two separate runs of the Illumina MiSeq v3 Platform at the QB3 Vincent J. Coates Genomics Sequencing Laboratory (GSL) at the University of California, Berkeley.
Taxonomy Assignment
Taxonomy of the eDNA reads from NGS library sequencing was assigned using the Anacapa Toolkit, which monitors sample metabarcoding in three stages. 7 First, the toolkit builds reference sequence libraries from Creating Reference libraries Using existing tools (CRUX). In the second stage, Dada2 was applied for quality control and assignment of Amplicon Sequence Variants (ASV), under which merging and dereplication are performed based on overlaps and sequence variations with elimination of chimeric reads. Lastly, the processed reads are assigned with taxonomy by running Bowtie 2 specific Bayesian Least Common Ancestor (BLCA).
Read Count Normalization
Batch effects occur when technical differences associated with the lab workflow contribute to the variations in experimental outcome. To avoid batch effects across different samples, taxonomic read counts are normalized by min-max normalization before relative abundances between species were computed. The feature scaling is given by the following formula:

Community Pollution Value
Community Pollution Value (CPV), or the biotic index, is a metric measuring the tolerance of organisms residing within an ecosystem to pollution. The tolerance of each organism is measured by the Species Pollution Value (SPV) on a 0 to 10 scale, which is empirically determined with 0 being most sensitive to pollution and 10 being
most tolerant to pollution. 20 The organisms with SPVs assigned are also known as bioindicator species as they reflect the ecosystem health. The CPV for each sample is calculated by the sample mean of SPV with the following formula:

Cost-Benefit Analysis
A cost-benefit analysis for detection of bioindicator was conducted by replicating the procedure described by Fernández et al. in a similar study, looking at metabarcoding of eDNA samples collected from Nalón River, Spain. 43 The duration of each stage of the experiment is recorded following the methods as previously explained. The approximated runtime for bioinformatic analysis accounts for the entire pipeline of the Anacapa Toolkit. The labor cost is estimated as the total allocated time multiplied by the average salary of a laboratory technician in California, which is equivalent to $0.34 per minute at the time of writing. The cost per bioinformatic sample is normalized by the number of unique species assigned in each sample to make comparable to the nature of the morphological approach. The estimated time per morphological sample was reproduced based on the data presented by Fernández
In total, a grand total of 2,390 species were identified across all six samples. Based on the taxonomic assignments from amplicon-based next-generation sequencing, Skistodiaptomus pallidus and Keratella cochlearis are found to be the predominant species in Lake Anza (Figure 4). Skistodiaptomus pallidus is a copepod commonly found in freshwater ecosystems. It has been known to be an efficient omnivorous predator, mainly preying on specific rotifers and microzooplankton populations. 11,35,36,41 Keratella cochlearis is a et al. 43
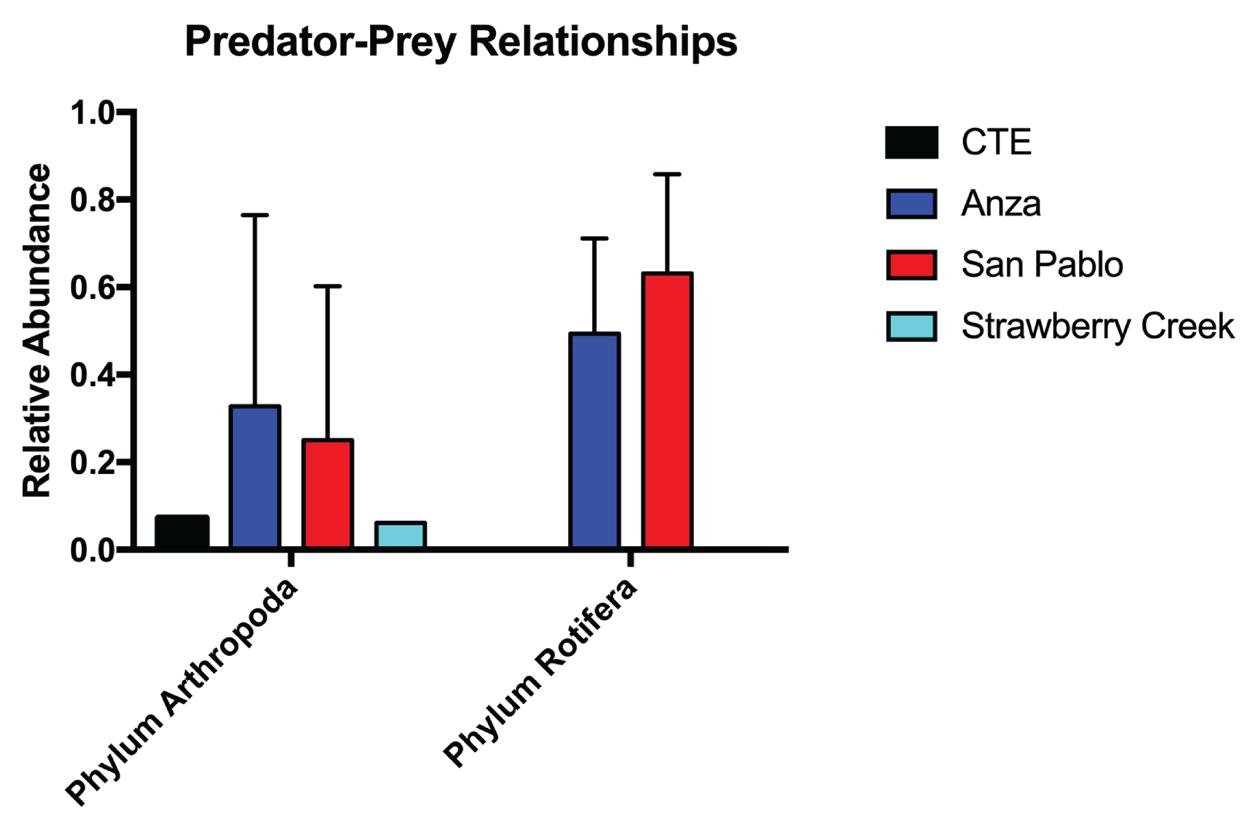
freshwater planktonic organism, particularly rotifers, species from the phylum Rotifera characterized by the wheel-like ciliated structure at the frontal end of their body. 5 As previously mentioned, Keratella cochlearis is a preferred prey of Skistodiaptomus pallidus. Predator-prey interactions like this support the idea that our methodology of monitoring may suggest the interspecies dynamics among living organisms in Lake Anza (Figure 5). Reads from San Pablo Reservoir were primarily assigned to species from the Hypocreales, which is an order of fungi that are characterized by their vibrant colorations and perithecial shape of their spore-producing structures (Figure 4). Some Hypocreales found in our San Pablo Reservoir include Fusarium, Calonectria colhounii, and Verticillium nonalfalfae. Similar predation of arthropods on rotifers was also evident in our San Pablo Reservoir samples between Skistodiaptomus pallidus and Keratella quadrata (Figure 5). Reads
Figure 4: Population composition from each of the six samples (CTE: Control Sample, AZ: Lake Anza, SP: San Pablo, SC: Strawberry Creek).
Representative phylums among the 10 largest relative abundances present in the amplicon samples are plotted.
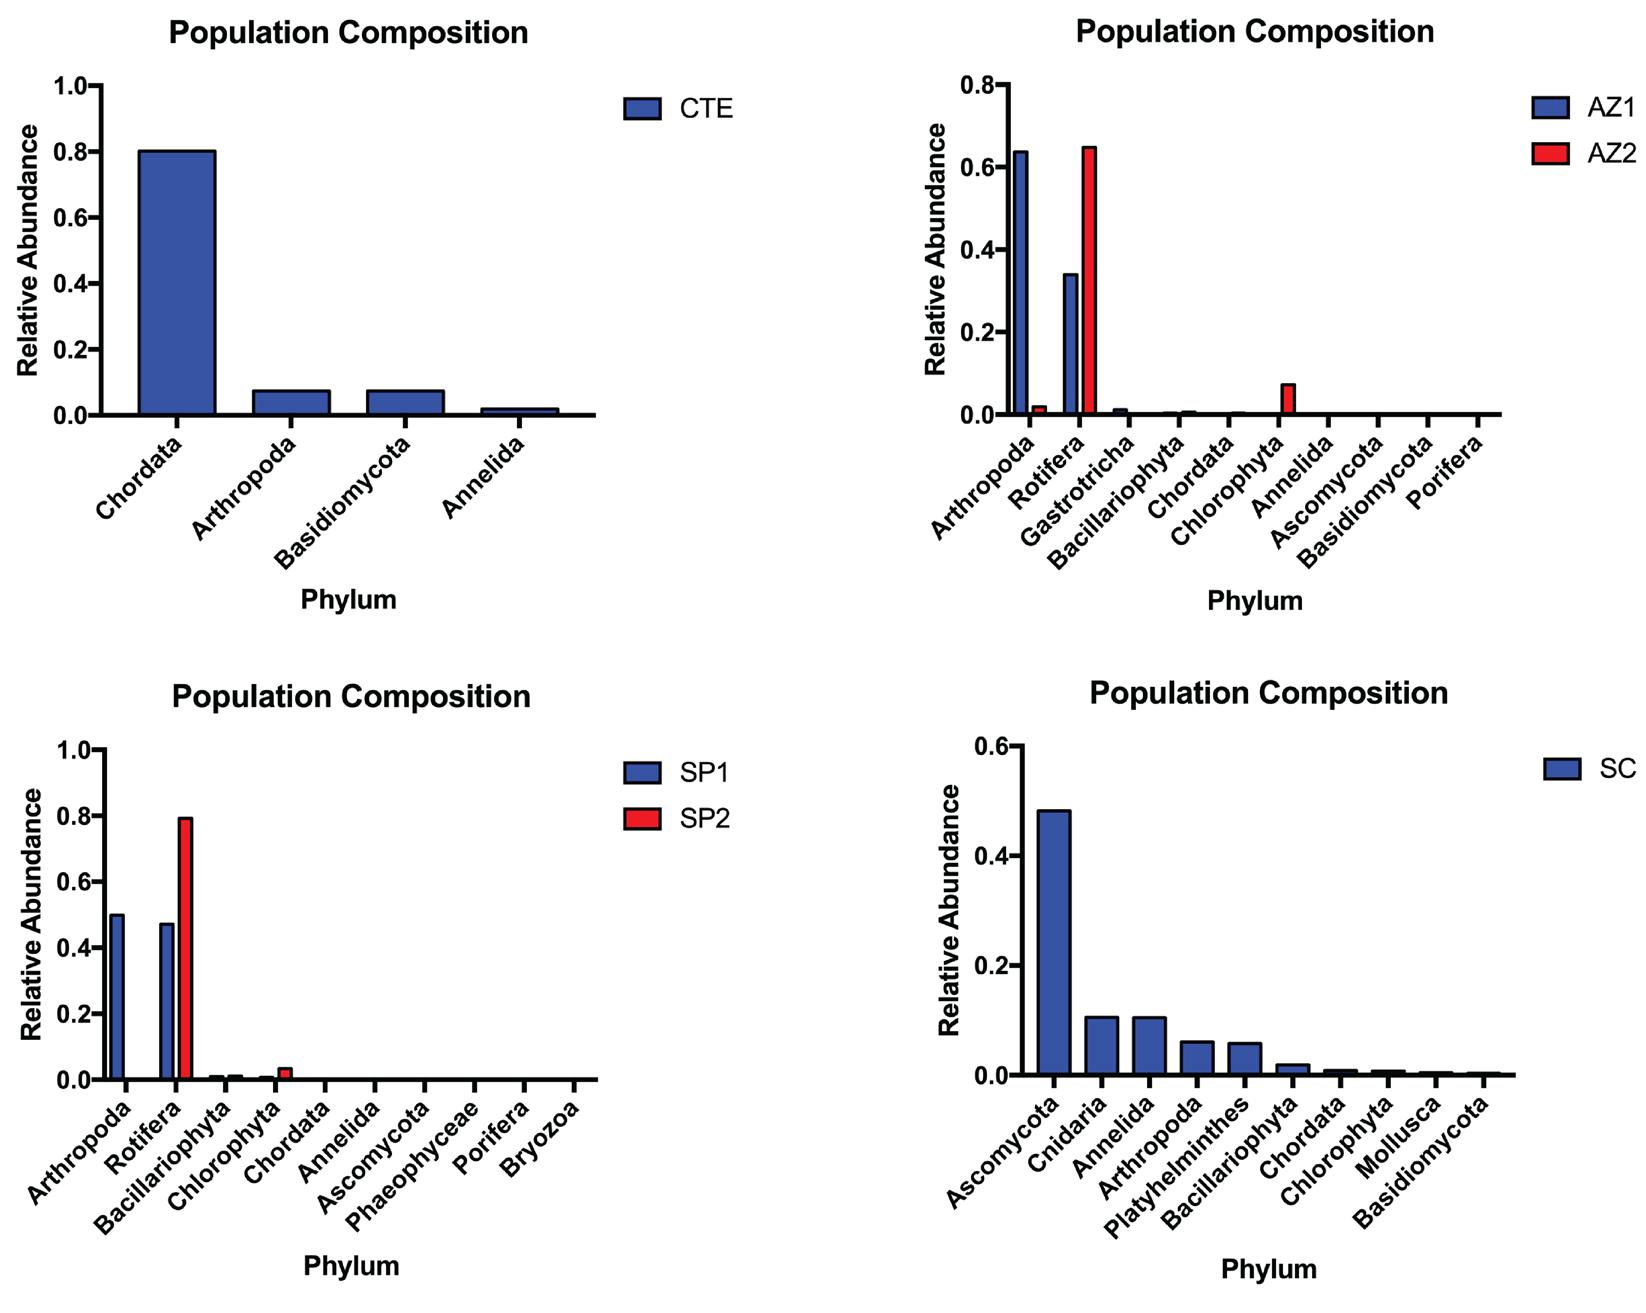
from Strawberry Creek were mainly assigned to descendants of order Ploima, which is another order of rotifers commonly found in freshwater habitats (Figure 4). Unexpectedly, a number of reads was also assigned under phylum Arthropoda (Figure 5). Overall, the high quantities of eDNA assigned to both arthropods and rotifers may be indicative of a potential predator-prey relationship between the two organisms.
In addition to the expected biological interaction between freshwater predators and prey, we also found traces amount of eDNA assigned to species nonnative to the freshwater ecosystem in the Strawberry Creek sample. Some preeminent examples from this group of animals include human (Homo sapiens), black rat (Rattus rattus), house mouse (Mus musculus), fox squirrel (Sciurus niger), domestic dog (Canis lupus), and racoon (Procyon lotor). In particular, these are all land animals commonly found in high densities around the area of urbanization. This suggests amplification of non-target taxa due to the high sensitivity of our methodology and the universality of our primer design. 48
To evaluate our taxonomical classification quantitatively, we performed assessment of freshwater pollution by calculating community pollution value (CPV) for each of the three sample sites (Figure 6). The calculation of CPV is derived from the species pollution value (SPV) of various protozoan bioindicators present in the water sample. SPV of the protozoan species were computed in a previous study with associations between these species and various chemical parameters. 20 Water sample from Strawberry Creek showed the highest CPV among all samples, indicating the intensity of pollution at the sample collection site (Figure 6). Succeeding, the water quality of Lake Anza and San Pablo Reservoir also possessed a CPV slightly above the threshold value of 3.95, indicating a severely polluted water (Figure 6). It is important to note that the samples from San Pablo Reservoir were taken at the source water, thus do not directly reflect the water quality of the distributed drinking water after proceeding treatment.
A related prior study by Šigut et al. on performance of DNA metabarcoding and morphological approach in detecting interspecies host–parasitoid interactions has found no significant differences in accuracy between the taxonomic identification made by the two approaches. 51 Here, we conducted a cost-benefit analysis from an economic standpoint to directly compare the effectiveness of high-throughput eDNA metabarcoding and stereomicroscopic approaches in the detection of bioindicators. As hypothesized, the bioinformatic approach requires less effort in terms of both cost and time (Figure 3). To make the analysis as practical as possible, we also accounted for the labor cost per sample by calculating the product of total allocated time per sample multiplied by the average salary for a laboratory technician in California, which corresponds to $0.34 per minute at the time of writing. Without loss of generality, the total time per morphological sample was reproduced from data presented by Fernández et al. in a previous study on freshwater ecosystems of Nalón River, Spain. 43 As species need to be sorted individually per well sample in a morphological experiment, the cost per sample was normalized by the number of species assigned in each bioinformatic sample to make the two approaches more comparable. Across the board, the normalized cost per bioinformatic sample is estimated at 18.918 minutes and
Figure 5: Predator-prey relationships between anthropods and
rotifers found in Lake Anza and San Pablo Reservoir. Phylum Arthropoda: [CTE: 0.073, Anza: 0.328, San Pablo: 0.250, Strawberry Creek: 0.061]. Phylum Rotifera: [CTE: 0.000, Anza: 0.493, San Pablo:0.632, Strawberry Creek: 0.003].
$10 for total time and cost respectively (Figure 3). In contrast, each stereomicroscopic sample requires about 250 minutes and $85 in terms of total time and cost, driving up the cost by at least 10 folds (Figure 3).
DISCUSSION
In this paper, we addressed the viability of high-throughput amplicon sequencing-based eDNA metabarcoding for monitoring biodiversity and water pollution under freshwater ecosys
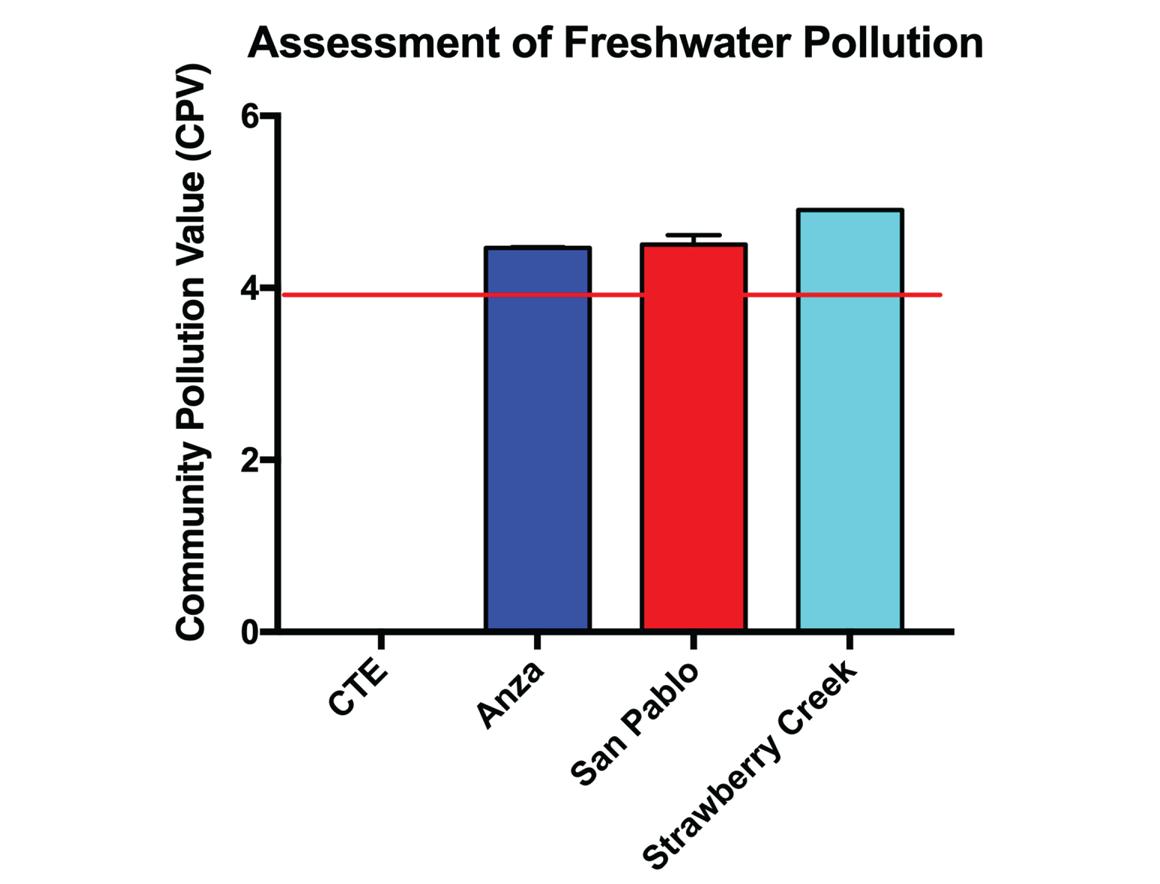
Figure 6: Assessment of freshwater pollution from each of the six samples based on biotic index of species pollution value (SPV) and
community pollution value (CPV). Red line indicates the CPV threshold of 3.95 for severely polluted water. CPV: [CTE: 0.000, Anza: 4.465, San Pablo: 4.504, Strawberry Creek: 4.906].
tems. From the taxonomical assignments of bioindicator species through bioinformatic construction of phylogenetic trees, we were able to calculate the biotic indices for freshwater samples computationally in a more practical and cost-efficient manner. This is to be put in contrast with the qualitative and labor-intensive approach of manually identifying bioindicator species present in the water sample using stereomicroscope and morphological dichotomous keys, a method prone to confirmation bias and human error. 38 It would be challenging to replicate and capture the same scale of information regarding biodiversity with the traditional observation methods. However, with the rapid development of large-scale data collection, the importance of quality over quantity should still be emphasized. In other words, we must proceed with stringent quality control to ensure the integrity of reads and taxonomic assignments, including the use of Dada2 in taxonomy assignment and proper normalization of read counts as previously described. Despite promising results demonstrated in a related prior study by Šigut et al., further juxtaposition of the accuracy between the two freshwater biodiversity surveying procedures await to be carried out with additional experiments in future study. 51
In the process of amplifying the amount of DNA sufficient enough to perform metabarcoding, we also developed a troubleshooting guide for high-fidelity and high-throughput PCR amplification of eDNA consisting of several inhibitors for common DNA polymerase, including but not limited to complex polysaccharides, heme, humic acid, and urea. 2,21,28,32,37,39 We attempted numerous different variants in our PCR profile as well as parameters in our PCR amplification step (Figure 2). These attempts were differentiated by what was observed from the agarose gel electrophoresis (Figure 2). Overall, our combining use of GC enhancer and inhibitor-resistance polymerase with “touchdown approach” of PCR profile was able to obtain high yields of amplicon product on universal mtDNA-CO1 barcode primers.
Observed from the calculations of CPV among each of the three communities, our experimental outcome was somewhat consistent with what we hypothesized. Primarily, Lake Anza suffers from the severe magnitude of anthropogenic pollution through its direct exposure to organic contaminants due to its recreational purposes (Figure 6). Identified as most severely polluted water body, sample from Strawberry Creek downstream was tested to have a CPV that is above the extremity of Lake Anza water quality (Figure 6). The poor water quality from Strawberry Creek is likely a result of lenient management and recent urbanization along with historical improper pipeline connections and illicit dumping. 13,14 Unexpectedly, the strict regulations of water quality at the San Pablo Reservoir were not reflected in our assessments of CPV, locating right around the same level as Lake Anza water quality (Figure 6). We suspect this to be a consequence of our current technique for sampling eDNA from freshwater ecosystems. Assuming DNA molecules are unevenly distributed due to preferential direction of water currents, our approach to replicate sampling from the same site might have been attributed to the unbalanced load of DNA in each collection of water samples. Our current replication procedure aims to keep replicate samples completely isolated and free of merging throughout the entire process of extraction, amplification, and sequencing to avoid the contaminations of omnipresent human DNA from the researcher into the samples. Merging is an extraction technique where X replicate samples from the same sampling site are first combined and mixed thoroughly into one container before randomly re-sampling X “pseudo-replicates” to ensure even distribution of eDNA in each replicate sample collected. 47 Instead of making X isolated collections of 1 L sample to make X replicate samples, perhaps a feasible approach of replication to attempt in future experiments is to make one merged collection of X L sample that is subsequently filtered through X filters to avoid bias in the sample collection process.
Computationally, our current usage of mtDNA-CO1 barcode is restrained to preferably monitoring animal diversity with limited coverage on protist diversity. We aim to incorporate several other universal primer pairs as well to expand the capability of this cost-efficient biodiversity monitoring solution to metabarcoding studies of other communities of life, including the internal transcribed spacer region of rRNA (rRNA-ITS) for fungi and ribulose-1,5-bisphosphate carboxylase/oxygenase (Rubisco)-encoding RbcS gene for plants. 30,40
Through capturing of the predator-prey relationships between arthropods and rotifers and measurement of community pollution value across three freshwater ecosystems, we have demonstrated the effectiveness of high-throughput eDNA metabarcoding as a novel method for not only documenting the biodiversity of a freshwater ecosystem but also completing the experiment in a more effective manner as compared to the traditional morphological approach. Currently, it is of high demand to establish alternative methods capable of effective freshwater assessments due to decreasing numbers of taxonomic experts in the field of morphological identification. 49,50
Overall, it is unrealistic to expect either approach to make absolute inferences on species abundance under a freshwater ecosystem given the uneven distribution of matter in the water. However, high-throughput eDNA metabarcoding is capable of capturing meaningful information regarding the interspecies dynamics and monitoring quality of the ecosystem as it changes over time. More importantly, compared to the traditional morphological approach, the bioinformatic approach for documenting biodiversity and bioindicator monitoring no longer succumbs to the observer errors or limitations of the dichotomous keys. In addition, as suggested by the cost-benefit analysis, high-throughput eDNA metabarcoding emerges as a dependable, cost- and time-efficient solution to approach large-scale biodiversity documentation (Figure 3).
ACKNOWLEDGEMENTS
We thank Lenore Pipes for assistance on the taxonomic assignments of the reads. This work was supported by Rasmus Nielsen and the Evolutionary Genetics Lab of Museum of Vertebrate Zoology at Berkeley. This work was supported in part by the East Bay Regional Park District Research Permit #19-1051.
Agersnap, S., Larsen, W.B., Knudsen, S.W., Strand, D., Thomsen, P.F., Hesselsøe, M., Mortensen, P.B., Vrålstad, T., and Møller, P.R. (2017). Monitoring of noble, signal and narrow-clawed crayfish using environmental DNA from freshwater samples. PLoS One12. Akane, A., Matsubara, K., Nakamura, H., Takahashi, S., and Kimura, K. (1994). Identification of the heme compound copurified with deoxyribonucleic acid (DNA) from bloodstains, a major inhibitor of polymerase chain reaction (PCR) amplification. Journal of Forensic Sciences39, 13607J. Andújar, C., Arribas, P., Gray, C., Bruce, C., Woodward, G., Yu, D.W., and Vogler, A.P. (2018). Metabarcoding of freshwater invertebrates to detect the effects of a pesticide spill. Molecular Ecology27, 146–166. Balcer, M.D., Korda, N.L., and Dodson, S.I. (1984). Zooplankton of the Great Lakes: a guide to the identification and ecology of the common crustacean species (Univ of Wisconsin Press). Caspers, H., and Pontin, R. (1980). A key to the freshwater planktonic and semi-planktonic rotifera of the British Isles. Internationale Revue Der Gesamten Hydrobiologie Und Hydrographie65, 171–171. Charbonneau, R., and Resh, V.H. (1992). Strawberry creek on the University of California, Berkeley campus: A case history of urban stream restoration. Aquatic Conservation: Marine and Freshwater Ecosystems2, 293–307. Curd, E.E., Gold, Z., Kandlikar, G., Gomer, J., Ogden, M., O’Connell, T., Pipes, L., Schweizer, T., Rabichow, L., Lin, M., et al. (2018). Anacapa Toolkit: an environmental DNA toolkit for processing multilocus metabarcode datasets. BioRxiv 488627. Deiner, K., Bik, H.M., Mächler, E., Seymour, M., Lacoursière‐Roussel, A., Altermatt, F., Creer, S., Bista, I., Lodge, D.M., Vere, N. de, et al. (2017). Environmental DNA metabarcoding: Transforming how we survey animal and plant communities. Molecular Ecology26, 5872–5895. Dickie, I.A., Boyer, S., Buckley, H.L., Duncan, R.P., Gardner, P.P., Hogg, I.D., Holdaway, R.J., Lear, G., Makiola, A., Morales, S.E., et al. (2018). Towards robust and repeatable sampling methods in eDNA-based studies. Molecular Ecology Resources18, 940–952. Fewtrell, L., and Kay, D. (2015). Recreational water and infection: a review of recent findings. Curr Environ Health Rep2, 85–94 Geiling, W.T., and Campbell, R.S. (1972). The effect of temperature on the development rate of the major life stages of Diaptomus Pallidus Herrick. Limnology and Oceanography 17, 304–306. Goldberg, C.S., Turner, C.R., Deiner, K., Klymus, K.E., Thomsen, P.F., Murphy, M.A., Spear, S.F., McKee, A., Oyler-McCance, S.J., Cornman, R.S., et al. (2016). Critical considerations for the application of environmental DNA methods to detect aquatic species. Methods in Ecology and Evolution7, 1299–1307. 14.
15.
16.
17.
18.
19.
20.
21.
22.
23.
24.
25.
26.
27.
28. Hans, K., and Maranzana, S. (2006a). Strawberry Creek Status Report - 2006 Geology. Creeks of UC Berkeley. Hans, K., and Maranzana, S. (2006b). Strawberry Creek Status Report - 2006 Water Quality. Creeks of UC Berkeley. Harper, L.R., Buxton, A.S., Rees, H.C., Bruce, K., Brys, R., Halfmaerten, D., Read, D.S., Watson, H.V., Sayer, C.D., Jones, E.P., et al. (2019). Prospects and challenges of environmental DNA (eDNA) monitoring in freshwater ponds. Hydrobiologia826, 25–41. Hilsenhoff, W. (1987). An improved biotic index of organic stream pollution. The Great Lakes Entomologist20. Hilsenhoff, W.L. (1977). Use of arthropods to evaluate water quality of streams. Hunter, M.E., Ferrante, J.A., Meigs-Friend, G., and Ulmer, A. (2019). Improving eDNA yield and inhibitor reduction through increased water volumes and multi-filter isolation techniques. Sci Rep9, 1–9. Jeunen, G., Knapp, M., Spencer, H.G., Taylor, H.R., Lamare, M.D., Stat, M., Bunce, M., and Gemmell, N.J. (2019). Species‐level biodiversity assessment using marine environmental DNA metabarcoding requires protocol optimization and standardization. Ecol Evol9, 1323–1335. Jiang, J.-G. (2006). Development of a new biotic index to assess freshwater pollution. Environmental Pollution 139, 306–317. Khan, G., Kangro, H.O., Coates, P.J., and Heath, R.B. (1991). Inhibitory effects of urine on the polymerase chain reaction for cytomegalovirus DNA. J Clin Pathol44, 360–365. Lacoursière‐Roussel, A., Howland, K., Normandeau, E., Grey, E.K., Archambault, P., Deiner, K., Lodge, D.M., Hernandez, C., Leduc, N., and Bernatchez, L. (2018). eDNA metabarcoding as a new surveillance approach for coastal Arctic biodiversity. Ecology and Evolution8, 7763–7777. Leduc, N., Lacoursière-Roussel, A., Howland, K.L., Archambault, P., Sevellec, M., Normandeau, E., Dispas, A., Winkler, G., McKindsey, C.W., Simard, N., et al. (2019). Comparing eDNA metabarcoding and species collection for documenting Arctic metazoan biodiversity. Environmental DNA 1, 342–358. Leray, M., Yang, J.Y., Meyer, C.P., Mills, S.C., Agudelo, N., Ranwez, V., Boehm, J.T., and Machida, R.J. (2013). A new versatile primer set targeting a short fragment of the mitochondrial COI region for metabarcoding metazoan diversity: application for characterizing coral reef fish gut contents. Frontiers in Zoology10, 34. Li, F., Peng, Y., Fang, W., Altermatt, F., Xie, Y., Yang, J., and Zhang, X. (2018). Application of environmental DNA metabarcoding for predicting anthropogenic pollution in rivers. Environ. Sci. Technol. 52, 11708–11719. Linhart, C., and Shamir, R. (2005). The degenerate primer design problem: theory and applications. J. Comput. Biol. 12, 431–456. Mandaville, S.M. (2002). Benthic macroinvertebrates in freshwaters: taxa tolerance values, metrics, and protocols (Soil & Water Conservation Society of Metro Halifax). Monteiro, L., Bonnemaison, D., Vekris, A., Petry, K.G., Bon-
net, J., Vidal, R., Cabrita, J., and Mégraud, F. (1997). Complex polysaccharides as PCR inhibitors in feces: Helicobacter pylori model. J Clin Microbiol35, 995–998. Piñol, J., Senar, M.A., and Symondson, W.O.C. (2019). The choice of universal primers and the characteristics of the species mixture determine when DNA metabarcoding can be quantitative. Molecular Ecology28, 407–419. Polinski, J.M., Bucci, J.P., Gasser, M., and Bodnar, A.G. (2019). Metabarcoding assessment of prokaryotic and eukaryotic taxa in sediments from Stellwagen Bank National Marine Sanctuary. Sci Rep9, 1–8. Ruppert, K.M., Kline, R.J., and Rahman, M.S. (2019). Past, present, and future perspectives of environmental DNA (eDNA) metabarcoding: A systematic review in methods, monitoring, and applications of global eDNA. Global Ecology and Conservation 17, e00547. Schrader, C., Schielke, A., Ellerbroek, L., and Johne, R. (2012). PCR inhibitors – occurrence, properties and removal. Journal of Applied Microbiology 113, 1014–1026. Serrana, J.M., Miyake, Y., Gamboa, M., and Watanabe, K. (2019). Comparison of DNA metabarcoding and morphological identification for stream macroinvertebrate biodiversity assessment and monitoring. Ecological Indicators101, 963–972. Søndergaard, M., and Jeppesen, E. (2007). Anthropogenic impacts on lake and stream ecosystems, and approaches to restoration. Journal of Applied Ecology44, 1089–1094. Suárez-Morales, E., and Arroyo-Bustos, G. (2012). An intra-continental invasion of the temperate freshwater copepod Skistodiaptomus pallidus (Herrick, 1879) (Calanoida, Diaptomidae) in tropical Mexico. BioInvasions Records 1, 255–262. Torke, B. (2001). The distribution of calanoid copepods in the plankton of Wisconsin Lakes. In Copepoda: Developments in Ecology, Biology and Systematics: Proceedings of the Seventh International Conference on Copepoda, Held in Curitiba, Brazil, 25–31 July 1999, R.M. Lopes, J.W. Reid, and C.E.F. Rocha, eds. (Dordrecht: Springer Netherlands), pp. 351–365. Tsai, Y.L., and Olson, B.H. (1992). Rapid method for separation of bacterial DNA from humic substances in sediments for polymerase chain reaction. Appl Environ Microbiol58, 2292–2295. Wan Abdul Ghani, W.M.H., Abas Kutty, A., Mahazar, M.A., Al-Shami, S.A., and Ab Hamid, S. (2018). Performance of biotic indices in comparison to chemical-based Water Quality Index (WQI) in evaluating the water quality of urban river. Environ Monit Assess190, 297. Watson, R.J., and Blackwell, B. (2000). Purification and characterization of a common soil component which inhibits the polymerase chain reaction. Can. J. Microbiol. 46, 633–642. Whitney, S.M., and Andrews, T.J. (2001). The gene for the ribulose-1,5-bisphosphate carboxylase/oxygenase (rubisco) small subunit relocated to the plastid genome of tobacco directs the synthesis of small subunits that assemble into rubisco. Plant Cell13, 193–206. 42.
43.
44.
45.
46.
47.
48.
49.
50.
51. Williamson, C.E., and Butler, N.M. (1986). Predation on rotifers by the suspension-feeding calanoid copepod Diaptomus pallidus1. Limnology and Oceanography31, 393–402. Yang, K. (2018). Toxic blue-green algae blooms found in many East Bay lakes. Fernández, S., Rodríguez, S., Martínez, J.L., Borrell, Y.J., Ardura, A., and García-Vázquez, E. (2018). Evaluating freshwater macroinvertebrates from eDNA metabarcoding: A river Nalón case study. PLoS One13. Thomsen, P.F., and Willerslev, E. (2015). Environmental DNA – An emerging tool in conservation for monitoring past and present biodiversity. Biological Conservation183, 4–18. Taberlet, P., Coissac, E., Pompanon, F., Brochmann, C., and Willerslev, E. (2012). Towards next-generation biodiversity assessment using DNA metabarcoding. Mol. Ecol. 21, 2045–2050. Behjati, S., and Tarpey, P.S. (2013). What is next generation sequencing? Arch Dis Child Educ Pract Ed98, 236–238. Lanzén, A., Lekang, K., Jonassen, I., Thompson, E.M., and Troedsson, C. (2017). DNA extraction replicates improve diversity and compositional dissimilarity in metabarcoding of eukaryotes in marine sediments. PLoS One12. Mioduchowska, M., Czyż, M.J., Gołdyn, B., Kur, J., and Sell, J. (2018). Instances of erroneous DNA barcoding of metazoan invertebrates: Are universal cox1 gene primers too “universal”? PLoS One13. Kuntke, F., de Jonge, N., Hesselsøe, M., and Lund Nielsen, J. (2020). Stream water quality assessment by metabarcoding of invertebrates. Ecological Indicators111, 105982. Elbrecht, V., and Leese, F. (2017). Validation and development of COI metabarcoding primers for freshwater macroinvertebrate bioassessment. Front. Environ. Sci. 5. Šigut, M., Kostovčík, M., Šigutová, H., Hulcr, J., Drozd, P., and Hrček, J. (2017). Performance of DNA metabarcoding, standard barcoding, and morphological approach in the identification of host–parasitoid interactions. PLOS ONE12, e0187803.
