OPTIMAL CONDITIONING ISSUE 27.qxd:Jerkins feature.qxd
20/8/09
20:15
Page 2
OPTIMAL CONDITIONING
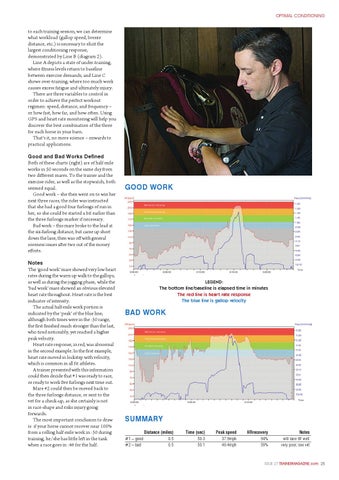
to each training session, we can determine what workload (gallop speed, breeze distance, etc.) is necessary to elicit the largest conditioning response, demonstrated by Line B (diagram 2). Line A depicts a state of under-training, where fitness levels return to baseline between exercise demands, and Line C shows over-training, where too much work causes excess fatigue and ultimately injury. There are three variables to control in order to achieve the perfect workout regimen: speed, distance, and frequency – or how fast, how far, and how often. Using GPS and heart rate monitoring will help you discover the best combination of the three for each horse in your barn. That’s it, no more science – onwards to practical applications. Good and Bad Works Defined Both of these charts (right) are of half-mile works in 50 seconds on the same day from two different mares. To the trainer and the exercise rider, as well as the stopwatch, both seemed equal. Good work – she then went on to win her next three races, the rider was instructed that she had a good four furlongs of run in her, so she could be started a bit earlier than the three furlongs marker if necessary. Bad work – this mare broke to the lead at the six-furlong distance, but came up short down the lane, then was off with general soreness issues after two out of the money efforts. Notes The ‘good work’ mare showed very low heart rates during the warm up walk to the gallops, as well as during the jogging phase, while the ‘bad work’ mare showed an obvious elevated heart rate throughout. Heart rate is the best indicator of intensity. The actual half-mile work portion is indicated by the ‘peak’ of the blue line; although both times were in the :50 range, the first finished much stronger than the last, who tired noticeably, yet reached a higher peak velocity. Heart rate response, in red, was abnormal in the second example. In the first example, heart rate moved in lockstep with velocity, which is common in all fit athletes. A trainer presented with this information could then decide that #1 was ready to race, or ready to work five furlongs next time out. Mare #2 could then be moved back to the three furlongs distance, or sent to the vet for a check-up, as she certainly is not in race-shape and risks injury going forwards. The most important conclusion to draw is: if your horse cannot recover near 100% from a rolling half-mile work in :50 during training, he/she has little left in the tank when a race goes in :46 for the half.
GOOD WORK
LEGEND: The bottom line/baseline is elapsed time in minutes The red line is hear t rate response The blue line is gallop velocity
BAD WORK
SUMMARY #1 – good #2 – bad
Distance (miles) 0.5 0.5
Time (sec) 50.3 50.1
Peak speed 37.9mph 40.4mph
HRrecovery 94% 59%
Notes will race 6F well very poor, see vet
ISSUE 27 TRAINERMAGAZINE.com 25