FIRM FOUNDATIONS OF GROWTH

WORLD BANK EAST ASIA AND THE PACIFIC ECONOMIC UPDATE APRIL 2024

© 2024 International Bank for Reconstruction and Development / The World Bank
1818 H Street NW, Washington, DC 20433
Telephone: 202-473-1000; Internet: www.worldbank.org
Some rights reserved
1 2 3 4 27 26 25 24
This work is a product of the staff of The World Bank with external contributions. The findings, interpretations, and conclusions expressed in this work do not necessarily reflect the views of The World Bank, its Board of Executive Directors, or the governments they represent. The World Bank does not guarantee the accuracy, completeness, or currency of the data included in this work and does not assume responsibility for any errors, omissions, or discrepancies in the information, or liability with respect to the use of or failure to use the information, methods, processes, or conclusions set forth. The boundaries, colors, denominations, links/footnotes and other information shown in this work do not imply any judgment on the part of The World Bank concerning the legal status of any territory or the endorsement or acceptance of such boundaries. The citation of works authored by others does not mean the World Bank endorses the views expressed by those authors or the content of their works.
Nothing herein shall constitute or be construed or considered to be a limitation upon or waiver of the privileges and immunities of The World Bank, all of which are specifically reserved.
Rights and Permissions
This work is available under the Creative Commons Attribution 3.0 IGO license (CC BY 3.0 IGO) http://creativecommons.org/licenses/ by/3.0/igo. Under the Creative Commons Attribution license, you are free to copy, distribute, transmit, and adapt this work, including for commercial purposes, under the following conditions:
Attribution—Please cite the work as follows: World Bank. 2024. Firm Foundations of Growth World Bank East Asia and Pacific Economic Update (April 2024). Washington, DC: World Bank, doi: 10.1596/978-1-4648-2102-8. License: Creative Commons Attribution CC BY 3.0 IGO
Translations—If you create a translation of this work, please add the following disclaimer along with the attribution: This translation was not created by The World Bank and should not be considered an official World Bank translation. The World Bank shall not be liable for any content or error in this translation.
Adaptations—If you create an adaptation of this work, please add the following disclaimer along with the attribution: This is an adaptation of an original work by The World Bank. Views and opinions expressed in the adaptation are the sole responsibility of the author or authors of the adaptation and are not endorsed by The World Bank.
Third-party content—The World Bank does not necessarily own each component of the content contained within the work. The World Bank therefore does not warrant that the use of any third-party-owned individual component or part contained in the work will not infringe on the rights of those third parties. The risk of claims resulting from such infringement rests solely with you. If you wish to re-use a component of the work, it is your responsibility to determine whether permission is needed for that re-use and to obtain permission from the copyright owner. Examples of components can include, but are not limited to, tables, figures, or images.
All queries on rights and licenses should be addressed to World Bank Publications, The World Bank, 1818 H Street NW, Washington, DC 20433, USA; e-mail: pubrights@worldbank.org.
ISBN (electronic): 978-1-4648-2102-8
DOI: 10.1596/978-1-4648-2102-8
Cover photo: A female businesswoman leading a meeting with multi ethnicity team members by Koh Sze Kiat © Getty Images. Used with the permission of Getty Images. Further permission required for reuse.
Figure O1. The EAP region is growing faster than the rest of the world but slower than before the pandemic in most major economies; output per capita is still below pre-pandemic levels in most Pacific Island countries and declined further in some xvii
Figure O2. A combination of external and domestic factors is influencing economic growth in the EAP region xviii
Figure O3. Three linked international developments will shape economic performance in the EAP countries: slowing global economy, financial tightness and trade-distorting measures xix
Figure O4. The rich and large countries, i.e. the G20, are the prime practitioners of industrial policy xix
Figure O5. Private and public debt is higher than before the pandemic; public debt as a share of GDP is likely to increase due to higher primary deficits, higher interest rates and lower growth xx
Figure O6. Fiscal policy has become less expansionary in most countries, while monetary policy has tightened in the region, except in China and Viet Nam xx
Figure O7. Economic policy uncertainty has increased in the US and China xxi
Figure O8. Growth in the region is influenced by development in the region’s largest trading partners xxi
Figure O9. Trends in private consumption are flatter than in the pre-pandemic period xxii
Figure O10. Private investment as a share of GDP is lower than before the pandemic and so, in some countries, is public investment xxiii
Figure O11. Goods exports are beginning to recover but slowly; tourist arrivals have plateaued below pre-pandemic levels in several economies xxiii
Figure O12. The consumption share of GDP remains relatively low in China; investment is growing faster in manufacturing but is slowing down in infrastructure and real estate xxiv
Figure O13. Regional growth has been driven by capital accumulation rather than TFP growth xxvi
Figure O14. Sources of aggregate productivity growth xxvi
Figure O15. Productivity growth in EAP has been driven primarily by increases in productivity within firms xxvii
Figure O16. The national frontier in EAP countries is falling behind the global frontier, especially in digital sectors xxviii
Figure O17. More productive firms report trade regulations, workforce skills and transport or telecommunication infrastructure, as important constraints to business operations xxviii
Figure O18. Higher SOE presence in EAP is associated with lower and higher foreign firm presence with higher productivity growth of frontier firms xxix
Figure O19. The best managed firms in developing EAP have skills far below the best in advanced economies xxx
Figure O20. Opening services to competition can increase productivity of services sectors and downstream manufacturing sectors xxx
Figure I.1. The EAP region is growing faster than the rest of the world but is on a slower growth trajectory than before the pandemic 1
Figure I.2. Output per capita rose above pre-pandemic levels in 2023 in a majority of EAP economies, but declined further in some Pacific Island Countries 2
Figure I.3. Across sectors, ICT, finance and retail are growing rapidly, while tourism and real estate are still lagging 3
Figure I.4. Poverty rates are expected to decline further 3
Figure B1.1. Extreme poverty (monetary and non-monetary) has remained stubbornly high in Papua New Guinea 4
Figure B1.2. Non-monetary measures suggest pockets of significant deprivation in the region 5
Figure I.5. Private consumption has sustained growth in all the major countries; services exports have helped in Malaysia, the Philippines, and Thailand, and public investment in China, Indonesia and the Philippines; private investment and goods exports remain weak 7
Figure I.6. External and domestic factors affecting economic growth 8
Figure I.7. Three linked international developments will shape economic performance in the EAP countries: recovering global trade, increasing trade-distorting measures, and tight financial conditions 8
Figure I.8. The number of new trade-distorting measures implemented against EAP countries have been rapidly increasing while those implemented by EAP countries have declined in recent years 9
Figure B2.1. The number of industrial measures strongly correlates with the dollars spent 9
Figure B2.2. The rich and large are the prime practitioners of industrial policy
Figure I.9. Public and private debt has significantly increased over the last decade
Figure I.10. Interest payment on external debt has significantly increased in 2023 in most countries
Figure I.11. Fiscal policy has become less expansionary in most countries
Figure I.12. Monetary policy has tightened in the region, except in China and Viet Nam
Figure I.13. CPI inflation is declining; some countries face deflationary pressures
Figure I.14.
Figure I.22.
Figure I.25.
Figure I.26.
Figure B5.2.
Figure I.27.
Figure I.29. Geopolitical risk has increased following the Israel-Hamas conflict after October 7, 2023
Figure B6.1. More ships are avoiding the Suez Canal following the rise in Yemen Houthi attacks since December 2023, while traffic in the Panama Canal has decreased due to drought
Figure B6.2. Shipping costs from the EAP region to several destinations have increased
Figure B6.3. Measures of stress in the global maritime supply chain network have increased due to recent disruptions in the Suez Canal
4. Policies
Figure I.30. The COVID-19 shock accelerated the upward trend in the public-debt-to-GDP ratio observed in most developing EAP countries since the GFC of 2008–2009
Figure I.31. Public debt as a share of GDP is likely to increase due to higher primary deficits, higher interest rates and lower growth
Figure I.32. Even though the rates of interest are expected to remain below the rates of growth, increasing debt could push up the former and lower the latter
Figure A1. Both industrial and trade policies are correlated with GDP per capita
Figure A1.1. Evolution of uncertainty in the global economy and U.S.
Figure A1.2. Evolution of economic uncertainty in EAP
Figure A2.1. The geopolitical risk has translated into a small premium on Brent crude oil prices
Figure A2.2. Depending on the duration and scale of any escalation, prices could rise but remain below $90/bbl; under a more extreme scenario, prices would hover around US$100
5. Special Focus: Firm Foundations of Growth
Figure II.1. Regional growth has been driven by capital accumulation rather than TFP
Figure II.B1.1
Figure II.4. Productivity growth in EAP has been driven primarily by increases in productivity within firms 50
Figure B1. Reallocation of employment towards more productive firms is low relative to the US 51
Figure II.5. New technologies have diffused rapidly in the EAP region 52
Figure II.6. New technologies matter for within-firm productivity growth
Figure II.7. In advanced economies, frontier firms are growing at a faster pace than other firms, especially in digital sectors
Figure II.8A. …but in the EAP region, productivity growth of frontier manufacturing firms has been slower than that of other firms…
Figure II.8B. …and similarly for frontier firms in services
Figure II.9. The national frontier in EAP countries is falling behind global frontier, especially in digital sectors
Figure II.10. Gaps in technological use between developing East Asia and advanced countries are wider for more sophisticated firms
Figure II.11. The wide technological sophistication gaps between the best national firms and the best firms globally is apparent in some countries in other regions
Figure II.12. Technological sophistication of the average firm in EAP is in line with similar income countries, but the most advanced firms in EAP are behind the most advanced elsewhere
Figure II.13 Use of advanced data analytics software is limited in developing EAP
Figure II.14. In principle, higher competition raises productivity growth of frontier firms
Figure II.15. Higher SOE presence is associated with lower entry and greater concentration
Figure II.16. Higher SOE presence in EAP is associated with lower and higher foreign firm presence with higher productivity growth of frontier firms
Figure II.17. SOEs account for large share of activity in EAP
Figure II.18. Firm entry has slowed in EAP, especially in digital sectors
Figure II.19. Most EAP countries restrict services trade more than other economies at comparable levels of development
52
54
56
57
57
59
60
61
61
62
62
63
63
64
65
Figure II.20. China, Lao PDR, Philippines and Viet Nam display border non-tariff measures higher than the world average
Figure II.21 More productive firms report trade regulations, workforce skills and transport or telecommunication infrastructure, as important constraints to business operations
Figure II.22. However, the most productive firms report fewer constraints relating to business licensing, corruption and the courts, electricity infrastructure or taxes
Figure II.23. High-speed broadband is unevenly available within and across EAP countries
Figure II.24. Skills are unevenly available in EAP
Figure II.25. The best managed firms in developing EAP have skills far below the best in advanced economies
Figure II.26. Openness to foreign investment is positively associated with technology diffusion and productivity
Figure II.27. Opening services to competition can increase productivity in these services sectors and downstream manufacturing sectors that use services inputs
Figure II.28. Diffusion of platforms in PHL can be seen as a competition shock that increases firm productivity
Figure II.29. Firm TFP or data analytics use is strongly associated with having both access to fiber broadband and foreign ownership
Figure II.30. More innovative firms have higher demand for analytical or interpersonal skills
68
69
69
70
70
71
72
72
73
73
74
This report is a collective endeavor and involved several parts of the World Bank including the EAP and EFI.
It was prepared by a core team comprising Francesca de Nicola, Daisuke Fukuzawa, Ergys Islamaj (Task Team Leader), Duong Trung Le, Jonathan Timmis and Aaditya Mattoo. Other members of the team were Omar Arias, Alessandro Barattieri, Caroline Gerd G De Roover, Jongrim Ha, Narya Ou, Agustin Samano, and Cecile Wodon.
Significant contributions to the first part of the report were made by Kevin C. Chua, Reno Dewina, Sebastian Eckardt, Jun Ge, Yusha Li, Yuntian Lu, Valerie Mercer-Blackman, Elitza Mileva, Veronica Sonia Montalva Talledo, Cordula Rastogi, Sharad Alan Tandon, Kaltrina Temaj, Anna Twum, Daria Ulybina, and Guillermo Verduzco Bustos.
The Special focus on “Firm Foundations of Growth” reflects joint work between EAPCE and IFC It benefited from significant contributions by Arlan Brucal, Xavier Cirera, Elwyn Davies, Edne Gambe, Leonardo Iacovone, Antonio Neto, Trang Tran, and analysis for the Philippines benefited from research collaborations with the ADB, namely, Benedict Evangelista, Jiang Yi and Martino Pelli.
Manuela V. Ferro provided valuable guidance and helpful comments. We are grateful for stimulating discussions, comments and inputs to Paolo Agnolucci, Maria Angelica, Jean Fransois Arvis, Diomedes Berroa, Dandan Chen, Alba Suris Coll Vinent, Ndiame Diop, Benedict Eijbergen, Yasser El-Gammal, Julia Fraser, Samuel Christopher Hill, Aleksander Kremer, Jessie McComb, Dawit Mekonnen, Lars Moller, Lalita M. Moorty, Alen Mulabdic, Rinku Murgai, Zafer Mustafaoglu, Coleman Nee, Cecile Thioro Niang, Habib Rab, Rajesh Rohatgi, Michele Ruta, Giovani Ruta, Mariam Sherman, Janmejay Singh, Carolyn Turk, Gonzalo Varela, Ekaterine T. Vashakmadze, Mara Warwick, Fabricio Zarcone, staff of the EAP region who participated in the review meetings on February 6 and March 5, 2024, and the EAP Regional Management Team meeting on March 7, 2024. We greatly appreciate the support for dissemination provided by Geetanjali Chopra, Mariana Lucia De Lama Odria, Mark Felsenthal, and Kym Louise Smithies.
The following staff from the Macroeconomics, Trade and investment Global Practice and the Poverty and Equity Global Practice prepared country-specific macroeconomic outlook pages: Dwi Endah Abriningrum, Vishesh Agarwal, Tanida Arayavechkit, Kiatipong Ariyapruchya, Mehwish Ashraf, Mahama Samir Bandaogo, Undral Batmunkh, Nadia Belhaj Hassine Belghith, Andrew Blackman, Yew Keat Chong, Kevin C Chua, Souleymane Coulibaly, Andrea Coppola, Kevin Thomas Garcia Cruz, Somneuk Davading, Quang Hong Doan, Kim Alan Edwards, Karen Annette Lazaro Enriquez, David M. Gould, Indira Maulani Hapsari, Rashad Hasanov, Faya Hayati, Ahya Ihsan, Assyifa Szami Ilman, Taufik Indrakesuma, Wendy Karamba, Demet Kaya, Yusha Li, Sodeth Ly, Dorsati Madani, Kemoh Mansaray, Wael Mansour, Pedro Miguel Gaspar Martins, Elitza Mileva, Thi Da Myint, Darian Naidoo, Shohei Nakamura, Konesawang Nghardsaysone, Thu-Ha Thi Nguyen, Ruth Nikijuluw, Samuel Nursamsu, Anthony Obeyesekere, Yus Medina Pakpahan, Utz Johann Pape, Keomanivone Phimmahasay, Ruslan Piontkivsky, Sharon Faye Alariao Piza, Warunthorn Puthong, Ririn Salwa Purnamasari, Rong Qian, Habib Rab, Ratih Dwi Rahmadanti, Thanapat Reungsri, Alief Aulia Rezza, Anna Robinson, Sutirtha Sinha Roy, Jose Luis Diaz Sanchez, Apurva Sanghi, Shakira Binti Teh Sharifuddin, Reshika Singh, Bambang Suharnoko Sjahrir, Lodewijk Smets, Katherine Anne Stapleton, Ekaterine T. Vashakmadze, Dung Viet Do, Veronica Sonia Montalva Talledo, Sharad Alan Tandon, Kathleen Victoria Tedi, Sailesh Tiwari, Kimsun Tong, Tuimasi Radravu Ulu, Phonthanat Uruhamanon, Ralph Van Doorn, Matthew Wai-Poi, Ikuko Uochi, Samuel Wills, and Judy Yang. The work was managed by Sebastian Eckardt and Lars Christian Moller for the Macroeconomics, Trade and investment Global Practice, and by Rinku Murgai for the Poverty and Equity Global Practice with support from Anna Twum (Macroeconomics, Trade and investment Global Practice). Benoit Philippe Marcel Campagne, Alexander Haider, Monika Anna Matyja, and Kristina Catherine Tan Mercado made contributions to the
model, table production, and assisting staff with their forecasts. Deviana Djalil, Sandra Buana Sari and Yu Shang provided technical support.
The report was edited and typeset by Circle Graphics, Inc., Reisterstown, MD.
Throughout the report, geographic groupings are defined as follows:
Developing East Asia and Pacific comprises Cambodia, China, Indonesia, Lao People’s Democratic Republic (PDR), Malaysia, Mongolia, Myanmar, Papua New Guinea, the Philippines, Thailand, Timor-Leste, Viet Nam, and the Pacific Island Countries.
The Pacific Island Countries comprise Fiji, Kiribati, the Marshall Islands, the Federated States of Micronesia, Nauru, Palau, Samoa, the Solomon Islands, Tonga, Tuvalu, and Vanuatu.
The ASEAN member countries comprise Brunei Darussalam, Cambodia, Indonesia, Lao PDR, Malaysia, Myanmar, the Philippines, Singapore, Thailand, and Viet Nam.
The ASEAN-5 comprise Indonesia, Malaysia, the Philippines, Thailand, and Viet Nam.
The analysis in this report is based on the latest country-level data available as of March 22, 2024.
AE Advanced Economy
AI Artificial Intelligence
ASEAN The Association of Southeast Asian Nations
COVID Coronavirus Disease
CPI Consumer Price Index
EFI Equitable Growth Finance and Institutions
EMBI Emerging market Bond Index
EMDE Emerging Markets and Developing Countries
EPU Economic Policy Uncertainty
EU European Union
EV Electric Vehicle
FDI Foreign Direct Investment
GDP Gross Domestic Product
GFC Global Financial Crisis
GNI Gross National Income
GVC Global Value Chain
HHI Herfindahl–Hirschman Index
HIC High Income Country
ICT Information and Communications Technology
IDS International Debt Statistics
IMF International Monetary Fund
LGFV Local Government Financing Vehicle
LMIC Lower Middle Income Country
MSME Micro, Small and Medium Enterprise
MPU Monetary Policy Uncertainty
Regions, World Bank Classification and Country Groups
EAP East Asia and Pacific
ECA Eastern Europe and Central Asia
NIPO
New Industrial Policy Observatory
NPL Nonperforming loans
NTM Non-tariff measures
OECD Organisation for Economic Co-operation and Development
pp Percentage point
PMI
Purchasing Manager’s index
PPP Purchasing Power Parity
RCEP Regional Comprehensive Economic Partnership
RHS Right Hand Side
ROW Rest of the World
SME Small and Medium Enterprise
SD Standard Deviation
SOE State-Owned Enterprise
STRI Services Trade Restrictions Index
TFP Total Factor Productivity
UMIC Upper Middle Income Country
UNFPA United Nations Population Fund
VAT Value Added Tax
VAR Vector autoregression
VIX Volatility Index
WDI World Development Indicator
WEO World Economic Outlook
WTO World Trade Organization
LAC Latin America and the Caribbean
MNA Middle East and North Africa
SAR South Asia
SSA Sub-Saharan Africa
Country/Economy Abbreviations
CHN China
EU European Union
FJI Fiji
FSM Federated States of Micronesia
HKG Hong Kong SAR, China
IDN Indonesia
JPN Japan
KHM Cambodia
KIR Kiribati
KOR Republic of Korea
LAO Lao People’s Democratic Republic
MNG Mongolia
MMR Myanmar
MYS Malaysia
NRU Nauru
Currency Units
B Thai baht
CR Cambodian riel
D Vietnamese dong
F$ Fiji dollar
K Myanmar kyat
K Papua New Guinea kina
Kip Lao kip
PHL Philippines
PICs Pacific Island Countries
PLW Palau
PNG Papua New Guinea
RMI Republic of the Marshall Islands
SLB Solomon Islands
THA Thailand
TLS Timor-Leste
TON Tonga
TUV Tuvalu
TWN Taiwan, China
UK United Kingdom
USA / US United States
VNM Viet Nam
VUT Vanuatu
WSM Samoa
P Philippine peso
RM Malaysian ringgit
RMB Chinese renminbi
Rp Indonesian rupiah
SI$ Solomon Islands dollar
Tog Mongolian tugrik
US$ Timor-Leste (U.S. dollar)
US$ United States dollar
Developing East Asia and Pacific is growing faster than the rest of the world but slower than before the pandemic. While recovering global trade and easing financial conditions are expected to support economies in the region, increasing debt, protectionism and policy uncertainty could dampen growth.
Regional growth is projected to ease to 4.5 percent in 2024 from 5.1 percent last year. Growth in developing East Asia and Pacific excluding China is projected to pick up to 4.6 percent this year from 4.4 percent in 2023. Growth in China is projected to moderate to 4.5 percent this year from 5.2 percent in 2023, because of near term problems, such as high debt and a weak property sector, as well as longer-term challenges, such as aging and trade frictions. Growth among Pacific Island countries is forecast to decline to 3.6 percent in 2024 from 5.6 percent last year, as the post-pandemic rebound dissipates.
EAP’s current macroeconomic challenges risk obscuring the microeconomic foundations of longer-term growth. Over the last decade, growth has been driven primarily by investment rather than by increased productivity of firms. Now private investment is weak and productivity declining – further inhibiting the incentive to invest. Firms are the protagonists of productivity growth. Some of the less productive firms in EAP countries are beginning to catch up with the more productive ones. But the most productive firms in the region are not taking full advantage of new technologies and not seeing the productivity growth of the leading global firms. For example, in digital manufacturing sectors, such as electronics, between 2005 and 2015 the productivity of the top 5 percent of firms globally increased two-and-a-half times faster than the top firms in Indonesia, Malaysia, the Philippines and Viet Nam.
Both incentives and capacity are a problem. Incentives for firms to compete and innovate have been diluted by explicit protection in services and implicit protection in goods. The capacity to manage and innovate has been undermined by the inadequacy of skills. Using industrial policies to improve incentives and capacity will be hard because both fiscal resources and institutional capability are limited. Instead, bold policy action to unleash competition, improve infrastructure and reform education could revitalize the region’s economy.
Most economies in developing East Asia and Pacific (EAP), other than several Pacific Island Countries, are growing faster than the rest of the world (figure O1A; table O1), but slower than before the pandemic.
• Growth in China is projected to slow to 4.5 percent in 2024, from 5.2 percent in 2023, as the bounce back from the re-opening of the economy fades and proximate problems, such as elevated debt and weakness in the property sector, as well as longer-term structural factors, such as aging and trade frictions, weigh on growth.
• The rest of the EAP region, which had suffered in 2023 from slow trade growth and tight financial conditions, is expected to grow by 4.6 percent in 2024. The likely rebound in global goods trade and the gradual easing of global financial conditions are expected to offset the impact of China slowing down.
• The Pacific Island countries are expected to see slower growth at 3.6 percent in 2024, as the post-COVID-19 rebound dissipates and the region moves towards its estimated long-term trend growth of 2.6 percent. While output per capita has surpassed pre-pandemic levels in most of the larger EAP economies, Myanmar, Papua New Guinea, Timor-Leste and several Pacific Island Countries are still struggling to get back to pre-pandemic levels (figure O1B).
Figure O1. The EAP region is growing faster than the rest of the world but slower than before the pandemic in most major economies; output per capita is still below pre-pandemic levels in most Pacific Island countries and declined further in some
Economic performance in the region is being shaped by external and domestic developments (figure O2). The key external factors are recovering trade but an increase in trade protection combined with industrial policies, and still tight financial conditions. Among the domestic factors, the most important are amplified public and private debt; the constrained policy stance, especially fiscal and monetary; and increased political and policy uncertainty.
First, global trade is recovering even though global GDP growth is slowing down. Trade in goods and services grew only by 0.2 percent in 2023 but is projected to grow by 2.3 percent in 2024 – even though GDP growth will slow down from 2.6 percent in 2023 to 2.4 percent in 2024 (figure O3). The projected recovery in trade is attributable to improved real incomes, as wage growth outpaces inflation, and demand shifts back towards more tradable goods from less tradable services. Second, even though inflation has been declining in major economies, core inflation in the US and EU remains elevated and labor markets remain tight, suggesting interest rates will remain higher than pre-pandemic levels in the in the foreseeable future. Third, almost 3,000 new trade-distorting measures were imposed in 2023, three times as large as those in 2019.
A significant proportion of trade-distorting measures took the form of industrial policy. First, the most active users of industrial policy are the G-20 countries, such as the US, China, India and most of the countries in the EU (figure O4). Second, the number of industrial policy measures implemented also correlates positively with the level of development, except in the case of Brazil, China, India, and Russia. Third, the EAP countries (other than China and Indonesia) were less prone to implementing industrial policies compared to other countries of similar size and level of development. Finally, the EAP countries are potentially exposed to the trade-distortive effects of such policies because the US, China, the Republic of Korea, and Japan are important destination markets, and because the firms receiving subsidies are potential competitors of EAP firms.
Figure O4. The rich and large countries, i.e. the G20, are the prime practitioners of industrial policy
Sources: World Bank staff elaborations on data from NIPO and World Development Indicators. Note: New industrial policies, as defined by the NIPO, include both domestic industrial policies, as well as export promotion schemes and import trade barriers. All the potentially trade distortive measures are included.
Macroeconomic policy has retreated in most economies from the expansionary stance in the 2020–2022 period. Major economies in the region are projected to have a positive or neutral fiscal structural balance in the 2023–24 period compared to previous years (figure O6A). At the same time, policy interest rates have been raised in the EAP region to address the threat of inflation but remain lower than in other emerging market and developing economies (figure O6B) - because the region has generally been less affected by inflationary pressures and central banks have also utilized other monetary policy measures, such as adjusting reserve requirements. However, inflation has remained stubbornly high across the Pacific Island Industrial Policies: Measures vs. Development, 2023
Both private and public debt have increased significantly as a share of GDP in most of the region’s economies (figure O5A). Corporate debt has increased in China and Viet Nam by more than 40 percentage points of GDP since 2010, and now exceeds the level in advanced economies. A 10 percentage points increase in private debt to GDP is associated with a 1.1 percentage point decline in investment growth. And household debt is now much higher in China, Malaysia and Thailand compared to levels in other emerging markets. Furthermore, public debt as a share of GDP is likely to increase due to higher primary deficits, higher interest rates and lower growth (figure O5B). Highly indebted countries such as Lao PDR have experienced a large increase in interest payments in 2023. High debt is associated across countries and over time with lower growth and higher interest rates (EAP Update April 2021).
Figure O5. Private and public debt is higher than before the pandemic; public debt as a share of GDP is likely to increase due to higher primary deficits, higher interest rates and lower growth
A. Private and public debt
Source: Institute of International Finance; World Economic Outlook, IMF, World Bank staff estimates.
B. Contribution to debt-to-GDP


Contribution of primary deficit
Contribution of growth relative to interest rate
Note: A. Bars show median debt/GDP for EAP economies; private debt refers to nonfinancial corporate debt. B. Dotted area shows projections. See notes in Figure 31 for methodology.
Figure O6. Fiscal policy has become less expansionary in most countries, while monetary policy has tightened in the region, except in China and Viet Nam
A. Change in structural balance B. Policy rate
Source: International Monetary Fund, Haver Analytics.
Countries, as well as in Mongolia, Lao PDR and Myanmar, reflecting the raising prices of some commodities like rice, high dependence on imports, and/or rapid depreciation of currencies. China and Viet Nam are the two countries where rates have recently been reduced due to weak domestic demand and distressed corporate sectors.
Economic policy uncertainty index in the region has increased in recent years (figure O7). Political developments within countries as well as rising geopolitical tensions are fueling uncertainty. The resulting lack of predictability or clarity about government policies, market conditions, or geopolitical events, has a negative impact on investment growth, as investors hesitate to invest in new projects or expand their existing businesses.
Ì The impact of external and domestic factors
O7. Economic policy uncertainty has increased in the US and China World and economic policy uncertainty
shows median of Indonesia, Malaysia, Thailand, Philippines and Viet Nam using World Uncertainty Index’s 4-quarter moving average. “Global” shows global Economy Policy Uncertainty index. 3-quarter moving average.
A growth shock originating in the region’s largest trading partners, China and the US, would impact EAP economies through bilateral trade and financial flows, including foreign direct investment (FDI) (World Bank 2023a). An unexpected 1 percentage point decline in US (China’s) GDP growth rate would decrease growth rate in the other developing EAP countries, on average, by an estimated 0.5 (0.3) percentage points (figure O8A). Unanticipated shocks to US monetary policy also affect growth; a 25 basis points increase lowers growth by an estimated 0.5 percentage points.
Figure O8. Growth in the region is influenced by development in the region’s largest trading partners
A. Impact of 1 pp decrease in China and US GDP growth, and 25 bps increase in US 2-year yield
B. Impact of 1 std uncertainty shock in US and China of EAP industrial output growth
Source: World Bank staff’s estimations. Notes: The results are based on a panel Vector autoregressions for Indonesia, Malaysia, Philippines and Thailand. A. Bars show impact of the following shocks: one percentage point decrease in China and US growth, and 25 bps increase in US 2-year interest rate yield. Effects estimated using a structural Bayesian VAR model. B. Bars show dynamic responses of EAP productions to a one-standard-deviation increase in macroeconomic uncertainty in the US and China. See Box A1 for further details.
Apart from changes in the level of macroeconomic variables in the US and China, an increase in macroeconomic uncertainty also has an impact on EAP countries, by inhibiting investment and consumption. A one standard deviation increase in macro uncertainty in the US and China is associated with, respectively, a 0.5 and 0.3 percentage point decline in industrial output growth and a 3 percent drop in asset prices in EAP within one year (figure O8B).
Even though retail sales of most countries surpassed their pre-pandemic levels, the growth trend of retail sales is lower than the pre-pandemic rate in most EAP economies (Figure O9). Proximate factors such as an increase in household debt (e.g., in Malaysia, Thailand), depreciated property values (e.g., in China), and increased political uncertainty have weighed on consumer confidence and hence spending.
Private investment as a share of GDP has been lower than pre-pandemic levels in developing EAP in recent years (figure O10), due to higher debt, interest rates and policy uncertainty. Public investment generally supported economic activity during the pandemic and exceeded the pre-pandemic levels in terms of GDP share in Indonesia, Philippines, Thailand, and Viet Nam.
After falling by more than 20 percent from their peak in the second quarter of 2022 in Indonesia and Malaysia, and by more than 10 percent in China and Viet Nam, goods exports across EAP countries have begun to recover with the world economy during the second half of 2023 (figure O11A). As of Q4-2023, goods export growth had returned to or been approaching positive territory in China, Thailand, and Viet Nam. The revival of tourism has helped services exports in Malaysia and Fiji, but on average total tourist arrivals (and tourism receipts) seem to have plateaued below the pre-pandemic level, in part because Chinese tourists have not returned in pre-pandemic numbers (figure O11B).
Figure O10. Private investment as a share of GDP is lower than before the pandemic and so, in some countries, is public investment
Figure O11. Goods exports are beginning to recover but slowly; tourist arrivals have plateaued below pre-pandemic levels in several economies
Goods exports (year-on-year growth)
B. Tourist arrivals compared to pre-pandemic Source: Haver Analytics.
After a strong post-COVID rebound in early 2023, growth momentum in China has slowed. Deflationary pressures, falling capacity utilization, and a sluggish labor market suggest that aggregate demand is falling short of aggregate supply. Investment in infrastructure and real estate – major drivers of rapid growth in recent decades – has slowed significantly, as the property market is undergoing a protracted but necessary correction while high debt levels and diminishing returns to investment constrain further infrastructure expansion. China is aiming to transition to a more balanced growth path but the quest to ignite alternative demand drivers is proving difficult.
A central challenge is the high rate of savings and hence the relatively low domestic consumption (figure O12A). To sustain aggregate demand, China needs high rates of investment, high levels of export, or high levels of government spending. Over the past decade China did succeed in reducing its dependence on exports and switching from external to domestic sources of demand. But the result was a domestic imbalance, with a heavy reliance on investment in infrastructure and real estate. Now China is attempting a rebalancing within investment, favoring advanced manufacturing (figure O12B). The risk is a new imbalance could emerge between manufacturing capacity and demand, both domestic and international.
To support aggregate demand, the government has announced moderate macroeconomic stimulus. The government’s cautious macroeconomic policy approach suggests that it is seeking to strike a balance between providing near-term stimulus and achieving the longer-term goal of stable and sustainable growth. Addressing structural imbalances in aggregate demand will require more than conventional fiscal stimulus. Instead, reforms that reduce precautionary savings, such as strengthening social protection and pension, more progressive taxation, and reallocation of public spending from infrastructure to human capital, would stimulate consumption and lead to more balanced growth. At the same time, a transparent and predictable policy environment and equal treatment of enterprises regardless of ownership would support investor confidence and encourage private investment while allowing market forces to play a greater role in the allocation of capital, mitigating risks of over-capacity.
Figure O12. The consumption share of GDP remains relatively low in China; investment is growing faster in manufacturing but is slowing down in infrastructure and real estate
Table 1. GDP growth forecast
Source: World Bank; World Bank estimates and projections. Note: Percent growth of GDP at market prices. Values for 2023 for the small island economies refer to GDP growth estimates. Values for Timor-Leste represent non-oil GDP. For the following countries, values correspond to the fiscal year: Federal states of Micronesia, Palau, and Republic of the Marshall Islands (October 1–September 30); Nauru, Samoa, and Tonga (July 1–June 30). Myanmar growth rates refer to the fiscal year from October to September.
While growth in per capita incomes in the EAP region has surpassed that in most other emerging market and developing economies in the last two decades, it was driven primarily by investing in capital rather than improvements in total productivity growth (figure O13). Growth in labor productivity can arise from greater capital (capital deepening), improvements in human capital (through education and skills) and higher total factor productivity or TFP (the part of production that is attributable to innovation because it cannot be explained by increases in quantities of labor or physical and human capital). In the long-run, productivity (TFP) – the efficiency with which inputs are transformed into outputs - is the key driver of growth. Understanding the sources of declining productivity growth in EAP economies would help design policies that support longterm growth.
The special focus of this Update examines the challenge of productivity growth through novel firm level analysis; the factors behind its slowdown; and what policies would reignite TFP, a vital driver of economic growth.
Ì What has happened to firm-level productivity?
Aggregate productivity growth is a dynamic process involving: (i)productivity growth within existing firms; (ii) the reallocation of market share to more productive firms; and (iii)firm entry and exit (figure O14). Correctly diagnosing the sources of the productivity slowdown matters for prescribing the right policies.
In many East Asian economies, productivity growth is mostly due to improvements in productivity within existing firms (figure O15). In this respect, firms in the region resemble those in other countries, including the US but also Latin America and in Eastern Europe. Since most productivity growth has been due to within firm productivity growth, the slowdown in aggregate productivity is likely to reflect a slowdown in within-firm growth. Why the productivity slowdown has come at a time of rapid technological progress is a puzzle.
Figure O15. Productivity growth in EAP has been driven primarily by increases in productivity within firms
USA - Manufacturing (1997–2013)
CHN - Manufacturing (2007–2013)
MYS - Manufacturing (2000–2015)
CHN - Manufacturing (1998–2007)
IDN - Manufacturing (1996–2015)
PHL - Manufacturing (2012–2018)
PHL - Services (2012–2018) VNM - Manufacturing (2001–2011)
VNM - Manufacturing (2011–2021)
VNM - Services (2011–2021)
Source: Indonesia, Malaysia, Philippines and Viet Nam reflects authors’ calculations using Statistical Office micro-data, China is taken from Brandt et al. (2020), USA is taken from Pancost and Yeh (2022).
Notes: Decompositions calculated at the 2-digit level and aggregated using value-added weights. Chart reflects the average of 5 or 6 yearly productivity changes, over the periods mentioned in the legend (5 or 6 years depends upon country data availability). Note entry reflects only entry of young firms, entry into the survey due to sampling changes have been excluded.
Ì What has happened to productivity within frontier and laggard firms?
In the 1990s, new technologies were being adopted earlier by EAP frontier firms, defined as the most productive ones in a country, but diffusing more slowly to other firms than had been the case in the past (Cirera et al., 2021; Innovation Imperative Report). This pattern was consistent with the experience of advanced economies.
However, the productivity growth of the national frontier firms in EAP economies has been falling further behind the global frontier in digital-intensive sectors in recent years, such as electronics (figure O16). The slowdown in growth of the national frontier is starker in digital-intensive sectors – the same sectors where the best firms in rich countries are pulling away. For example, in digital manufacturing sectors, between 2005 and 2015 the productivity of the global frontier increased by 76 percent, whereas the national frontier firms in Indonesia, Malaysia, the Philippines and Viet Nam increased their productivity by only 31 percent on average. For less digital-intensive sectors, the gap between the national frontier firms and the global ones is less stark. The relative stagnation of the national frontier is also observed in developing countries beyond EAP, though to a lesser extent. Since new technologies typically arrive first at the frontier, and then spillover to other firms, revitalizing the national frontier firms matters for the future growth of all firms.
Advanced digital technologies, such as data analytics, are diffusing slowly to the national leaders in EAP. Unsurprisingly, firms in developing East Asia are less sophisticated than those in the advanced countries. However, whereas the average firm in EAP is somewhat behind the average firm in advanced economies, the most sophisticated firms in EAP are far behind the most sophisticated firms globally (Cirera et al., forthcoming). The relative lack of sophistication of the national frontier is also true beyond East Asia, although to a somewhat lesser degree.
Figure O16. The national frontier in EAP countries is falling behind the global frontier, especially in digital sectors
Distance between national and global frontier
A. Digital-intensive sectors
Source: Authors’ calculations using Statistical Office micro-data and Criscuolo et al. (2023) for global frontier.
B. Less digital-intensive sectors
0)
- Manufacturing MYS - Manufacturing CHN - Manufacturing IDN - Manufacturing PHL - Manufacturing PHL -Services
Notes: National frontier is defined as in the previous figure (the 90th percentile firm productivity for each country and industry). Digital intensity of sectors is defined according to Eurostat.
EAP’s relative inertia in productivity growth may be because frontier firms do not have adequate incentives and because all firms lack the relevant capabilities. The most productive firms in East Asia and Pacific are more likely to identify barriers to trade, paucity of skills and weakness in the transport and telecommunications infrastructure, as key constraints (figure O17).
Firms require the right incentives
Figure O17. More productive firms report trade regulations, workforce skills and transport or telecommunication infrastructure, as important constraints to business operations
Constraint severity by labor productivity quartile (versus bottom quartile)
Low levels of competition could explain the relatively low productivity growth of frontier firms in EAP. Higher competition (or the threat of competition), which can come from openness to trade and investment, increases the incentives for frontier firms to innovate and grow (Aghion et al., 2009, 2021). While manufacturing tariffs are relatively low in EAP countries, tariffs in agriculture and non-tariff measures in manufacturing still limit competition. Furthermore, product market regulations in China and Indonesia are 50 percent more restrictive than in the US (OECD). Some EAP markets, for example in Viet Nam, are dominated by State Owned Enterprises (SOEs) that can also influence competitive conditions. In
Source: World Bank Enterprise Surveys. Notes: Manufacturing labor productivity quartiles are calculated within each country and year (applying sampling weights). Scores reflect the severity of constraint reported by firms (on the scale 0 to 4) within each quartile , relative to the bottom quartile least productive firms. Presents the results of firm-level regressions of reported constraints on labor productivity quartiles, controlling for firm size and country and year fixed effects. Reflects data for 13 low- and middle-income EAP countries.
EAP, the number of startups has fallen dramatically over the past decades, especially in digital-intensive sectors, and the region is increasingly full of aging incumbents.
Frontier firms in EAP that are more exposed to competition show faster productivity growth (figure O18). Foreign owned frontier firms showed 5 per cent faster annual productivity growth than other frontier firms, whereas state-owned firms have 3 per cent slower productivity growth. Moreover, competition from foreign firms or state-owned firms within a sector can have important indirect spillovers on the growth of domestically or privately owned frontier firms.
Figure O18. Higher SOE presence in EAP is associated with lower and higher foreign firm presence with higher productivity growth of frontier firms
Source: Authors’ calculations using Statistical Office micro-data for China, Indonesia and the Philippines.
Firms require the right capabilities
Productivity growth and adoption of sophisticated technologies require advanced skills and high-quality digital infrastructure. While access to mobile broadband is widespread in EAP, high-speed fiber is unevenly available across and within countries. Some technologies (such as e-commerce) need only basic mobile broadband. In contrast, modern data technologies (such as data analytics or cloud computing) require high-speed fiber broadband to send and receive data to and from customers/ suppliers/within firms, and the right combination of digital and management skills to embed data-driven decision making within businesses.
Access to skills and modern data infrastructure is uneven in the EAP. In 14 of the region’s 22 middle-income countries, more than half of 10-year-olds are unable to read and understand an age-appropriate text. Even basic digital skills are not widely available in EAP, with less than a quarter of workers in Cambodia, Mongolia, Philippines, Thailand, and Viet Nam able to use the “copy and paste” function in a document. Over 50 percent of innovating firms in Indonesia, Malaysia, Myanmar, the Philippines, Thailand, and Viet Nam cite a lack of managerial and leadership skills as a challenge when hiring new workers (World Bank 2022, Innovation Imperative in East Asia). The average firms in both developed and developing EAP are on average less well managed than the US (see Figure O19). However, the best managed firms in developing EAP are behind the best managed in advanced EAP and far behind the best managed in the US.
While it may be presumed that capacity issues are purely an issue for laggard firms, our evidence in the previous section showed that frontier firms also do not have sufficient capacity in some respects, such as management skills. We highlight complementary reforms to boost competition, digital infrastructure and skills as policy priorities for reigniting frontier firm productivity.
Reform of goods and services markets can spur competition and accelerate productivity growth. While EAP goods markets are relatively open, liberalization of remaining tariffs and the relatively opaque non-tariff measures (NTMs) could increase exposure to competition at home and equip firms to compete abroad. For example, a recent survey reveals that 55 percent of exporters in the EAP region see NTMs as a burden limiting their ability to expand into new markets (ITS, 2023). Elimination of restrictions on entry and operation in services too could have a pro-competitive impact (World Bank 2023). For example, services reforms in Viet Nam are associated with a more than 3 percent increase in labor productivity of firms in these same sectors as well as downstream manufacturing (figure O20).
Competition-enhancing policies have larger impacts when combined with infrastructure-improving policies and investment. Initial evidence from the rollout of the Philippines’ fiber backbone to 12 provinces suggests that this leads to increased use
Figure O20. Opening services to competition can increase productivity of services sectors and downstream manufacturing sectors
A. Productivity effects of service reform on services firms (own-effect)
B. Productivity effects of services reform on manufacturing firms (downstream effect)
Source: World Bank staff estimation based on data from Viet Nam enterprise surveys 2008 and 2016.
Note: OLS regression results. The dependent variable is the change in log value-added per worker between 2016 and 2008. The main explanatory variable is the change in STRI values in Trade, Transport, Finance, Professionals, and Telecommunication sectors between 2016 and 2008 in Panel A, and the change in the “downstream” STRI for manufacturing sectors in Panel B. The downstream STRI is a sector-specific measure for each 2-digit manufacturing sector, calculated by the average STRI of the above five services sectors weighted by the corresponding purchasing value from each manufacturing sectors. The regression sample in panel A consists of all enterprises operating in Trade, Transport, Finance, Professionals, and Telecommunication sectors, and all manufacturing enterprises in Panel B, in 2008 and 2016. All regressions control for firms’ baseline revenue and employment. Standard errors clustered at the industry level.
of e-commerce, but mainly for firms with higher quality connections and for firms in more competitive sectors. Openness to foreign competition and access to fiber broadband for firms in the country both individually increase technology adoption, but their combined impact is more than double.
Improving human capital is imperative and has at least three dimensions. First is fixing the foundation of basic skills on which more advanced skills can be built (World Bank 2023). Teacher knowledge of content and teaching methods have been identified as key problems. Investing in teacher training is estimated to produce benefits in terms of discounted life-time earnings that are ten times larger than the costs.
Second, individuals must be equipped with the skills to work with new technologies as well as the ability to innovate. That requires an emphasis on investments in tertiary education to develop workers’ advanced cognitive, technical, and socioemotional skills. To remedy these gaps, students need to be exposed early to a range of tasks, from the factory floor to R&D departments. Links need to be strengthened between research institutions and firms, including through incentives for research institution-industry collaboration.
Third, is enhancing the abilities of managers already in the work force. Differences in management quality are an important contributor to productivity differences across countries. Recent research suggests that management quality can be improved. For example, firms provided with management consulting in Colombia improved their management practices and increased employment (Iacovone et al., 2022). Both intensive and expensive one-on-one consulting and consulting in small groups of firms led to improvements in management practices of a similar magnitude (8–10 percentage points) and in firm sales, profits and labor productivity. Such targeted support can be especially effective when combined with fostering competition, which motivates managers skill upgrading (McKenzie, 2023).
Most of developing East Asia and Pacific (EAP), other than several Pacific Island countries, is growing faster than the rest of the world but growth is slower than before the pandemic. In 2023, China’s economy grew by 5.2 percent and the rest of the region by 4.4 percent (figure I.1), slower than the 6.7 percent and 4.9 percent, respectively, recorded during the 2015–19 period. The Pacific Island Countries, grew by an estimated 5.6 percent in 2023, faster than the 3 percent during 2015–19 period.
Figure I.1. The EAP region is growing faster than the rest of the world but is on a slower growth trajectory than before the pandemic
A.GDP growth across country groups
Growth in the region is forecast to tick up to 4.5 percent in 2024, but still lower than before the pandemic, as global conditions continue to improve, and inflationary pressures decline further. China is forecast to grow by 4.5 percent in 2024 as the bounce back from the re-opening of the economy fades and both proximate problems, such as elevated debt and weakness in the property sector, as well as longer-term structural factors, such as aging and decoupling, weigh on growth. The rest of the region, which had suffered in 2023 from slowing global growth and tightening financial conditions, is expected to grow by 4.6 percent in 2024. The likely recovery of global trade and the expected easing of global financial conditions are expected to offset the impact of China slowing down. The growth rate in the Pacific Island countries is expected to moderate to 3.6 percent in 2024, as the post-CovID-19 rebound dissipates.
While output per capita has surpassed pre-pandemic levels in most of the larger EAP economies, recovery has been uneven across the region. Per capita output in China and viet nam had already exceeded pre-pandemic levels in 2020 and is now about 20 percent and 15 percent higher, respectively. By the end of 2022, only Cambodia, Indonesia, lao PDR, Malaysia, and one Pacific Island country, Kiribati, had also exceeded pre-pandemic levels of output per capita. By the end of 2023, Mongolia, the Philippines, Thailand, and two more Pacific Island countries (Fiji and Tuvalu) are estimated to have exceeded pre-pandemic levels of output per capita. But output remains below pre-pandemic levels in the rest of the Pacific Island countries (PICs) as well as in Myanmar and Papua new Guinea (figure I.2).
Figure I.2. output per capita rose above pre-pandemic levels in 2023 in a majority of EAP economies, but declined further in some Pacific Island Countries
Source: World Economic outlook database, International Monetary Fund; United nations; World Bank.
The recovery has also been uneven across sectors. Information and communication technology and finance have experienced relatively strong growth. services sectors started to recover after economic reopening in several of the region’s economies, benefitting from the release of pent-up demand. However, output in transportation, accommodation and catering sectors in the Philippines and Thailand, and construction and real estate in Malaysia and the Philippines is still well below pre-pandemic levels (figure I.3). Manufacturing recovered strongly in the aftermath of CovID-19 but has recently slowed down and its output is now below pre-pandemic levels in Thailand.
Poverty rates in the region continue to decline (figure I.4). China’s pace of poverty reduction picked up in 2023 after a relatively modest performance in 2022. This faster pace is expected to continue over the next years based on the upper-middle income
Figure I.3. Across sectors, ICT, finance and retail are growing rapidly, while tourism and real estate are still lagging
Growth of sectoral output (2019Q4 = 100)
Source: Haver Analytics.
poverty line (Us$6.85/day, 2017 PPP) although still at a slower pace than in the pre-pandemic years. Its poverty rate at the lowermiddle income poverty line (Us$3.65/day, 2017 PPP) reached a historic low in 2023, falling to less than 1 percent. In the rest of the region, the rate of poverty reduction will also pick up in 2023, averaging around a third of China’s rate. overall, 9 million people in the region are projected to escape poverty between 2023 and 2024 based on the lower-middle income poverty line, whereas 34 million people are projected to escape poverty based on the upper-middle income poverty line. Despite the notable progress in poverty reduction, the fruits of economic progress are not always distributed to households and pockets of extreme poverty remain in the region (box 1).
Box 1. The last mile in poverty reduction in the EAP region: The case of Papua New Guinea
Although EAP countries have successfully reduced the population living in extreme poverty (with consumption above $2.15 per day, 2017 PPP), significant pockets of extreme poverty remain in the region. Moreover, poverty is multi-dimensional and significant deprivations may persist despite improvements in household incomes.
An analysis of the experience of Papua new Guinea (PnG) by Baxi et al. (2024) illustrates this. About 40 percent of the population in PnG was living in extreme poverty in 2009, the latest official estimate available. This accounted for 10 percent of the total population in extreme poverty in the EAP region. There is evidence that despite PnG’s significant economic growth, aided by a boost in external aid, extreme poverty remains stubbornly high. Average annual per capita GDP growth in PnG was 3.3 between 2010 and 2017. Predictions of monetary poverty using household survey data from 2016–2018 suggest that monetary poverty barely changed during the period (figure B1.1; Baxi et al. 2024). Moreover, a majority of the population lacks access to electricity and adequate water and sanitation services, and 20 percent live in a household in which no adults finished primary school. These indicators did not improve since 2009 (figure B1.1).
Figure B1.1. Extreme poverty (monetary and non-monetary) has remained stubbornly high in Papua new Guinea
Economic growth in PnG is primarily driven by the extractive industries, which employ a small share of the population (UnFPA 2023). For the benefits of such growth to trickle down, it would have to spur economic activity in other sectors, and/or the gains need to be redistributed through public investment and transfers to the population. There is (continued)
(Box 1. continued)
evidence that neither has occurred sufficiently. studies suggest that a constraining business environment and low human capital hinder spillovers and the prevalence of clientelism undermine the incentives to prioritize basic services (Pandey and Howes 2022; World Bank 2018, 2023). Even the better-off population in PnG faces significant non-monetary deprivations (Baxi et al. 2024).
The need to focus on multiple dimensions of poverty is relevant for the EAP region more broadly. While extreme monetary poverty is low across the region, significant deprivations persist. In half of the countries in the region, at least 18 percent of the population still lack adequate access to sanitation, and in a quarter of countries, at least 40 percent of the population lack adequate access (figure B1.2). In a quarter of the countries, at least 20 percent lack adequate access to electricity.
Figure B1.2. non-monetary measures suggest pockets of significant deprivation in the region
Share of the population in extreme monetary poverty, without access to basic services and with low educational attainment in EAP
Poverty Poor Educational AttainmentHH Adults
2009
Sanitation Water
Sources: HIEs, 2016–18 DHs, WDI, World Bank’s 2023 Macroeconomic and Poverty outlook. Notes: Data from the World Bank’s Poverty and Inequality Platform based on nationally representative Household surveys. The Figure depicts the median share of the population deprived across a sample of countries, and the 25th and 75th percentiles. The figures use the most recent (available) data from 2010–2022. The countries included are Fiji, Indonesia, Kiribati, lao PDR, Marshall Islands, Federated states of Micronesia, Mongolia, Myanmar, nauru, Philippines, samoa, solomon Islands, Thailand, Timor-leste, Tonga, Tuvalu, vanuatu, and viet nam.In most major EAP economies, private consumption, bouncing back from CovID-19 and inflation-induced austerity, sustained growth during 2023. Meanwhile, exports of both manufactured goods and commodities have contracted, while services exports have supported growth in Malaysia, the Philippines and Thailand (figure I.5). Public investment has supported growth in China, Indonesia and the Philippines, but private investment remains low in much of the region. Fiscal policy is now less expansionary in most countries.
Figure I.5. Private consumption has sustained growth in all the major countries; services exports have helped in Malaysia, the Philippines, and Thailand, and public investment in China, Indonesia and the Philippines; private investment and goods exports remain weak
Contribution to growth
Source: Haver Analytics. Note: China’s
Economic performance in the region is being shaped by external and domestic developments (figure I.6). The key external factors are recovering trade but an increase in trade protection combined with industrial policies, and still tight financial conditions. Among the domestic factors, the most important are the amplified public and private debt, the constrained policy stance, especially fiscal and monetary, and increased political and policy uncertainty.
First, global trade is recovering even though global GDP growth is slowing down. Trade in goods and services grew only by 0.2 percent in 2023 but is projected to grow by 2.3 percent in 2024 – even though GDP growth will slow down from 2.6 percent in 2023 to 2.4 percent in 2024 (figure I.7). The projected recovery in trade is attributable to improved real incomes, as wage
Figure I.6. External and domestic factors affecting economic growth
Source: World Bank staff illustration.
Figure I.7. Three linked international developments will shape economic performance in the EAP countries: recovering global trade, increasing trade-distorting measures, and tight financial conditions
Global GDP and trade growth
New trade-distorting measures C. Interest rates
growth outpaces inflation, and demand shifts back towards more tradable goods from less tradable services. second, even though inflation has been declining in major economies, core inflation in the Us and EU remains elevated and labor markets remain tight, suggesting interest rates will remain higher than pre-pandemic levels in the in the foreseeable future. Third, almost 3,000 new trade-distorting measures were imposed in 2023, three times as large as those in 2019.
Recent years have been marked by a surge in potentially trade-distortive industrial policy (IP) actions in many countries. The term “industrial policy” is broad, and it includes many types of different interventions targeting specific sectors (such as domestic subsidies, financial grants, tax-breaks). But these measures may have trade-distortive effects, for instance due to local content requirements that could hurt exports of developing EAP countries. The number of new protectionist measures taken by other countries affecting the region’s economies has been increasing in recent years and so have the number of measures introduced by developing EAP economies (figure I.8; box 2).
Figure I.8. The number of new trade-distorting measures implemented against EAP countries have been rapidly increasing while those implemented by EAP countries have declined in recent years
A. Number of newly-introduced trade measures affecting China
B. Number of newly-introduced trade measures affecting developing EAP excluding China
Source: Global Trade Alert. Note: figures show the number of new harmful measures implemented, adjusted for reporting
Measures implemented by China
Measures implemented by EAP excluding China
Box 2. EAP and potentially trade-distortive protectionist and industrial policies
The new Industrial Policy observatory (nIPo), a new database released in January 2024 (Evenett, Jakubik, Martín, Ruta, 2024) allows a closer look at industrial policies during 2023. one important innovation in the nIPo, compared to the more comprehensive data from which it is derived (the Global Trade Alert), is that, in many instances, it also provides an estimate of the dollar amount pledged by the governments in a specific policy action. While the latter measure is imperfect (the dollars amount could refer to measures with different time horizons), there’s a strong positive correlation between the total spending planned on industrial policy and the numbers of measures implemented (Figure B2.1).
Three facts emerge from a first look at the new data on industrial policy measures. First, the most active countries engaging in industrial policy are the countries of the G-20, such as the Us, China, India and most of the countries in the EU (figure B2.2).
Figure B2.1. The number of industrial measures strongly correlates with the dollars spent
Industrial Policies: Expenditures vs Measures, 2023
second, the number of industrial policy measures implemented also correlates positively with the level of development, with the exceptions of Brazil, China, India, and Russia, which were more active in this space than predicted by their per capita GDP. lastly, the EAP countries (other than China and Indonesia) were less prone to implementing industrial policies compared to other countries of similar size and level of development.
Sources: EAP Chief Economist office elaborations on data from nIPo and World Development Indicators. Note: new industrial policies, as defined by the nIPo, include both domestic industrial policies, as well as export promotion schemes and import trade barriers. All the potentially trade distortive measures are included.
In the appendix, we present a version of Figure B2.2 where we consider separately industrial policy measures, such as subsidies, and trade policy measures, such as import restrictions. Industrial policies represent two-thirds of total measures. In both cases, we find a positive correlation between the number of measures and the GDP per capita of countries.
EAP countries are potentially exposed to the trade-distortive effects of such policies, for two reasons. First, Us, China, the Republic of Korea, and Japan are important destination markets for developing EAP countries exports. second, firms receiving subsidies in large and developed nations are potential competitors of the EAP countries’ firms.
An important aspect to consider for the EAP countries going forward, will be the interaction between the deployment of these policies by countries who represent important or potentially important export markets, and the development new preferential trade agreements, or the progressive implementation of existing ones (such as the RCEP).
Ì Debt
Debt as a share of GDP increased over the last decade in most EAP countries. General government debt as a share of GDP is much higher today in most of the region’s economies (figure I.9) following the easier financial conditions after the global financial crisis and increased budget deficits during the pandemic. High government debt limits fiscal space, constraining public investment, and may also hinder private investment by raising interest rates. Private debt has also surged in major economies. Corporate debt as a share of GDP has increased in China and viet nam by more than 40 percentage points since 2010, and now exceeds the levels in advanced economies. High corporate debt may hurt private investment by leaving firms with less resources for new projects. Household debt too is now significantly higher in China, Malaysia and Thailand compared to levels in other emerging markets, and that is squeezing consumption.
Figure I.9. Public and private debt has significantly increased over the last decade
A. Government debt
B. Household debt
C. Nonfinancial corporate debt
Source: Institute of International Finance, World Bank staff estimates.
In 2023, interest payments on external debt increased significantly in most countries in t he region. Highly indebted countries such as l ao PDR have experienced a larger increase in interest payments, especially on private debt on which interest rates are more likely to follow the market rate (figure I.10). In lao PDR, which has been assessed to be in debt distress, interest payments to China (approximately 165 million U s D or 1.1 percent of GDP) were deferred in 2023. While the deferral provides temporary relief, the repayment profile remains uncertain and subject to the conclusion of debt negotiations. The increase in interest payments limits fiscal space and can constrain public and private investment.
Higher nominal interest rates, contained inflation, and lower growth rates are likely to add to public debt to GDP ratio faster than in the past. The result would be an increase in the contribution of interest payments to debt-to-GDP (the interest payment burden is significant in Indonesia,
Figure I.10. Interest payment on external debt has significantly increased in 2023 in most countries Interest payment on long-term external debt as a share of GDP
lao PDR, Papua new Guinea, and Mongolia) and smaller reductions in debt-to-GDP ratios due to growth.
The macroeconomic policy stance has turned contractionary after the expansionary stance in the 2020–2022 period in most economies. As the CovID-19 situation stabilized and governments grappled with increased indebtedness, expenditure on support programs that were implemented during the pandemic declined. This reduction in support is leading to a decline in disposable income for households and firms, which could potentially dampen consumption and investment. The major economies in the region are projected to have a positive or neutral structural balance in the 2023–24 period compared to previous years (figure I.11).
Policy interest rates have been raised both globally and in the EAP region to address the threat of inflation. Policy rates in many EAP countries, however, remained lower than in other emerging market and developing economies (EMDEs), and the rise in policy rates has been milder. This is because the EAP region has generally been less affected by inflationary pressures than other regions. Central banks in the region have also utilized other monetary policy measures such as adjusting reserve requirement rates and conducting open market operations. Due to weak domestic demand and distressed corporate sectors, rates have recently been decreased in China and viet nam (figure I.12).
Inflation had been declining across the EAP region, in response to lower commodity prices, easing supply constraints and decelerating domestic demand (figure I.13). However, inflation has remained stubbornly high across the Pacific Island Countries, as well as in Mongolia, lao PDR and Myanmar, reflecting the raising prices of some commodities like rice, high dependence on imports, and/or rapid depreciation of currencies. Countries such as Thailand, China and Cambodia are now experiencing negative inflation.
Figure I.11. Fiscal policy has become less expansionary in most countries
Change in structural balance
Source: World Economic outlook Database, october 2023, International Monetary Fund.
Figure 12. Monetary policy has tightened in the region, except in China and viet nam Policy rate
Source: Haver Analytics.
While deflationary pressures partly reflect relatively weak domestic demand, there is a risk that they could be transmitted to other economies in the region. For instance, as China continues to play a significant role in global trade and manufacturing, changes in producer costs in China can feed through to price inflation in other EAP countries. Indeed, there seem to be strong co-movements between China’s producer prices and both PPI and CPI inflations in other EAP economies, with an approximately two-quarter lag (figure I.14).
Figure I.13. CPI inflation is declining; some countries face deflationary pressures
A. Various indicators of inflation
B. Latest Consumer Price Inflation and target
Source: Haver Analytics.
Note: A. simple average of China and AsEAn-5 countries. B. latest available year on year change, seasonally adjusted. Target refers to Central Bank target for each country (forecast in Malaysia).
Figure I.14. Co-movements between China’s producer prices and EAP’s producer and consumer prices
A. China’s PPI and EAP’s PPI
B. China’s PPI and EAP’s CPI
Source: Haver Analytics.
Notes: EAP averages of quarterly PPIs and CPIs of Indonesia, Malaysia, Philippines, Thailand, and viet nam.
Monetary policy in the region appears to be balancing the need for monetary policy support and risks of continuing inflation. specifically, policymakers in the EAP region have kept interest rates higher than before the pandemic to tackle inflationary pressures from still-high commodity prices and prevent capital outflows caused by interest rate differentials between advanced economies. When the Us Federal Reserve started to tighten monetary policy, China, Indonesia, and Malaysia experienced capital outflows. Pressures had eased by the end of 2022 in Indonesia and Malaysia, but outflows
continued in China amid weakening investor confidence (figure I.15). By the end of 2023, equity and bond outflows from China amounted to more than one percent of GDP. Currencies depreciated in all major economies but were especially severe in countries at or with a high risk of debt distress such as in lao PDR.
Figure I.15. Major capital outflows from China while currencies are weakening in all economies
A. Portfolio capital flows (cumulative since Feb 2022)
Source: Haver Analytics. Note: B. 7-day moving average.
The economic policy uncertainty index in the region has increased in recent years (figure I.16). Political instability as well as rising geopolitical tensions can also fuel uncertainty. Uncertainty refers to the lack of predictability or clarity about future economic conditions, such as changes in government policies, market conditions, or geopolitical events. High levels of uncertainty have a negative impact on investment growth, as investors choose to “wait and see,” instead of investing in new projects or expanding their existing businesses.
A growth shock originating in the region’s largest trading partners, China and the Us, would impact EAP economies through bilateral trade and financial flows, including foreign
B. Nominal exchange rates (USD/local currency)
Figure I.16. Economic policy uncertainty has increased in recent years in EAP
Uncertainty index
wave & war in Ukraine COVID Alpha wave
China Global Other EAP (rhs)
Source: World Uncertainty Index; Economic Policy Uncertainty Index.
Note: “China” shows Economic Policy Uncertainty index based on south China Morning Post and mainland China newspapers. “other EAP” shows median of Indonesia, Malaysia, Thailand, Philippines and viet nam using World Uncertainty Index’s 4-quarter moving average. “Global” shows global Economy Policy Uncertainty index. 3-quarter moving average.
direct investment (FDI) (as discussed at length in World Bank 2023a). Changes in growth in the Us or China could also impact regional economies by affecting confidence and hence domestic consumption and investment. An unexpected oneoff decline in Us (China’s) GDP growth rate of 1 percentage point would decrease growth rate in the other developing EAP countries, on average, by an estimated 0.5 (0.3) percentage points in the next year (figure I.17). Unanticipated shocks to Us monetary policy also affect growth; a 25 basis points increase lowers growth by an estimated 0.5 percentage points.
Additionally, uncertainty shocks in the Us and China can adversely impact macro and financial conditions in EAP countries. A one standard deviation increase in Us macro uncertainty is associated with a 0.5 percentage point decline in output growth and a 3 percent drop in asset prices in EAP within one year (Figure I.18; Box A1). The effects are comparable to a one standard deviation decline in Us output. Further, while China is itself negatively impacted by the global and Us uncertainty, its own uncertainty shocks are negatively associated with macroeconomic and financial conditions in EAP. A one standard deviation increase in macro uncertainty in China, is associated with 0.3 percentage points decline in industrial production in EAP countries—around half of the responses to the same type of Us uncertainty. similarly, China’s heightened policy uncertainty was followed by stock price declines and heightened uncertainty in EAP countries. These results suggest that China is both a recipient and a source of uncertainty shocks in the global markets, particularly for EAP economies.
High-frequency proxies of domestic demand show a slow revival of consumer spending. Both retail sales and imports are higher than they were before the pandemic (figure I.19). Recent data suggest a bottoming out of consumer spending, even though its pace of growth remains slow. While domestic demand will continue to support economic growth, it continues to be negatively affected by high uncertainty and increased financing costs. Consumer confidence remains low in China and at or below pre-pandemic levels in the rest of the region.
Figure I.17. Growth in the region is influenced by development in the region’s largest trading partners
Impact of 1 pp decrease in China and US GDP growth, and 25 bps increase in US 2-year yield
Source: World Bank staff’s estimations. Notes: Bar show impact of the following shocks: one percentage point decrease in China and Us growth, and 25 bps increase in Us 2-year interest rate yield. Effects estimated using a structural Bayesian vAR model that includes the following variables: Us monetary policy reaction shock, U.s real GDP growth, China real GDP growth, commodity weighted prices for recipient country, recipient country real GDP growth, and recipient country exchange rate to the Us dollar. EAP countries included in the estimation are Indonesia, Malaysia, the Philippines, and Thailand. The models are estimated from 2000Q1 to 2022Q4, except in Malaysia which starts in 2005Q1. The Us monetary policy shock is based on Arteta, Kamin, and Ruch (2022) and captures changes in investors assessments that the Federal Reserve’s reaction function has become more hawkish.
Figure I.18. Macroeconomic uncertainty in the United states and China can negatively impact output in the EAP region’s economies
Impact of 1 std uncertainty shock in US and China to EAP industrial production
Macro uncertainty shock China Macro uncertainty shock
Source: World Bank staff’s estimations.
Notes: Bars show dynamic responses of EAP productions to a one-standard-deviation increase in macroeconomic uncertainty in the U.s. and China. The results are based on a panel vector autoregressions for Indonesia, Malaysia, Philippines and Thailand. The model includes, in this order, the Us production, Us CPI, Us uncertainty, China production, CPI, uncertainty measure, and domestic (EAP) industrial production, prices, stock prices, exchange rates, and uncertainty measures.
Figure I.19. Domestic demand has bottomed out, but the pace of growth remains slow
A. Retail sales (index)
B. Consumer confidence (index)
Source: Haver Analytics.
Note: A. Philippines refers to manufacturing sales. 3-month moving average. B. other East Asia includes Indonesia, Thailand, Philippines and Malaysia (mean). Each index is reindexed to Dec-2019 (100).
Even though retail sales of most countries surpassed the level of pre-pandemic, the growth trend of retail sales is lower than the pre-pandemic rate in most EAP economies (figure I.20). Proximate factors such as the increase in household debt (e.g., in Malaysia, Thailand) and the increased political uncertainty could have weighed on consumer demand. In China, retail sales continue to remain below the pre-pandemic trend due to weak purchase of durable goods and property-related products amid property sector distress while general consumer confidence remains low.
Figure I.20. Trends in private consumption are flatter than in the pre-pandemic period
A. Real retail sales, EAP excl. China
B. Real retail sales, China
Source: Haver Analytics.
Private investment as a share of GDP has been lower than pre-pandemic levels in developing EAP in recent years (figure I.21). Public investment generally supported growth during the pandemic and exceeded the pre-pandemic levels in terms of GDP share in Indonesia, Philippines, and viet nam, but the share was lower in China and Malaysia.
Figure I.21. Private investment as a share of GDP is lower than before the pandemic and so, in some countries, is public investment A. Private investment
B. Public investment
Heightened p olicy uncertainty and increased private and government debt may have hurt investment in EAP countries. Investment growth has been closely associated with export growth in the EAP, as well as increased policy uncertainty and rising levels of corporate and government debts (figure I.22). Policy uncertainty was high in Malaysia and Thailand but has declined recently. Previous studies suggest that even moderate amounts of policy uncertainty can have a large negative impact on investment (Rodrik 1991). More recently, studies employing news-based measured of policy uncertainty have found that economic policy uncertainty is negatively correlated with investment growth (Bloom 2009; Baker et al., 2016). Uncertainty in the EAP region has increased in recent years, potentially hurting investment growth.
In China, a drop in real estate investment explains a significant portion of the investment slowdown. While investment in manufacturing has been robust, driven by rapid investment growth in automobiles and semiconductors, credit reorienting from real estate to manufacturing risks a misallocation of resources and development of excess capacity in certain sectors (Box 3).
Figure I.22. Investment growth is closely associated with export growth, policy uncertainty, corporate and government debts
Correlates of private investment growth in emerging markets and developing economies
After a strong post-COVID rebound in early 2023, growth momentum in China has slowed. Deflationary pressures, falling capacity utilization and a sluggish labor market suggest that aggregate demand is falling short of aggregate supply. Persistent demand weakness poses a downside risk to achieving the government’s stated growth target of 5 percent for 2024.
Infrastructure and real estate investment – major drivers of rapid growth in recent decades –are structurally weak, as high debt levels and diminishing returns to investment constrain further expansion. But the quest to ignite alternative demand drivers is proving difficult. Resilient manufacturing investment has picked up some slack but is running into risks of creating excess supply capacity. Consumption recovered last year, but the rebound was partly driven by a temporary reopening boost and the pace is too slow to offset demand shortfalls arising from lower investment growth. While global growth has been more resilient than expected, external demand is unlikely to deliver a strong enough boost to aggerate demand to lift near-term growth prospects in China, especially since continued geoeconomic fragmentation pressures will make it challenging to rely on external markets.
The ongoing property sector downturn continues to dampen overall investment growth, despite a rotation to manufacturing investment. Amid the protracted but necessary correction in the housing market, real estate investment contracted by 8.1 percent in 2023 (figure B3.1). Infrastructure investment growth also remained well below pre-COVID levels, reflecting local government financing constraints and diminishing returns to infrastructure investments. In contrast, manufacturing investment has been resilient, partly fueled by policy support to priority sectors such as automobiles and semiconductors (figure B3.2). While being resilient, manufacturing investment growth was not sufficient to offset the decline in real estate and weaker infrastructure investment, leaving last year’s overall investment growth at 3.6 percent, almost 2 percentage points below its pre-COVID level. Moreover, manufacturing investment creates risks of developing excess supply capacity, especially given potential market access constraints in global markets.
Growth of consumer spending accelerated (Figure B3.3A) but the pace has been too slow to offset aggregate demand deficiency. Final consumption grew by 8.0 percent in 2023 after a relatively low 2.0 percent in 2022, largely driven by pent up demand for services. With consumption growth above overall GDP growth, rebalancing to consumption-led growth has at least temporarily resumed with China’s consumption share in GDP increasing slightly but remaining exceptionally low (figure B3.3B). However, consumption growth may lose momentum with the fading of the reopening boost to household spending that drove much of the recovery in 2023. Beyond these cyclical effects, consumer spending is held back by China’s high precautionary household savings.
(continued)
(Box 3. continued)
Figure B3.2. Manufacturing investment is partly driven by support to priority sectors
A. Composition of Manufacturing investment
B. Interest rates
Weighted average rate for commerical and industrial loans
Education
Source: Haver Analytics, PBC, Wind.
Note: A. level data are calculated by applying the year-over-year percentage growth rates to the published year-to-date level data. These estimates are indicative, as the statistics office calculates the level of investment based on a sample of enterprises that is not constant over time. B. Implied interest rate is calculated using interest expense/interest-bearing liabilities, and median value for each industry is reported.
Figure B3.3. A (too) gradual rebalancing to consumption-led growth
A. Household consumption, thousand RMB, constant prices
B. Household consumption, percent of GDP
Household consumption 2022–2023 trend Pre-pandemic trend (2015–2019)
Source: WDI, Haver Analytics, nBs Note: B. countries with more than 1.5 million population are shown.
China, 2001–2022 EAP, 2022 AEs, 2022 EMDEs, 2022
(continued)
(Box 3. continued)
External demand is unlikely to deliver a strong enough boost to aggerate demand to lift growth prospects in China. After a surge in goods exports in 2021 and 2022, goods exports contracted by 4.6 percent in 2023. But China has seen a surge in certain manufacturing exports. The share of automobile exports, for example, increased from 4.6 percent of exports in 2015 to 7.1 percent in 2023, with electric vehicles (EVs) accounting for roughly half of all vehicle exports. However, in October 2023 the European Union initiated an anti-subsidy investigation into EU imports of electric vehicles from China, reflecting the broader challenge of relying on external markets to make up for the lack of domestic demand.
To support aggregate demand, the government has announced moderate macroeconomic stimulus. The government’s cautious macroeconomic policy approach suggests that it is attempting to strike a balance between providing near term stimulus and achieving the longer term goal of stable and sustainable growth. The planned wider budget deficit is expected to finance infrastructure spending and support to priority industries. However, local governments are struggling with high debt and depressed land lease revenues. If investment stimulus today would generate significant growth tomorrow, then financing constraints would be less of a concern. But China’s rising capital-output ratio (figure B3.4) suggests that - despite slower investment growth-investment is becoming less effective at generating growth.
More fundamentally, conventional macroeconomic stimulus is ill-suited to address sustained structural imbalances. Instead, structural reforms are needed. Expanding the coverage and benefits of social protection and pension programs, a more progressive tax system and shifting spending from infrastructure toward human capital could reduce precautionary savings and accelerate the rebalancing of aggregate demand towards consumption. The government announced that it would ensure a transparent and predictable policy environment and equal treatment of enterprises regardless of ownership. In principle, a transparent and predictable policy environment and equal treatment of enterprises regardless of ownership would support investor confidence and encourage private investment while allowing market forces to play a greater role in the allocation of capital, mitigating risks of over-capacity. The ultimate impact on private sector confidence and investment will depend on the effective implementation of these announcements.
After falling by more than 20 percent from their peak in the second quarter of 2022 in Indonesia and Malaysia, and by more than 10 percent in China and viet nam, goods exports across EAP countries have been showing sign of recovery during the second half of 2023 (figure I.23). As of Q4-2023, goods exports growth has returned to or has been approaching positive territory in China, Thailand, and viet nam, as global trade recovers.
Figure I.23. Goods exports are beginning to recover but slowly
A. Goods exports (year-on-year growth)
Industrial production (year-on-year growth)
Tariffs and export restrictions, coupled with shifts in the geopolitical landscape, are impacting economies in the EAP region through trade diversion for products that are substitutes or production linkages for intermediate products. For example, Us-China tensions divert trade: away from the Us and towards substitute suppliers like the EU in China’s market; and away from China and towards substitute suppliers like viet nam in the Us market. However, economies sharing global value chain (GvC) production linkages with the Us or China (or both), such as Japan and the Republic of Korea, may experience a contraction in demand for their exports of intermediate inputs to China, because of restrictions on China’s exports in the ultimate destination market, the Us.
While China’s share of Us imports dropped by almost 8 percentage points from 2018 to 2023, with the largest decline in the electronics industry, economies like viet nam, and to a lesser extent, Indonesia, Malaysia and Thailand saw an increase in their share of Us imports, particularly in the electronics sector, suggesting trade diversion from China (figure I.24). Meanwhile, Japan, which has GvC production linkages with both the Us and China, experienced a slight decrease in its share of Us imports.
Concurrently, China reduced its imports from the Us, which declined by about 1 percentage point in electronics and other manufacturing industries, and increased imports from Indonesia, Malaysia, and viet nam. The Us was not the only partner to see a drop in its share of Chinese imports; Japan and the Republic of Korea’s shares also decreased, likely due to their production linkages with China’s exports to the Us. However, the most significant shift in China’s import composition seems to be due to an increase in China’s commodity demand. Economies like Russia, Australia, Malaysia, and the United Arab Emirates (UAE) boosted their commodity exports to China, reflecting China’s post-pandemic pent-up demand and the increase in domestic production of key manufacturing products such as Evs and semiconductors). While China significantly reduced its electronics exports to the Us, it increased electronics exports to the EU.
An ongoing revival of tourism has helped services exports in Malaysia, the Philippines and many Pacific Island countries (figure I.25). The number of tourist arrivals have reached or surpassed pre-pandemic level in Fiji, Malaysia and Cambodia, but seem to have plateaued below pre-pandemic levels in the rest of the EAP economies, partly due to the slow revival of China’s outbound tourism (Box 4). Travel exports have reached pre-pandemic levels in only two countries, Fiji and the Philippines.
Figure I.24. Changes in trade and industrial policies continue to shift patterns of trade
A. Change in shares of US imports, 2018–2023
B. Change in shares of China imports, 2018–2023
C. Change in shares of EU imports, 2018–2023
D. Change in shares of Japan imports, 2018–2023
Figure I.25. Tourist arrivals have plateaued below pre-pandemic levels in several economies
A. Tourist arrivals compared to pre-pandemic
B. Travel exports compared to pre-pandemic
Source: Haver Analytics.
Note: A. Tourist arrivals indexed to the corresponding month in 2019
Box 4. Tourism recovery in the EAP
Hard hit by the pandemic, tourism, a dynamic part of EAP growth, has continued to see a slower-than-expected and uneven recovery for both demand- and supply-side reasons, even as pandemic related travel restriction have been largely removed.
The uneven recovery of tourism in the EAP can be attributed, in part, to the slow revival of tourism from China and Japan. Airline passenger arrivals, a good proxy for tourism trends, show that tourist arrivals from China remain at half their pre-pandemic levels (figure B4.1). Depending on the economy in developing East Asia, passenger arrivals from China can make up between 10 to 40 percent of total travelers. While passenger arrivals from other markets show faster recovery, they still lag pre-pandemic level (Japan, 72%; EU, 80%; and Us, Australia, new Zealand, Republic of Korea and Intra-region travel at around 90%).
1 Background information and updates collated from announcements from www.gov.cn and china-briefing.com.
China’s prolonged pandemic-related travel restrictions hindered the recovery of one of the region’s major tourist source markets. The full reopening of China’s borders in January 2023 marked a turning point, but progress was gradual. In February, outbound group tours resumed to 20 countries, including eight EAP nations (Thailand, Indonesia, Cambodia, Philippines, Malaysia, singapore, lao PDR and Fiji), but excluding Mongolia, Myanmar and viet nam. March saw eased CovID-19 testing requirements, expanded approved destinations for group tours (including Mongolia, viet nam, and vanuatu, Tonga and samoa), and the re-opening of international travel via the shanghai Hongqiao International Airport, one of China’s largest international airports (all international flights had been suspended since March 2020).1 (continued)
passenger arrivals to EAP have largely recovered but have plateaued at below pre-pandemic levels
A. Airline passenger arrivals to developing EAP excluding China, by departure country
B. Airline passenger arrivals composition, by departure country
Elevated travel costs driven by higher airfares and also exchange rate depreciation in some countries may have eroded purchasing power for the region’s travelers, negatively affecting their discretionary spending on tourist activities. For example, in 2023, revenue collection from Cambodia’s Angkor temple (its major tourist attraction) reached only a third of the amounts collected during the same period in 2019 (ly et al., 2023). Major EAP currencies, such as the yuan and the yen, depreciated against the Us dollar, and some anecdotal evidence suggests that could also have affected outbound tourism expenses.
on the supply side, airline seat capacities to EAP destinations have been slow to recover. Challenges like supply chain bottlenecks for new air fleets, skills shortages in the airline industry across critical roles including pilots, maintenance crew, and air traffic controllers, and difficulty to fill pandemic-related layoffs contribute to the constrained capacity.
Additionally, labor shortages extend to the tourism sector, underpinned by the slow return of both local and immigrant workers. Cambodia, Malaysia, and Thailand report staffing gaps, particularly for skilled roles like Chefs and upperlevel managers.3 some laid-off workers have not returned, and training institutes struggle to fill positions in high-end establishments, some of which require years of experience. staff shortages persist in middle-management roles, with former tourism workers finding better prospects in other industries or neighboring markets.4,5
2 https://www.travelvoice.jp/english/jtb-outbound-travel-report-2023-says-that-the-japan-s-outbound-travel-market-in-2022-was-affected-by-weaker-yen-and-rise-inprices-in-destinations
3 “Acute staff shortage hits hospitality sector” https://www.khmertimeskh.com/501294994/acute-staff-shortage-hits-hospitality-sector/
4 ““Hotels face staff shortages” https://www.bangkokpost.com/business/general/2663964
5 “Tourism faces labour shortage fears” https://www.ttrweekly.com/site/2023/04/tourism-faces-labour-shortage-fears/
While the external and domestic factors outlined above impacted the economies of the Pacific Island economies, their recovery in per capita incomes lags the region’s larger economies for several reasons. First, CovID-19 infections reached the PICs at a later stage, leading to further declines in per capita incomes during 2022–23. This compounded the earlier adverse effects of the global recession, which reduced tourism during 2020-21 with devastating effects for tourismdependent economies (Palau, samoa, Tonga, vanuatu). second, given their reliance on imports and distance from other major markets, these economies suffered lasting effects from the increased costs of commodities after Russia’s invasion of Ukraine, which affected directly prices of basic foods as well as transportation costs.
Finally, several Pacific Island economies suffered idiosyncratic shocks. In Tonga, a tsunami erupted in January 2022 devastating much of the tourism infrastructure. Palau’s tourism sector faced significant setbacks as flight operations failed to resume after the pandemic. samoa grappled with a measles epidemic alongside CovID-19 infections. vanuatu encountered economic damages due to a tropical cyclone in october 2023. Tuvalu experienced spending disruptions dues to delays related to procurement of government contracts, while the solomon Islands endured severe economic repercussions from the civil unrest in november 2021. Kiribati’s recovery was hampered by a drought, and Micronesia and Marshall Islands are grappling with a sluggish recovery amidst low growth potential.
The EAP region is projected to grow by 4.5 percent in 2024 (figure I.26; table 1). While domestic factors are likely to be the dominant influence on growth in China, external factors will have a stronger influence on growth in much of the rest of the region. Growth in China is projected to slow to 4.5 percent in 2024, from 5.2 percent in 2023, as the bounce back from the re-opening of the economy fades and both proximate problems, such as elevated debt and weakness in the property sector, and longer-term structural factors, such as aging and decoupling, weigh on growth. The rest of the region, which had suffered in 2023 from slowing global growth and tightening financial conditions, is expected to grow by 4.6 percent in 2024. The likely recovery of global trade and the expected easing of global financial conditions are expected to offset the impact of China slowing down. The growth rate in the Pacific Island countries is expected to be 3.6 percent in 2024, as the post-CovID-19 rebound dissipates (Box 5). Growth in the developing EAP region is nevertheless projected to be higher than that of other EMDEs in 2024 and 2025.
Figure I.26. Growth expected to remain below pre-pandemic
Source: World Bank staff estimates. GDP growth
The baseline projection for the region is subject to several downside risks, including a slowdown in the global economy and tighter-than-expected global financial conditions. In China, further loss of consumer confidence could hold back spending and weigh on growth even as China’s property sector remains vulnerable.
Growth in many EAP countries depends on external demand for their exports. China’s importance as the ultimate destination for domestic value-added in the region has significantly increased since early 2000s, especially for Malaysia, Thailand, viet nam and lao PDR (figure I.27). Mongolia, the solomon Islands, lao PDR, and Myanmar are especially exposed to China as a destination for exports of construction materials, as well as a source of FDI (World Bank 2023). several countries in the region are also exposed through trade linkages to economic activity in the Us and EU (Cambodia, Malaysia, Philippines, Thailand and viet nam). Further growth downgrades in these destination economies would negatively affect demand for EAP exports.
EAP economies are also exposed to external financial conditions. smaller economies such as Timor-leste, Cambodia, and lao PDR are particularly vulnerable through large external financing needs to fill current account deficits and debt servicing and refinancing (figure I.28). While debt service of long-term debt is the major financial need for Mongolia (mainly by mining firms) and lao PDR, refinancing of short-term debt is the major need for Cambodia and Malaysia. Timor-leste and the Pacific Island Countries tend to have large deficits due to their high dependence on imports. Continuing high interest rates in the Us would make it costlier for governments to raise new debt or refinance existing debt. Uncertainty regarding future macroeconomic and financial conditions can increase the risk premia for these vulnerable economies (Box A1).
Table 1. GDP growth forecast
Source: World Bank; World Bank estimates and projections. Note: Percent growth of GDP at market prices. values for 2023 for the small island economies refer to GDP growth estimates. values for Timor-leste represent non-oil GDP. For the following countries, values correspond to the fiscal year: Federal states of Micronesia, Palau, and Republic of the Marshall Islands (october 1–september 30); nauru, samoa, and Tonga (July 1–June 30). Myanmar growth rates refer to the fiscal year from october to september.
Box 5. Economic recovery and outlook in
The Pacific Islands comprise 11 countries, with Fiji being the most populous and economically significant, followed by the solomon Islands. The 9 other economies can be categorized into two main groups. The first group relies heavily on tourism and remittances (Palau, s amoa, Tonga, v anuatu). The second group depends on natural resources, non-tax revenue, and aid (FsM, Kiribati, nauru, RMI, Tuvalu) (Pacific Island Economic Update March 2024). The economies of the former group are vulnerable to global economic shifts and travel conditions, while the latter’s stability is tied to commodity prices, fishing and non-tax revenue, and donor funding. Indeed, tourism and remittances-led countries experienced more severe contractions due to the travel restrictions during the CovID-19 shocks (figure B5.1).
In 2024, the Pacific Island Countries are projected to grow at 3.6 percent, down from an estimated 5.6 percent growth in 2023, but above their pre-pandemic average of 3.0 percent. The slowdown partly reflects the ongoing normalization of activity in Fiji toward its long-term rate. Growth in the solomon Islands is forecast to accelerate due to significant energy and transport infrastructure projects. In the smaller economies, growth is projected to exhibit a modest acceleration from 3.2 percent in 2023 to 3.7 percent in 2024. Tourism and remittance-led countries are projected to grow by four percent, on average, in 2024 (figure B5.2). Palau is expected to record a strong 12.3 percent growth due to a delayed tourism recovery in 2024. vanuatu’s growth is also expected to accelerate as reconstruction efforts continue following the twin cyclones in 2023. Growth in samoa and Tonga is expected to moderate towards long-term averages, following a strong rebound in 2023. In contrast, sovereign rent-led countries are projected to experience relatively modest growth, averaging 2.3 percent in 2024–25 as they converge towards their trend growth.
(continued)
5. continued)
Figure B5.2. GDP growth in Pacific Island countries is anticipated to stabilize
Figure I.27. China’s importance as the destination for domestic value-added has significantly increased
Destination of domestic value-added in gross exports
Source: Trade in value-Added Database.
Figure I.28. smaller economies are vulnerable to external financial conditions
Figure I.29. Geopolitical risk has increased following the Israel-Hamas conflict after october 7, 2023
Geopolitical risk
Sources: Caldara and Iacoviello (2022).
Notes: Geopolitical risk index (GPR) reflects automated text-search of electronic articles from 10 newspapers related to adverse geopolitical events in each newspaper for each month. A higher index is related to lower investment, stock prices, and employment. Daily data. The last observation is February 12, 2024. Red vertical lines show adverse geopolitical events.
Source: International Monetary Fund, Fitch, World Bank. Note: 2023 statistics.
An intensification of geopolitical tensions presents an additional downside risk. A series of events have raised global geopolitical risks in recent months. The Israel-Hamas conflict that broke out on october 7th, in addition to creating a humanitarian crisis in Gaza, comes on top of the protracted Russian invasion of Ukraine. Geopolitical risk surged following the conflict in the Middle East (figure I.29). While rises in commodity prices have been so far limited, an intensification or widening of conflict in the Middle East could disrupt markets for oil and other commodities (Box A2). Furthermore, a series of shipping disruptions, including restrictions in the Panama Canal and continued attacks on ships in the Red sea could hurt trade and increase costs of inputs for markets in developing East Asia (Box 6).
natural disasters, including extreme weather events related to climate change, especially for the small Pacific Island economies, could hurt growth. Historical data show that damage from natural disasters can be substantial for some countries, such as Fiji, samoa, Tonga, and vanuatu. The cost of natural disasters, when they do occur, has been around 60% of GDP in vanuatu and 29% in Tonga, indicating their high toll on livelihoods (World Bank, 2023b; World Bank 2023c). The Pacific atoll nations—Kiribati, RMI, and Tuvalu—also face considerable risk from climate variability and sea-level rise.
In recent months, the Red sea route, a critical conduit for global commerce, has suffered significant disruptions, upending supply chains across the world. In 2023, around 26,000 vessels, and about 22 percent of global containerized trade, crossed the suez Canal. In the same year, the passage also played a critical role in seaborne non-containerized trade. However, the passage of seaborne trade through the Red sea has significantly dropped since the Red sea Crisis starting in late 2023 (november 2023), with liner shipping carrying containerized global trade most affected.
Diversions due to the Red sea route disruption followed and coexist with drought restrictions in the Panama Canal which curtailed transit operations in mid-2023. East Asian cargo bound for Us East and Gulf Coast ports had previously switched from Panama to suez Canal and is now being rerouted on longer voyages around the Cape of Hope.
several global shipping routes, especially those serving international trade of goods to and from Asia, are disproportionally affected by the crisis. By January 2024, many containership operators and carriers suspended vessel transits of the Red sea and Gulf of Aden after several attacks on commercial vessels by Houthi rebels. These vessels are now using a different route going through the Cape of Good Hope, which adds nearly 6,000 nautical miles to a typical voyage from Asia to Europe and up to 3 weeks (10–20 days) in sailing to reach destinations for routes originating in the East Asia region and the China sea (figure B6.1).
Figure B6.1. More ships are avoiding the suez Canal following the rise in Yemen Houthi attacks since December 2023, while traffic in the Panama Canal has decreased due to drought
Sources: Un Comtrade (database); UnCTAD, International Energy Agency; IMF PortWatch; World Bank. Notes: seven-day rolling averages, year-on-year percent change of number of cargoes and ships. last observation is February 6, 2024.
To mitigate the disruption of operational challenges (rerouting and increased sailing times) on specific trade routes, shipping lines are using the following strategies as a way of adhering to delivery schedules: (i) increasing the number of vessels that operate on the affected and/or (ii) higher speeds of sailing.
(continued)
(Box 6. continued)
Focusing on the former approach, in response to prolonged transit times around the Cape of Hope, global ocean carriers were compelled to reallocate global container shipping capacity from other routes to accommodate demand on the Asia – Europe and Asia – Us East Coast trade. This reallocation led to a decrease in capacity for transpacific routes (north America), among others.
since november 2023, average spot container freight rates have experienced a sharp increase (figure B6.2), with a record rise of UsD 500 in the last week of December alone. spot rates for container shipping from shanghai have climbed significantly, showing a growth of over 122 percent since early December. For the Asia-Europe route, which usually transits through the suez Canal, rates have more than tripled in the same timeframe. The Asia-north America East Coast route, which typically uses the suez or Panama canals, has been heavily affected by the Panama Canal restrictions and Red sea incidents, leading to rerouting via the Cape of Good Hope or the use of the Asia – West Coast north America route with additional inland transportation across the Us. This capacity reallocation has resulted in spot freight rate increases that are substantially higher than the average. Furthermore, freight rates for routes that do not pass through the suez or Panama canals, such as the Asia-north America West Coast route, have also seen increases above the average. This is due to the shift in global container shipping capacity allocations to support the increased demand on the AsiaEurope routes, which has led to tighter capacities on other routes and subsequent rises in spot rates.
B6.2. shipping costs from the EAP region to several destinations have increased Spot Freight Rates for Selected Routes from Shanghai (USD/20-foot equivalent unit, TEU)
3-Nov-2310-Nov-2317-Nov-2324-Nov-23 1-Dec-23 8-Dec-2315-Dec-2322-Dec-2329-Dec-23 5-Jan-2412-Jan-2419-Jan-2426-Jan-24 2-Feb-24 9-Feb-24
The impact of Red sea Crisis, in conjunction with the Panama Canal traffic reduction, is expected to affect East Asian global ports, particularly for outgoing traffic and trade volumes.
(continued)
(Box 7. continued)
The diversion of shipping routes from the Panama and suez Canal to the Cape of Good Hope has led to an increase in stress for supply chains, especially in maritime regions such as the China sea and southeast Asia (figure B6.3). The Global supply Chain stress Index, developed by the World Bank, is intended to monitor stress in the global maritime supply chain network. This stress is reflected through two main indicators: the capacity deployed on a particular route (moving capacity) and time-related metrics, which encompass sailing duration, port waiting times, and loading/unloading times.
The EAP region is also likely to see a rise in the cost of imports of agricultural commodities. In 2022, the Us exported 26 percent of soybeans and 17 percent of corn via the Panama Canal to Asian markets. Agricultural exports were being diverted from the Panama Canal to the suez Canal up until the end of 2023, bearing the costs of adding 18 days to the length of voyage (as compared to Panama Canal route). now, bulk carriers are being forced to divert their routes again and pass through the Cape of Good Hope. With 22 days added to the voyage length, this route crosses the equator twice, leading to changes in temperature, possibly affecting the quality of food cargo. Asia also accounts for 21 percent of the EU’s agri-food exports and 16 percent of agri-food imports. Coldiretti estimates that transport costs for fruit exports from Italy to southeast Asia have increased by 6–7 cents/kg (Corriere ortofrutticolo, 2024).
Given the seasonality of demand, which is lower in the first part of the year, and the fixing in advance of shipping contracts, the current impact of these disruptions has been limited. However, a persistence of the disruptions into the second quarter of 2024, when demand seasonally picks up, might have more severe consequences for international trade.
Figure B6.3. Measures of stress in the global maritime supply chain network have increased due to recent disruptions in the suez Canal Global supply
China Sea South East Asia
The CovID-19 shock accelerated an existing upward trajectory in the public-debt-to-GDP ratio observed across the developing EAP economies since the global financial crisis (GFC) of 2008–2009. In the case of developing EAP, excluding China, the public-debt-to-GDP increased from approximately 35 percent in 2008 to around 47 percent in 2019, and surged further to 61 percent in 2022 (figure I.30). Debt increased in all major economies and especially in Fiji, Palau, and Timor-leste. similarly, within China, the public-debt-to-GDP ratio increased from roughly 27 percent in 2008 to about 60 percent in 2019, reaching close to 77 percent in 2022. Projections indicate a slight decrease in public debt for the 2023–2025 period in the EAP region excluding China, where public debt is anticipated to continue its upward trajectory over this period.
Figure I.30. The CovID-19 shock accelerated the upward trend in the public-debt-to-GDP ratio observed in most developing EAP countries since the GFC of 2008–2009
Primary deficits have increasingly contributed to debt accumulation, whereas the reduction in debt-to-GDP ratio stemming from real interest rates being lower than the growth rate of output has been gradually diminishing over time. A debt dynamic decomposition (Box 7) shows that primary deficits are projected to add 1.1 percentage points per year to debtto-GDP during the 2023–2025 period, up from 0.9 percentage points per year during 2010–2019 (figure I.31). In China, the contribution of primary deficits to public debt-to-GDP ratios is expected to rise from 1.6 percentage points per year in the post-GFC period to 5.8 percentage points per year during the 2023–2025 period.6 The historical reduction in the debt-to-GDP ratio, stemming from real interest rates being lower than the growth rate of output (the denominator in the debt ratio), is expected to diminish gradually over time.
6 Primary deficits played a substantial role in influencing public debt-to-GDP ratios during both the GFC and the subsequent CovID-19 global recession (Islamaj
Box 7. Debt accounting
The traditional accounting identity decomposes the changes in the government debt-to-GDP ratio into:7
where d is the debt-to-GDP ratio, r is the real interest rate, g is the real growth rate, π is the inflation rate, and p is the primary deficit (the fiscal deficit excluding interest payments on the government’s debt).8 The first term on the right-hand side reflects the debt service, the second term reflects the erosion of the debt ratio that stems from the growth of output (the denominator in the debt ratio), the third term reflects the debt dilution associated with inflation rates, and the fourth term denotes the direct effect of primary deficits on debt accumulation.
To avoid debt explosion:
where it − πt = rt denotes real interest rate at time t. Equation (2) suggests that when rt gt < 0, then governments can run moderate primary deficits without running the risk of a debt crisis. While this has been the case for most EAP countries due to lower interest rates and high growth during the post-GFC period, rt gt < 0 is subject to reversals when either growth plummets or interest rates spike (World Bank; 2021).
7 see Mauro and Zilinsky (2016) and Blanchard (2021) for an exposition of this issue.
8 The equation also can include the “stock-flow” residual which captures factors such as valuation effects due to changes in the exchange rate, privatizations and sales of other public assets, debt bailouts of entities that are not part of the general government (banks, state-owned enterprises), and central bank deficit financing, such as purchases of government debt (seigniorage). For debt denominated in foreign currency, we estimate the contribution of inflation to debt accumulation net of exchange rate depreciation.
Increased debt creates conditions for faster increases in debt accumulation. Although the difference between real interest rates and economic growth has predominantly been negative across the EAP region, higher debt is correlated with higher interest rates and lower growth rates (figure I.32).9 The larger deficits observed in EAP since the GFC of 2008–2009 have been sustainable due to low real interest rates and high growth rates. However, in the future, higher nominal interest rates, contained inflation, and lower growth rates are likely to add to public debt to GDP ratio faster than in the past. The result would be an increase in the contribution of interest payments to debt-to-GDP (the interest payment burden is significant in Indonesia, lao PDR, Papua new Guinea, and Mongolia) and smaller reductions in debt-to-GDP ratios due to growth.
9
The higher debt combined with increased costs of borrowing have shrunk fiscal space, curtailing the ability of EAP countries to spend money on important programs or respond to unexpected economic events. EAP economies cannot rely on low interest rates, strong GDP growth and inflation to reduce debt-to-GDP burdens. The recent decline in commodity price pressures offers some breathing room for countries to move away from wasteful subsidies and start boosting their fiscal space. Governments can commit to fiscal reform through the enactment of legislation, especially to boost tax revenues. Committing to fiscal discipline through the introduction of fiscal rules could lower borrowing spreads even in the face of future economic shocks (Islamaj, samano, and sommers 2024), and therefore to higher investment (Esquivel and samano 2023).
Inflation across the region has decreased significantly compared to the 2022 highs, but central banks need to be cautious not to ease policy rates too aggressively as real i nterest differentials with advanced economies could increase the risk of capital outflows and currency depreciations. Policy makers can reduce such risks by
Figure I.31. Public debt as a share of GDP is likely to increase due to higher primary deficits, higher interest rates and lower growth
Drivers of debt accumulation
EAP excluding China China
Contribution of primary deficit
Contribution of growth relative to interest rate
Source: World Economic outlook, IMF; World Bank staff estimates.
Note: Using standard debt dynamic accounting decomposition, changes in the ratio of public-debt-to-GDP in any given year can be decomposed into changes in the primary fiscal deficit (defined as revenues minus expenditure net of interest payments), growth rates, interest payments, inflation rates, exchange rate depreciations, and a residual that can be explained by factors such as privatization or the realization of contingent liabilities. EAP excluding China considers Cambodia, Indonesia, lao P.D.R., Malaysia, Mongolia, Papua new Guinea, Philippines, Thailand, and viet nam. Dotted area shows projections for 2023, 2024, and 2025.
Figure I.32. Even though the rates of interest are expected to remain below the rates of growth, increasing debt could push up the former and lower the latter
r – g, average for developing EAP excluding China
B. Public debt, economic growth, and interest rates
signaling their readiness to tighten monetary policy again if there are indications of rising inflationary pressures, such as those stemming from a weakening currency. In a broader sense, monetary authorities can enhance the credibility in their monetary frameworks by engaging in clear, transparent communication and by showing a strong and unambiguous commitment to maintaining price stability, which can help alleviate persistent inflationary pressures (World Bank 2024). Furthermore, policy makers can take steps to preserve or increase their foreign currency reserves by committing to policies that improve investor confidence and draw in foreign investment.
Tighter monetary policies in global markets have led to higher funding costs for corporate borrowers, which can increase their vulnerabilities. While banks appear to be capable of handling financial difficulties faced by both corporations and households, they must remain vigilant to potential threats to their safety and soundness. Credit is growing in most countries in the region, driven by factors such as the removal of pandemic-related restrictions (table 2).
While this is a positive symptom of economic recovery, rapid lending growth and overexposure to the distressed real estate sector, such as in China and viet nam, raise concerns. The phasing out of forbearance measures put in place during the pandemic has revealed vulnerabilities in the financial sectors of viet nam and Cambodia, triggering the re-introduction of measures in viet nam during April 2023. similarly, their continuation in lao PDR and China is likely to lead to an underestimation of the true levels of non-performing loans (nPls). Even in countries that have phased out such measures, a clear plan for dealing with deferred payments and restructured loans is often missing.
Table 2. Financial vulnerabilities in EAP


Source: IMF, WB, Fitch, Haver Analytics.
While capital adequacy is generally sound, pockets of vulnerabilities remain in terms of profitability, solvency, and liquidity across several EAP countries. Banks’ profitability has worsened in China, Cambodia, and Mongolia, while the deposit-toloan ratio has decreased in viet nam and Cambodia, alongside an uptick in non-performing loans. liquidity buffers of banks are generally low in East Asia while China increased buffers likely in response to easing monetary conditions amid weak domestic demand.
In China, while banks reported adequate capital and liquidity, their net interest margins declined as property-related loans to developers slowed down and their nPls have been steadily going up. Furthermore, regional banks in less developed regions are increasingly exposed to the local government financing vehicle (lGFv) debt. Regulators will need to facilitate the restructuring or bankruptcy proceedings of insolvent developers while protecting consumers’ interests and restoring market confidence.
Macroprudential measures can be used preemptively to address risks in banks and nonbanks, including those exposed to highly indebted corporate borrowers and vulnerable real estate sectors. Currency and maturity mismatches between assets and liabilities need to be monitored to cope with increase in liquidity and solvency risks. Highly leveraged nonbank corporations are also vulnerable to rising interest rates. Timely and transparent reporting of nonperforming loans is therefore crucial for effective monitoring of banking sector health.
Given the current high level of exposure to trade and finance, especially with China, EAP countries should intensify their reform efforts to cushion the effects of China’s projected medium to long-term economic deceleration and the worldwide trend towards risk aversion. Given EAP’s deep entrenchment in international supply networks, bolstering both multilateral and regional collaboration, as well as addressing the challenges of economic fragmentation, would be beneficial in preserving the advantages of trade and economic integration. This involves initiatives to reduce non-tariff trade barriers both within and between regions, enhance connectivity, and promote regional cooperation. International agreements with multiple partners can also help. Malaysia is better off having trade agreements with both China and the Us rather than being left out of any agreement or being part of an exclusive trade bloc (EAP Economic Update, April 2023).
Accelerating structural reforms in the financial sector can help deepen countries’ financial sector and improve its efficiency and resilience. some examples include Indonesia’s passage of the Financial sector omnibus law, which focuses on increasing the depth and improving the efficiency of the financial sector, and covers several pillars such as (1) expanding access and broadening financial market products, (2) promoting long-term investment, (3) increasing competition and efficiency, (4) strengthening risk mitigation, and (5) improving consumer and investor protection. The Philippines’ national Financial sector Development Roadmap (FsDR), prepared by the newly formed Financial sector strategy Task Force, demonstrates the government’s commitment to financial sector development. The FsDR complements the country’s recent post-CovID-19 reform efforts, such as the Corporate Recovery and Tax Incentives for Enterprises Act which provides more transparent tax provisions and improves corporate competitiveness, the Financial Institutions strategic Transfer law aiming to ensure solid mechanisms for distressed financial institutions to strengthen their balance sheet, and the amendments to the Anti-Money laundering/Combating the Financing of Terrorism Act aiming to criminalize tax crimes for money laundering.
Additionally, reforms aimed at improving the business climate and regulatory structures are vital to draw more investment, both foreign and domestic. To drive innovation and boost productivity, it is crucial to increase investments in research and development, as well as in the enhancement of education supporting start-ups, and deepening digitalization (see focus chapter).
A. Industrial policies and GDP per capita
B. Trade policies and GDP per capita
Sources: EAP Chief Economist office elaborations on data from nIPo and World Development Indicators. Note: new industrial policies, as defined by the nIPo, include both domestic industrial policies, as well as export promotion schemes and import trade barriers. Here we separate the industrial policy measures (Panels A and C) from the trade policy measures (Panels B and D)
Box A1. Implications of heightened global uncertainty for EAP
Global economic uncertainty rose sharply to a record-high level after the outbreak of the CovID-19 pandemic and stayed elevated by 2023 and early 2024. This box discusses the effect of global and EAP-specific uncertainty on macroeconomic and financial conditions in the EAP. It highlights three types of uncertainty: macroeconomic uncertainty – forecast-based measures; policy uncertainty – news-based measures; and financial uncertainty –stock market volatility-based measures.
Macroeconomic uncertainty is elevated in the Us, reflecting uncertain future output growth and inflation developments (figure A1.1).10 After peaking in April 2020 at the onset of the CovID-19 pandemic, it spiked again in 2022, mainly due to a surge in inflation. Despite the decline since mid-2022, inflation uncertainty is still high in the Us, reflecting disagreements on the speed and degree of the future (dis)inflation process. Global economic policy uncertainty, which aggregates future monetary, fiscal, and financial policies, is twice as high as the pre-pandemic levels. In the U.s., there are still ongoing debates about the path of future monetary policy decisions by the Federal Reserve; the monetary policy uncertainty index has stayed persistently above the long-term averages since 2020. similarly, financial uncertainty (vIX) registered surges in 2020 and 2022 and despite declines remains above pre-pandemic levels.
Figure A1.1. Evolution of uncertainty in the global economy and U.s.
Sources: World Bank estimates, Haver Analytics, Baker, Bloom, and Davis (2016), Jurado et al. (2015).
Notes: A. Macroeconomic uncertainty is based on forecast-based measures by Jurado et al. (2015). The long-term average is 0.9. GDP and inflation uncertainty are based on a standard deviation of Consensus Forecasts for U.s. GDP and CPI inflation. B. Global Economic Policy Uncertainty (EPU) and U.s. Monetary Policy Uncertainty (MPU) index are based on news-based measures by Baker et al. (2016). B.C. Horizontal lines indicate long-term average = 100.
Uncertainty on future output, inflation, financial markets, and economic policies is higher than pre-pandemic in many EAP countries. Macro uncertainty, which suffered from record-high levels in 2020–21 (output uncertainty) or 2022 (inflation uncertainty), has generally declined since 2023 (figure A1.2). That said, uncertainty measures are at levels above pre-pandemic ones, and in some countries (Thailand), output and inflation uncertainty are still increasing trends. news-based economic policy uncertainty continues to stay elevated—particularly in China. survey-based uncertainty indicators on short- and long-term interest rates, which are typically a critical determinant of investment, have increased across all EAP economies (World Bank 2023).
To assess the effects of global uncertainty on EAP, a series of structural vector autoregressive (svAR) models are estimated over 2000–2019 for 5 EAP countries: China, Indonesia, Malaysia, Thailand, and the Philippines. The models consist of a set of macro and financial variables in the Us (or global), China, and individual EAP countries.11 Three sources of uncertainty were distinguished: macro, financial, and policy.
The findings suggest that global uncertainty shocks have negatively affected macro and financial conditions in EAP countries.12 Following a one standard deviation increase in U.s. macro uncertainty, growth of output and asset prices in EAP declined by 0.5 and 3 percent, respectively, within one year after the shock (figure A1.3). The effects are comparable to the effects from a one standard deviation decline in U.s. output (by 0.3 and 1 percent). Global financial market and economic policy uncertainty also had significant impacts on key domestic financial variables, although their impacts are overall more immediate but short-lived compared with macro uncertainty. Following a one standard deviation vIX shock, average stock prices in EAP declined by 1.2 percent, which is comparable to the effects of a negative shock on U.s. equity prices ( 1.6 percent). The effects of policy uncertainty shocks appear to put another layer of negative effects on EAP countries. While U.s. monetary tightening led to a decline in EAP stock prices by up to 1.4 percent, heightened U.s. monetary policy uncertainty additionally resulted in a 0.7 percent decline in stock prices.
11 China, the largest EMDE, is taken separately in the model to reflect the role as a source and a recipient of global uncertainty shocks.
12 This is statistically and economically significant based on average results (i.e., based on the panel model) as well as in country-specific perspectives—the results hold for all EAP countries in the sample.
(continued)
A. Macroeconomic uncertainty
B. Financial and policy uncertainty
Source: World Bank estimates, Consensus Economics, Baker, Bloom, and Davis (2016).
Notes: A. EAP macroeconomic uncertainty is based on the average cross-sectional standard deviation of Consensus Forecast surveys for 4 countries (CHn, IDn, MYs, and THA).
B. China policy uncertainty is based on news-based measures by Baker et al. (2016). EAP financial uncertainty is based on the average standard deviation of Consensus Forecasts for 3-month TB yields and 10-year bond yields in 4 countries (CHn, IDn, MYs, and THA).
A. EAP output responses to negative U.S. output and macro uncertainty shocks
B. EAP stock price responses to negative U.S. stock price and financial uncertainty shocks
C. EAP stock price responses to U.S. monetary policy tightening and monetary policy uncertainty shocks
Sources: World Bank estimates, Jarocinksy and Karadi (2020). Notes: The results are based on panel vector autoregressions estimated with a sample for 2000m1–2019m12 for U.s. and four EMDEs in EAP (MYs, IDn, PHl, THA). The model includes, in this order, the Us production, Us CPI, Us uncertainty, domestic (EAP) industrial production, prices, stock prices, exchange rates, and uncertainty measures. A. shows dynamic responses of EAP industrial production to a one-standard-deviation increase in macroeconomic uncertainty and decline in output. Bars indicate the median responses, and vertical lines indicate 16–84 percent confidence intervals. B. shows dynamic responses of EAP equity prices to a one-standard-deviation increase in financial uncertainty (vIX) and decline in U.s. equity prices. C. shows dynamic responses of EAP stock prices to U.s. monetary policy tightening shock and U.s. monetary policy uncertainty shock.
(Box A1. continued)
The sizeable uncertainty effects reflect various channels of international transmission of uncertainty shocks. First of all, the dynamic responses of the macro variables are consistent with theories on the economic effects of uncertainty— typically on the “wait-and-see” channel that strains private investment and consumption (Binder 2017; Bloom 2009). In particular, high levels of macro uncertainty have a negative impact on investment growth, as investors become hesitant to invest in new projects or expand their existing businesses (leduc and liu 2016). second, the reactions of financial asset prices and increases in credit costs also contribute to the contractionary effects of economic uncertainty. Third, following the heightened global and U.s. uncertainty, the uncertainty indicators in individual EAP countries also responded significantly, which supports the narratives of internationally correlated risk and uncertainty (londono et al. 2021). The heightened uncertainty in the domestic economy is estimated to have played a negative role in economic confidence/sentiments in EAP countries (Ha and so 2023).
Estimation results also suggest that while China was negatively affected by the global and Us uncertainty shocks, its own uncertainty shocks had an impact on the macroeconomic and financial conditions in EAP (Figure A1.4).
Following one standard deviation increase in macro uncertainty in China, industrial production in EAP countries declined by around 0.3 percent—around half of the responses to the same type of Us uncertainty. Again, China’s heightened policy uncertainty was followed by stock price declines and heightened uncertainty in EAP countries. These results collectively suggest that China is both a source and recipient of uncertainty shocks in the global markets, particularly for EAP countries.
China output and stock price responses to heightened macro uncertainty in the U.S.
(continued)
(Box A1. continued)
The findings lead to at least two types of novel implications. First, the effects of uncertainty—which is mainly related to the volatility or second moment of the variables—are distinctive to the effects of the level (first moment) fluctuations in business, financial, and policy variables. The economic consequence of the uncertainty shocks is quite sizeable, almost comparable to the effects of the “level” shocks. These findings are quite robust across different types of uncertainty measures—across macro, financial, and policy uncertainties. second, the results suggest that different types of uncertainty shocks cause somewhat heterogeneous effects on EAP countries. In terms of cumulative effect, macro uncertainty, followed by financial and economic policy uncertainty, has the most significant contribution to the variations in the key domestic variables in EAP. In particular, macro uncertainty, which explains up to 40 percent of total variations in Us output and prices, can explain up to a quarter of variations in macro variables in EAP. This result is in line with the findings of stock and Watson (2012), who argue that global uncertainty shock was a key driver of global recessions and other severe fluctuations.
Futures Markets suggest that Brent crude oil prices already incorporated up to 5 dollars of geopolitical risk premium to oil prices when the Middle East conflict broke out in october. This happened even though neither Israel nor Gaza are energy exporters. Brent spot prices reached Us$83/bbl by mid-February, lower than the october 19 futures curve but higher than the level before the conflict in the Middle East in early october (figure A2.1). The movement of the Brent crude oil futures curve has been influenced by several events unfolding in recent months related to the conflict and geopolitical tensions in the Red sea, including concerns about global supply in early February. The latest futures curve suggests the market is now pricing Brent at Us$80.57/bbl for 2024, in line with the latest World Bank forecast of $81/bbl (World Bank, 2024).
Oil scenarios: a broader conflict in the Middle East
Figure A2.1. The geopolitical risk has translated into a small premium on Brent crude oil prices
Brent future prices
US$/bbl
October 5, 2023 October 19, 2023 February 15, 2024
Sources: Bloomberg, International Energy Agency, and World Bank.
Note: Brent crude oil futures data, latest observation is February 15, 2024.
Two scenarios are considered to assess the implications on oil prices of an escalation of the conflict in the Middle East: a moderate scenario and an extreme scenario. Each scenario reflects the severity of the impact of these events on oil supply, constructed based on previous geopolitically driven supply disruptions and associated with a corresponding range for the initial impact on prices. The assessments of the initial price impact are based
(continued)
(Box A2. continued) on the elasticities estimated from the empirical relationship between supply disruptions and price changes in earlier episodes (World Bank, 2023).13 The results are as follows:
• Measured or moderated disruption scenario. This scenario assumes that global oil supply is reduced by 0.5 mb/d to 2 mb/d (0.5 and 2 percent of 2023 supply), depending on geopolitical developments (figure A2.2). This decline is comparable to the supply change observed during the libyan civil war in 2011, and the first Iran oil embargo (nearly 2 percent decline in global supply at the time). Under this scenario, oil prices would initially increase by 3 to 13 percent ($2.40/bbl to $10/bbl) above the last price observation of $80/bbl.
• Extreme or escalated disruption scenario. Depending on how much the conflict escalates, the medium disruption scenario assumes a 3 to 5 mb/d reduces global oil supply. This reduction would be comparable with the loss of 3 percent of global oil supply during the Iraq war invasion in 2003 but somewhat below the loss expected following the attacks on saudi oil installations of 6 percent in september 2019. Under this scenario, oil prices would initially increase by about 21 to 35 percent ($17/bbl to $28/bbl) above the last price observation of $80/bbl.
Figure A2.2. Depending on the duration and scale of any escalation, prices could rise but remain below $90/bbl; under a more extreme scenario, prices would hover around Us$100
The probability that oil price spikes resulting from the extreme scenario are sustained is low. More recent supply disruptions associated with conflicts in the region have triggered short-lived spikes (Yang et al., 2022). Although the conflict in the Middle East has been historically associated with higher oil prices, notable changes in the overall conditions of energy markets and improvements in the global economy’s resilience to energy price shocks imply that the overall impact is likely smaller and more short-lived than in past decades.14 The availability of supply from other sources is likely to mitigate the impact of future disruptions.
13 In the extreme disruption scenario, the impact on the price was obtained by using the supply shock impulse response functions (IRF) reported by Caldara, Cavallo, and Iacoviello (2019). In the moderate scenario, the estimates were informed by the within-month price impact observed in a few historical episodes. For a broader discussion of the impact of supply shocks on oil prices, see Baumeister and Peersman (2013) and Boer, Pescatori, and stuermer (2023). This simple calculation aims to provide a sense of the range of possible initial changes in oil supply, allowing for a wide range of possible outcomes that reflect uncertainty about the underlying source of disruption, the extent to which supply would fall in the affected countries, and the extent to which other oil producers would quickly step in to fill the drop in supply.
14 specifically, over the last decade: (i) energy supply is more diversified geographically and comes from many sources, including green energy; (ii) the development of futures contracts has led to improved price discovery and market efficiency; (iii) governments together hold very large strategic reserves. see World Bank (2023) for more details.
In recent decades, EAP economic growth surpassed that in most other emerging market and developing economies in recent years, it was driven primarily by capital accumulation rather than productivity growth (figure II.1). EAP benefited from rapid growth during the 2000s - raising wages and lifting millions out of poverty. However, the sustainability of growth depends upon its source. overall growth in labor productivity can be attributed to increases in capital per worker (so-called capital deepening), increases in human capital (such as skills) and increases in “productivity” (total factor productivity, TFP). Developing countries can experience catch-up growth by investing more in physical capital, such as buildings, machines, and equipment, as well as in human capital, through more and better education and training. But capital investment ultimately exhibits decreasing returns – though their onset is probably much further away in the case of human capital. But in the longrun, productivity (TFP) – the efficiency with which inputs are transformed into outputs - is the key driver of growth.
Labor productivity decomposition
Empirical evidence suggests that regional labor productivity growth has been driven predominantly by capital accumulation rather than TFP growth. The contribution of human capital accumulation to labor productivity growth has also been relatively low (though recent work suggest that the contribution of human capital accumulation to labor productivity growth in developing economies may be underestimated because existing growth accounting decompositions do not properly account for learning outcomes) (Box II.B1). While measurement of TFP and human capital are challenging, overall, the results suggest that enhancing human capital is a more important driver of productivity as countries develop. This and other aspects of the productivity agenda must be a policy priority - future living standards depend on it.
Box II.B1. A new measure of the contribution of human capital accumulation to labor productivity
The analysis that decomposes the sources of labor productivity relies on measures of human capital that account for average years of schooling, skills and compensation of the working-age population.15 While the existing measures have the advantage of wide availability across countries, they fail to account for the quality of labor input. The latter is influenced not just by the level of education, but also by the actual learning and skills acquired as well as the workforce health. The quality of formal education and health, and the effects of on-the-job training and learning outside of the education system are difficult to measure consistently.
15 Human capital estimates for a wide selection of EAP countries are available from the Asian Productivity outlook, The Conference Board, and Penn World Tables databases.
(continued)
(Box II.B.1. continued)
In a recent analysis, Angrist et al (2021), used a globally comparable database of learning outcomes (164 countries from 2000 to 2017) to estimate the role of human capital in explaining income differences across countries, adjusting years of schooling with a direct measure of education quality. They find that this contribution ranges from a fifth to up to one-half, with considerable heterogeneity across income groupings. Figure II.B1.1 illustrates the results and highlights the increasingly important role of human capital in driving productivity as countries move up in economic development. This underscores the need for EAP countries to ensure strong foundational skills for current cohorts of students, which will also enable them to acquire more sophisticated skills relevant to the new services economy.
Share of cross-country labor productivity differences explained by Human Capital
Contribution
Source: Angrist, n., Djankov, s., Goldberg, P.K. et al. Measuring human capital using global learning data. nature
403–408 (2021). https://doi.org/10.1038/s41586-021-03323-7
Note: Productivity is defined as real output per worker in U.s. dollars (at 2010 prices) from Penn World Tables v.9.0. The productivity accounting decomposition is based on var(log[H])/var(log[Y]), where H is a measure of human capital constructed using both average years of schooling of the population and learning outcomes, as well as standard estimates of capital and returns to capital and human capital. The global sample of the study covers 164 countries from 2000 to 2017, including the majority of East Asia and Pacific (EAP) countries.
The special focus of this Update examines the challenge of productivity growth through novel firm level analysis; the factors behind its slowdown; and what policies could reignite TFP growth.
Economies in East Asia and the Pacific have experienced a productivity slowdown since the Global Financial Crisis, as has most of the rest of the world. Although global productivity growth has slowed, the slowdown has been more acute in developing East Asia and has occurred even in previously rapidly growing economies like China (figure II.2). In fact, productivity growth has been slower in developing East Asia than in the developed countries of the region and the Us, suggesting that convergence to high income country-levels has slowed down. Furthermore, the slowdown in total factor productivity has led to a deceleration in labor productivity and wage growth, offsetting the impact of capital deepening. But what explains the productivity slowdown? And what can be done to revive productivity growth?
Figure II.B1.1Aggregate productivity growth is a dynamic process involving productivity growth within firms, and entry and exit (figure II.2). Aggregate productivity, measured as total factor productivity (TFP), is the sum of each underlying firm’s TFP weighted by the firm’s size (value-added).16 Aggregate productivity increases if existing firms become more productive (“withinfirm” component of Figure II.3), for instance through using new technologies or improvements in management. Aggregate productivity also increases if more productive firms scale up or less productive firms shrink, reflecting the reallocation of market share towards more productive firms (“reallocation” component).17 The dynamic process of entry and exit can also raise productivity through the entry of more productive firms and the exit of less productive ones (the “entry” and “exit” components). We first decompose aggregate productivity growth into these components. We then take a closer look at the within-firm component, contrasting the growth of frontier and laggard firms.18 Correctly diagnosing the sources of the productivity slowdown matters for prescribing the right policies.
Entry of more productive firms
less
Source: Authors elaboration.
Note: Frontier firms refer to the most productive firms within a country and industry.
Reallocation of resources from less to more productive firms
Catch-up growth within nonfrontier
16 specifically, we compute these decompositions within each 2-digit industry, using firm TFP and firm size (value-added), and aggregate industries 2-digit using industry value-added shares in the economy.
17 note that there may be interdependence between these sources of aggregate growth. For instance, greater scope for reallocation through flexible product and factor markets can incentivize firms to make sunk investments, which can raise both within-firm productivity and the scale of productive firms. Furthermore, the threat of competition from firm entry can incentivize within-firm innovations to stay ahead of the competition. We return to these points in subsequent sections.
18 Frontier and laggards are defined as those with the highest and lowest productivity levels respectively, which we consider in the next section.
Figure II.2. Aggregate productivity growth has slowed in developing East Asia Source: Conference Board, total economy database.Figure II.4. Productivity growth in EAP has been driven primarily by increases in productivity within firms
USA - Manufacturing (1997–2013)
CHN - Manufacturing (2007–2013)
MYS - Manufacturing (2000–2015)
PHL - Services (2012–2018)
VNM - Manufacturing (2011–2021)
CHN - Manufacturing (1998–2007)
IDN - Manufacturing (1996–2015)
PHL - Manufacturing (2012–2018)
VNM - Manufacturing (2001–2011)
VNM - Services (2011–2021)
Source: Indonesia, Malaysia, Philippines and viet nam reflects authors’ calculations using statistical office micro-data, China is taken from Brandt et al. (2020a), UsA is taken from Pancost and Yeh (2022).
Notes: Decompositions calculated at the 2-digit level and aggregated using value-added weights. Chart reflects the average of 5 or 6 yearly productivity changes, over the periods mentioned in the legend (5 or 6 years depends upon country data availability). Entry reflects only entry of young firms, entry into the survey due to sampling changes have been excluded.
In the EAP region, aggregate TFP growth appears to be mostly due to productivity improvements within existing firms. For EAP countries on average around three-quarters of aggregate productivity is due to within-firm growth and for every country it reflects at least 45 per cent of the aggregate (figure II.4).19 The portion attributable to firm exit and reallocation is small (Box II.B2), which may suggest that resources are trapped in less productive firms that should exit and so more productive firms struggle to scale up and increase their market share. However, there is a more substantial contribution from firm entry, in the early 2000s in China and in services.20
since most productivity growth was due to within firm growth, the slowdown in aggregate productivity is also likely to be due primarily to a slowdown in within-firm growth. Evidence for Thailand manufacturing, using a different productivity decomposition, similarly finds the bulk of the productivity slowdown between 2006 and 2011 is due to stagnation withinfirms, with reallocation and entry or exit contributing negligibly (Paweenawat et al., 2017; World Bank, 2020). one concern might be that measuring TFP requires information on capital, which is not always widely available.21 To address this we also compute the decomposition of labor productivity, and similarly find the within-firm component contributes at least half the total change for every EAP country (and on average more than 80 per cent).
Growth through new firms entering may also be important during reform periods, even though most productivity growth occurs within-firms. During China’s WTo accession, almost half of aggregate growth was due to new firms, although within-firm
19 The dominant role of within-firm growth is despite examining changes over 5-year periods or more, which by construction will give a larger weight to entry and exit than annual changes, since entrants will encompass any firm up to 5 years old.
20 note we have decomposed the entry component into entry of new young firms and entry into the sample of older firms (the latter likely reflecting sampling changes), and we reflect only the former in the figure.
21 For most countries in our sample, data on capital is available for three quarters or more firms, however, for viet nam it is closer to one-third. nonetheless we see similar decompositions for viet nam using labor productivity or TFP.
Reallocation to more productive firms is low in EAP, but is difficult to measure due to data limitations. Accurately measuring reallocation requires data for the full firm distribution, which is typically not available in EAP countries (apart from the Philippines and viet nam in certain years). Based on the methodology proposed by Decker et al. (2020), it is possible to measure reallocation by assessing whether more productive firms increase employment. For China, Indonesia, Malaysia, the Philippines and viet nam more productive firms do increase employment more than less productive firms – a sign of productive reallocation (figure II.B2.1). But the responsiveness of employment to productivity appears to be low compared to benchmarks in more flexible markets like the Us and also, it is not increasing over time. This suggests that the most productive firms struggle to scale up employment.
II.B2.1. Reallocation of employment towards more productive firms is low relative to the Us
Notes: Figure shows the percentage point increase in one-year employment growth correlated with a one standard deviation higher (one-year lagged) TFP – for manufacturing firms. Reflects 2013 or last available year, if earlier.
growth still accounted for the bulk of growth (reallocation within existing firms and exit contributed negligibly).22 In other countries too, within-firm growth remains important even during reform periods, although reallocation especially through firm entry can play a significant role. Bartelsman et al. (2004) examine 25 developed and emerging economies over the 1980s and 1990s (many experiencing reforms during their period) and find that within-firm contribution dominates, while firm entry can explain 20–50 percent of aggregate productivity growth. studies of India’s reforms in the 1990s find that most productivity growth occurred within plants, rather than through reallocation or entry and exit (Bollard et al., 2013; Harrison et al., 2011; sivadasan, 2009).
The importance of within-productivity growth, which dominates firm dynamics in EAP, is common also in other regions. studies in other regions using TFP are not widely available and often rely on labor productivity. Using manufacturing firm data for Brazil, Bazzi et al (2014) find that the within-firm component explains most of the growth in labor productivity between 1987 and 2009. similarly, the within-firm component dominates the other components (entry, exit or reallocation) of labor productivity growth for the manufacturing sectors in Chile, Colombia, Mexico and Peru between 1995 and 2012 (Brown et al., 2018). World Bank (forthcoming) finds that the labor productivity growth in middle-income European countries is roughly evenly split between reallocation and within-firm contributions, which the authors suggest may mean European firms are struggling to invest in productivity (adopt technologies, management practices).23 This is a theme to which we return to in the next section.
Why the productivity slowdown has come at a time of rapid technological progress is a puzzle. Many new technologies such as automation, broadband internet, and e-commerce are diffusing rapidly (figure II.5). Adoption of new technologies does matter for productivity, with evidence from the Philippines showing this is particularly the case for services sector
22 note we reflect here only entry of new young firms and exclude entry into the sample of older firms (the latter likely reflecting sampling changes). Including the latter for China would reflect increase the contribution of entrants to around 60 per cent and reduce the contribution within-firms to about 40 per cent.
23 note these results are using a Melitz-Polanec (2015) productivity decomposition, which differs from the Foster et al. (2001) decomposition we use, in that it can assign greater weight to reallocation than within-firm growth.
Figure II.5. new technologies have diffused rapidly in the EAP region
A. Robot diffusion
Sources: Authors’ calculations using IFR and WDI (panel a), authors’ calculations using ITU data (panel b).
Notes: Fast broadband defined as > 10MBps connections.
firms (figure II.6). In the case of the use of data analytics, for instance, productivity increases are three times higher in services than in manufacturing. In the next section, we explore how technology adoption and productivity improvements are intertwined, to shed light on the puzzling conjunction of rapid technological progress and the productivity slowdown.
The productivity slowdown has been global – but in advanced economies frontier firms continue to grow rapidly, it is the rest that are struggling to catch up. This section closer look at the within-firm component, contrasting the growth of frontier and laggard firms in EAP. Frontier firms refer to those most productive within a country and industry, see box A.1.
B. Fast broadband diffusion
new technologies matter for within-firm productivity growth
Within-firm changes in TFP from increases in IT Capital or Data and Software Capital per Worker
Source: Authors’ calculations using Philippine AsPBI and CPBI statistical office micro-data.
Notes: Measures a one standard-deviation increase in IT Capital or Data and software Capital per worker. Within-firm estimates from regressions controlling for firm and year fixed effects.
Frontier firms matter for aggregate productivity because of their dynamic role in productivity diffusion. new technologies and business models are typically first adopted by the most productive firms. These technologies then tend to diffuse gradually through supply chains and customer networks, as well as providing the spur for competitors to imitate (Box II.B3).
Frontier firms in EAP also matter for aggregate productivity because of their size. Frontier firms account for an outsized share of new job creation, investment, production, and exports. More productive firms are larger in EAP manufacturing and to a lesser extent in services, so the performance of frontier firms disproportionately matters for aggregate outcomes. The 10% most productive firms within each industry account for more than a quarter of employment or new job creation in each of the EAP countries for which we have firm-level data. The frontier also disproportionately creates high quality
Box II.B3. Frontier Firms and Technology Diffusion in Viet Nam
Halimex, a vietnamese state-run brewery, was established in 1966 but continued until the 2000s to produce most of its products by labor-intensive processes that were perceived as far below international standards. In 2003, Carlsberg (a Danish multinational) acquired a 25% stake and provided modern equipment and machinery to set up a new plant, as well the transfer of critical knowhow in production and marketing know-how. The technology level of the new Danbrew plant was much higher than the technology used in the old breweries at that time. Halimex and its canned beer, Halida, quickly became a success. With the new know-how, technology and experience acquired through the investment of Carlsberg, Halimex established an offshoot brewery (viet Ha) which adopted many of the technologies and practices at its parent company.
The entry of Honda into the viet nam motorcycle industry in 1996, had a dramatic impact on the motorcycle industry itself as well as on the network of suppliers. Honda built advanced factories comprising precision robots, computercontrolled machines, highly automated assembly lines, state-of-the-art paint shops and quality-control workshops. sophisticated production technologies were combined with skills training, not only in working with the machines, but also broader managerial and marketing skills. Honda also developed a network of suppliers in viet nam – not only other foreign-owned firms, but also domestic suppliers. Honda quality standards were passed down to suppliers, along with technical support and management skills training – creating both the incentive and capacity for upgrading of domestic supply chains.
Source: Estrin and Meyer (2004)
Box II.B4. Who are the frontier firms?
The most productive firms globally come from a range of oECD countries. The oECD defines frontier firms as the most productive 5% of firms in each industry globally, although similar findings are found using the top 100 firms (Andrews et al., 2016, Criscuolo, 2023). According to orbis data for oECD economies, for example, Finland and Republic of Korea have firms at the global frontier in most ICT sectors, and Italy is well represented at the global frontier in the textiles industry (Andrews et al., 2016). Eleven oECD countries have at least one global frontier firm in three quarter or more 2-digit industries, but richer countries tend to have more global frontier firms. Global frontier firms are larger, more capital intensive, have lower labor shares (wages as a share of value-added), are more likely to be foreign owned and are more likely to patent than other medium or large firms in advanced economies (Andrews et al., 2016).
EAP national frontier firms are smaller than their global counterparts. The national frontier in developing East Asia, defined as the most productive 10% of firms in each industry and country, also have distinct characteristics compared to the rest of the firms in their economies. The national frontier firms are larger, more capital intensive, more IT capital intensive, have higher data capital per worker, have lower labor shares, are more likely to be foreign owned and also more likely to export. However, even at the national frontier in manufacturing sectors, fewer than a third of firms are foreign owned and about half the firms do not export. Furthermore, the national frontier firm in EAP is many orders smaller than the global frontier firms – approximately 10 times smaller in terms of employment or sales. More generally, evidence suggests there are too few large firms in developing economies compared to advanced countries (Ciani et al, 2020).
jobs, since frontier firms pay higher wages – on average nearly 50 per cent higher than the wages at non-frontier medium or large firms. While important for jobs, frontier firms also account for nearly 40 per cent of capital investment, almost half of total exports and more than half of industry value-added.
Ì a) Productivity of the global frontier is rapidly growing, especially in digital sectors
In the 1990s, new technologies were being adopted early by frontier firms in EAP countries but diffusing more slowly to other firms than had been the case in the past (Cirera et al., 2021). The lag between when a technology was first invented and when it arrived first in countries had been declining, indicating at least some firms had been enjoying faster access to new technologies. These trends were evident at least using data on technologies invented until the 1990s – we later discuss the current wave of data analytics technologies. For developing East Asia, these adoption lags had also been converging to oECD country levels, suggesting technologies had been rapidly reaching the best firms in East Asia.
The pattern of frontier firms rapidly adopting technologies is consistent with the experience of advanced economies today. In advanced economies, while the productivity growth has stagnated for the majority of firms, the most productive (the global frontier) have continued to experience rapid productivity growth since the 2000s (figure II.7A). A growing literature attributes the productivity divergence between firms within advanced countries to the fact that new sunk-cost technologies, such as data technologies or management skills, favor superstar firms (Autor et al., 2020; Corrado et al., 2021). Accordingly, the growth of the global frontier is particularly rapid in digital-intensive sectors (figure II.7B), with the classification of digital intensity explained in Box II.B5. This effect is potentially amplified by globalization (Andrews et al., 2016). The challenge in advanced economies is why these modern technologies that matter for growth are not diffusing faster beyond the best firms.
Ì b) The frontier firms in EAP are falling behind in productivity, especially in digital sectors
since the 2000s, the national frontier firms in EAP are no longer pushing the frontier forward and are falling behind the best firms globally. Figures II.8A and II.8B show changes in the productivity distribution over time, as repeated cross-sections,
Figure II.7. In advanced economies, frontier firms are growing at a faster pace than other firms, especially in digital sectors A. All sectors B. Digital-intensive sectorsWe classify digital-intensive sectors according to the technological intensity index of Eurostat, which classifies manufacturing sectors into ‘high-technology’, ‘medium high-technology’, ‘medium low-technology’ and ‘lowtechnology’ groups, with services classified into ‘knowledge-intensive services’ and ‘less knowledge-intensive services’. In this chapter we refer to digital intensive sectors, which corresponds to ‘high-technology manufacturing’ and ‘knowledge-intensive services’ according to Eurostat. These digital intensive sectors are pharmaceuticals manufacturing, computer and electronics manufacturing, publishing and broadcasting, telecommunications, computer programming, IT services and scientific research and development (respectively divisions 21, 26, 59–63 and 72 of IsIC rev.4).
Measuring digital intensity is not straight forward and can depend upon whether one measures digital skills, use of digital capital like IT or robots or use of digital services like cloud computing. However, we find similar results using an oECD classification of Calvino et al., (2018), which reflects a composite of these differing components of digital.
These Eurostat sector measures are based on European economies, which we take as a relatively undistorted benchmark. The sector ranking also appears to be a meaningful predictor of digital intensity of sectors in developing EAP. For the Philippines, where detailed sectoral data on technology use is available, we find that the 2-digit industries with a higher number of computers per worker (a common proxy of aggregate IT capital) also tend to have higher technological intensity ranking according to Eurostat (with a correlation of 0.6 in both manufacturing and services).
to allow for changes in the composition of firms over time. In contrast to what is occurring in advanced economies, the productivity of the most productive firms (i.e., national frontier) in China, Indonesia, Malaysia, Philippines and viet nam has increased by less than the rest of the firms in the respective country.24 There are some differences in the timing of the convergence across countries (e.g. being more salient in recent years in the Philippines and in viet nam in the 2000s). These findings are true in both manufacturing and services. similar results are also obtained using labor productivity, rather than TFP, or focusing on just medium and large firms, rather than the entire firm distribution. Tentative evidence for labor productivity using the World Bank Enterprise surveys also suggests the stagnation of the national frontier may be occurring in developing countries beyond EAP, though to a lesser extent.
The national frontier is falling further behind the global frontier in digital-intensive sectors (figure II.9). The slowdown in growth for the national frontier is starker in digital-intensive sectors – the same sectors where in rich countries the best firms are pulling away (figure II.9A). For example, in digital manufacturing sectors, between 2005 and 2015 the productivity of the global frontier increased by 76 percent, whereas the national frontier firms in Indonesia, Malaysia, the Philippines and viet nam increased their productivity by only 31 percent on average. For less digital sectors we do not see as substantial changes in the growth of the national frontier relative to either laggards or the global frontier (figure II.9B). overall evidence on the trends in the national frontier (vs the global frontier) beyond EAP is limited. Evidence for Colombia and Mexico does not find any discernable change between the national and global frontier in manufacturing between 2003 and 2011 (Araujo et al., 2016).
The sluggishness of the national frontier firms raises concerns about the future growth of all firms. on the face of it, the convergence within national economies is good news – as the average firm catches up with the national frontier. Despite this catch-up, convergence gaps between the most and least productive firms remain large even in the final period for which we have data. The frontier firms (the most productive 10 per cent) being on average around 10 times more productive than laggards in the same industry (the bottom 10 per cent).
24 It is important to contrast these statistics presented on cross-sections of the productivity distribution with so-called firm-level convergence regressions, see box 2.
Figure II.8A. …but in the EAP region, productivity growth of frontier manufacturing firms has been slower than that of other firms…
National frontier firms (10% most productive) Average firm (Median)
Laggard firms (10% least productive)
Source: Authors’ calculations using statistical office micro-data.
Notes: Reflects cross-sectional percentiles of the firm productivity distribution within country-industries over time, P90 reflects the 90th percentile of the firm productivity distribution (the national frontier) and P10 the lowest 10 per cent productivity firm.
Figure II.8B. …and similarly for frontier firms in services
Source: Authors’ calculations using statistical office micro-data.
Notes: Reflects cross-sectional percentiles of the firm productivity distribution within country-industries over time, P90 reflects the 90th percentile of the firm productivity distribution (the
firm.
Figure II.9. The national frontier in EAP countries is falling behind global frontier, especially in digital sectors
Distance between national and global frontier
A. Digital-intensive sectors
Source: Authors’ calculations using statistical office micro-data and Criscuolo (2023) for global frontier. Notes: national frontier is defined as in the previous
B. Less digital-intensive sectors
since new knowledge and technologies typically arrive first at the frontier, and then spillover to the rest of the firms, revitalizing the national frontier firms matters for the future growth of all firms. At a time of digital transitions this is likely of heightened importance. We examine whether new technologies are diffusing to the frontier in the next section.
Ì c) The national frontier is falling behind in advanced technology use
Even the most technologically sophisticated firms nationally in EAP are less sophisticated than their counterparts in more advanced countries, like Republic of Korea, indicating slow technological diffusion. Unsurprisingly, firms in developing East Asia are less sophisticated than those in the most advanced country for which we have technology measures from the World Bank FAT survey (Republic of Korea). However, comparing the distribution of technology reveals that these technology gaps are wider in the more sophisticated firms (figure II.10). The gap between the least sophisticated firms in Cambodia, Indonesia and viet nam and the least sophisticated firm in Republic of Korea is relatively small (those with low quantile scores). But the gap widens as one compares the most sophisticated in these countries – as indicated by the downward sloping line. In Cambodia and viet nam the gap with Korean firms is around twice as large for the most sophisticated 5 per cent of firms, compared to the bottom 5 per cent, with a smaller difference for Indonesia. The relative lack of sophistication of the national frontier is also true beyond East Asia, in Bangladesh, Georgia and Ghana, although does not seem present in India (figure II.11). This indicates that advanced technologies are diffusing slowly to the national leaders in EAP and some other developing countries, compared to the leaders in advanced countries.
For national leaders, there are substantial differences between having a technology and using it. The limited technology diffusion is particularly evident when measuring a firm’s most commonly used technologies (as in figures II.10 and II.11). However, firms use a bundle of technologies, for instance, combining written notes with electronic databases, or manual manufacturing tasks with automated machinery (Cirera et al., 2022). If instead one measures the most advanced technology a firm has, whether it uses it frequently or not, the differences between national leaders in EAP and national leaders in advanced countries is much smaller. This suggests the barriers for the most sophisticated firms in EAP are less about accessing advanced technologies and more about effective use. The challenge of embedding technologies within business processes is that it often requires substantial sunk investment in skills and organizational capital (Brynjolfsson et al., 2008, Bloom et al., 2012).
Advanced digital technologies, such as data analytics, are also diffusing more slowly to the national leaders in EAP, compared to national leaders in other developing countries. Earlier figure II.10 compared firms in EAP to advanced country benchmarks, here we compare technology use of firms in EAP against similar income developing countries (figure II.12). The average firm in Cambodia, Indonesia and viet nam is as technologically sophisticated as the average firm in country peers of a similar income. However, the most advanced firms in Cambodia and viet nam are less tech-sophisticated than the most advanced firms in similar income countries.
Gaps in technology use are especially evident in the case of new technologies related to data analytics (figure II.13) –technologies which have been strongly linked to the rising performance of the best firms globally. A natural question is what has changed to cause the national frontier to lag the global frontier. Data driven business models are one candidate. In advanced economies, business models of the best firms have shifted from investment in tangible assets like factories or machines, towards investment predominantly comprising intangibles like data or business processes (Corrado et al. 2016). software alone is now responsible for 18 percent of total Us corporate investment, from 3 percent in 1980 (De Ridder, 2024). These data technologies require large sunk costs, through the costs of acquiring and processing large volumes of data and reorganizing and retraining to embed data analytics within business. However, data intangibles can be duplicated and used throughout an organization at close to zero marginal cost, which can lead to substantial productivity gains (De Ridder, 2024).
Figure II.10. Gaps in technological use between developing East Asia and advanced countries are wider for more sophisticated firms
Distance in technology use between EAP and advanced countries for different quartiles of technology sophistication (Higher Quartiles = More Sophisticated)
Source: World Bank Firm-level Adoption of Technology (FAT). Cirera et al. (forthcoming).
Note: Reflects the sophistication of the most common general business function technology (intensive margin) for both manufacturing and services sectors. The distributions of Cambodia, Indonesia and viet nam are compared to the same percentiles in the distribution of the most advanced country (Korea , Rep.)) in the FAT data. For example, quantile 95 compares the top 5 per cent most sophisticated firms in each country and the top 5 percent in Republic of Korea.
Figure II.11. The wide technological sophistication gaps between the best national firms and the best firms globally is apparent in some countries in other regions
The high sunk costs mean potential productivity gains are concentrated in few firms that can deploy them effectively – those with access to large international markets over which to spread the sunk costs, big data from customers and suppliers and the necessary skills.
EAP’s relative inertia in productivity growth may be because frontier firms do not have adequate incentives and because all firms lack the relevant capabilities. Here we consider the evidence.
Figure II.12. Technological sophistication of the average firm in EAP is in line with similar income countries, but the most advanced firms in EAP are behind the most advanced elsewhere
Source: World Bank FAT surveys. Notes:
Figure II.13. Use of advanced data analytics software is limited in developing EAP
World Bank
Greater competition (or the threat of competition) increases the incentives for frontier firms to innovate and grow (figure II.14). openness to trade and investment can generate competitive pressures. However, these pressures can have heterogeneous effects. Firms that are close to the technology frontier innovate to escape competition, whereas laggard firms are discouraged and innovate less (Aghion et al., 2005, 2009, 2017). For example, Chinese competition has been found to increase the innovation of leading firms but depress it for non-leading firms in other parts of the world (Cusolito et al., 2023; Iacovone, 2012).
Note: Frontier firms refer to the most productive firms within a country and industry.
The dynamism of frontier firms depends on the threat of competition from both other incumbents and new entrants. The existence of larger state-owned Enterprises (soEs) can discourage the entry of new firms and increase market concentration in those same sectors (figure II.15). since capital and labor are trapped in less productive soEs, it is harder for startups to attract the resources needed to enter and it is harder for productive incumbents to scale up and grow.25 For example, in Chinese prefectures, soE’s adverse impact on entry reduces productivity through greater misallocation of capital – capital is trapped in less productive incumbents (Brandt et al., 2020b). Conversely, the disruption to politically connected firms following the fall of the suharto regime in Indonesia, led to improvements in measures of competition in these industries (HallwardDreiemeier et al., 2021). In addition, restrictions in labor markets can make hiring qualified workers harder and labor flows more slowly to the most productive firms.
Figure II.15. Higher soE presence is associated with lower entry and greater concentration
Effect of SOE participation on entry and concentration
Frontier firms in EAP that are more exposed to international competition show faster productivity growth (figure II.16). Firms at the national frontier are more likely to be foreign owned or exporters, but foreign firms and exporters remain in the minority, even within the frontier (as noted earlier). The national frontier comprises a mix of firm types, so unsurprisingly not all frontier firms are stagnating. Foreign owned frontier firms showed 5 percent faster annual productivity growth than other frontier firms, whereas state-owned firms have 3 percent slower productivity growth. Moreover, competition from foreign firms or state-owned firms within their sector can have important spillovers on the growth of domestically or privately owned firms. A 10 percent increase in the share of foreign ownership is associated
25 Informality can be a challenge for productivity growth, but this largely affects growth at the bottom of the productivity distribution. Barriers to entry into the formal sector or size-dependent distortions (such as taxes or employment regulations), can lead to a missing middle, too many firms remain small and informal. Competition from informal firms can also reduce the ability of formal sector firms to grow (e.g. Amin, 2021). In EAP, smaller firms are more likely to report competition from informal firms being a problem (World Bank Enterprise surveys).
Figure II.14. In principle, higher competition raises productivity growth of frontier firms Source: Aghion (2017).Figure II.16. Higher soE presence in EAP is associated with lower and higher foreign firm presence with higher productivity growth of frontier firms
Source: Authors’ calculations using statistical office micro-data for China, Indonesia, and the Philippines.
with 2 percent higher productivity growth of domestically owned frontier firms. Conversely, 10 percent higher state ownership shares is correlated with 2 percent lower productivity growth of privately owned frontier firms. levels of competition in EAP could constrain frontier growth. While tariffs on goods imports are relatively low in EAP countries, tariffs in agriculture and non-tariff measures in manufacturing still limit competition. Furthermore, competition-inhibiting product market regulations, such are restrictions on foreign ownership, are 50 percent more restrictive in China and Indonesia than in the Us (oECD). some EAP markets, for example in viet nam, are dominated by soEs (figure II.17). Moreover, in labor markets the oECD employment protection index is also around 40% more restricted in Malaysia and Thailand, and around twice as restricted in Indonesia than in oECD economies (oECD).
Figure II.17. soEs account for large share of activity in EAP
SOE revenue as a share of GDP
Source: Business of the state, data for 2019.
Competition from startups has fallen dramatically over the past decades, especially in digital-intensive sectors. one way of measuring the importance of startups in an economy is by their share of employment. Young firm employment shares have fallen dramatically in all EAP economies for which we have firm-level data, and this is especially the case in digital intensive sectors (figure II.18). The region is increasingly full of aging incumbents. similar evidence of declining entry rates is found for a broader range of EAP countries using the WB Enterprise surveys. In addition, the quality of entrants appears not to have increased in Indonesia and China – with new entrants being less productive than incumbents in recent years.
Firm entry has slowed in EAP, especially in digital sectors
Changes in firm entry over time
Figure II.18.Better access to international markets can also increase incentives for frontier firms to adopt modern technologies that drive growth (figure II.19). Access to large markets increases the returns to adopting technologies and can spur adoption. Modern data technologies have high fixed costs, but these technologies are scalable, and can therefore lead to productivity gains throughout the organization. Firm incentives to invest in these high fixed-cost technologies depend on access to large international markets (in goods and services) which make it possible to spread the cost of adoption over a larger output. However, the restrictions on foreign entry in EAP markets, especially in the services sectors, have the effect of segmenting regional markets and depriving firms of the innovation incentives stemming from large scale production.
Most EAP countries restrict services trade more than other economies at comparable levels of development
restrictiveness index (2022)
telecommunication services
Figure II.19. Most EAP countries restrict services trade more than other economies at comparable levels of development (Continued)
E. Services trade restrictiveness index (2022)
STRI and GDP per capita (2022)
Maritime freight transportation
G. Services trade restrictiveness index (2022)
In the last EAP Economic Update, we focused on services, and we unveiled new evidence from the service Trade Restrictiveness Index (sTRI) produced by the World Bank and the WTo. The sTRI is a measure of the restrictiveness of an economy’s regulatory and policy framework with respect to trade in services, computed from the service Trade Policy Database, which includes a broad set of measures affecting services trade both by sectors and mode of delivery. These indicators belong to four distinct areas of policy measures: i) Conditions of market entry, ii) Conditions of operation, iii) Measures affecting competition, iv) administrative procedures.
new data for 2022 reveals that service liberalization is still an unfinished business. Figure II.19 reports the sTRI value recorded in several services sectors—commercial banking, telecommunication, life insurance, and maritime transportation—by the larger EAP as well as three Asian advanced economies: Japan; Korea, Rep.; and singapore. For each sector, accompanied scattered plots are also presented, featuring the sTRI index for the sectors against the level of development (measured as the logarithm of the GDP per capita). As of 2022, EAP countries are still characterized by relatively restrictive regimes for services trade in most of the sectors. Moreover, compared to other economies, this restrictiveness is higher than what would be expected on the basis of the level of development.
Turning to the trade in goods, while the applied tariff rates have declined drastically over the last few years (with the notable exception of the increase in tariffs due to the Us-China trade tensions), non-tariff measures (nTMs) have increased substantially in the EAP region. These measures can the classified as technical measures (such as technical barriers to trade, TBTs, or sanitary and phytosanitary measures, sPs) and non-technical measures (such as quantity controls and licensing requirements). According to a recent survey, 55% of the exporters in the EAP region mention them as a burden and as barriers that limit their ability to expand into new markets (ITs, 2023).
Figure II.20 reports the average difference between the number of border nTMs applied by a given economy in each product and the average number of measures applied to that product in the world in 2021. some EAP economies display an incidence of border nTMs higher than other regions.
Productivity growth and adoption of sophisticated technologies require a broad range of skills and high-quality digital infrastructure. With only basic mobile broadband and workers with strong foundational skills, some technologies (such as e-commerce) are relatively straight forward to adopt with off-the-shelf e-commerce websites, that can be bolted onto existing business processes. In contrast, modern data technologies (such as data analytics or cloud computing) require high-speed fiber broadband to send and receive data with customers/suppliers/within firms, and the right combination of digital and management skills to embed data-driven decision making within business models.
Frontier firms face different constraints to those less productive – especially relating to accessing markets, digital infrastructure or skills (figure II.21). Policy barriers can prevent firms from entering markets or scaling up if they do, such as formalization costs or business licensing regulations, enforcement of labor market policies, access to finance, or size-dependent tax enforcement (Fattal-Jaef, 2022; Bachas et al., 2019; Didier and Cusolito, forthcoming). However, these policies typically affect new or small firms. For instance, in East Asia and Pacific, business licensing, corruption or court efficiency, inadequate electricity infrastructure or tax rates are key constraints to the business operations of lower productivity firms but are less of an obstacle to those most productive (figure II.22). In contrast less is known about the barriers that apply differentially to those most productive. The most productive firms in East Asia and Pacific are more likely to report barriers relating to accessing markets (transport or trade regulations) or the telecommunications infrastructure or skills.
Figure II.20. China, lao PDR, Philippines and viet nam display border non-tariff measures higher than the world average
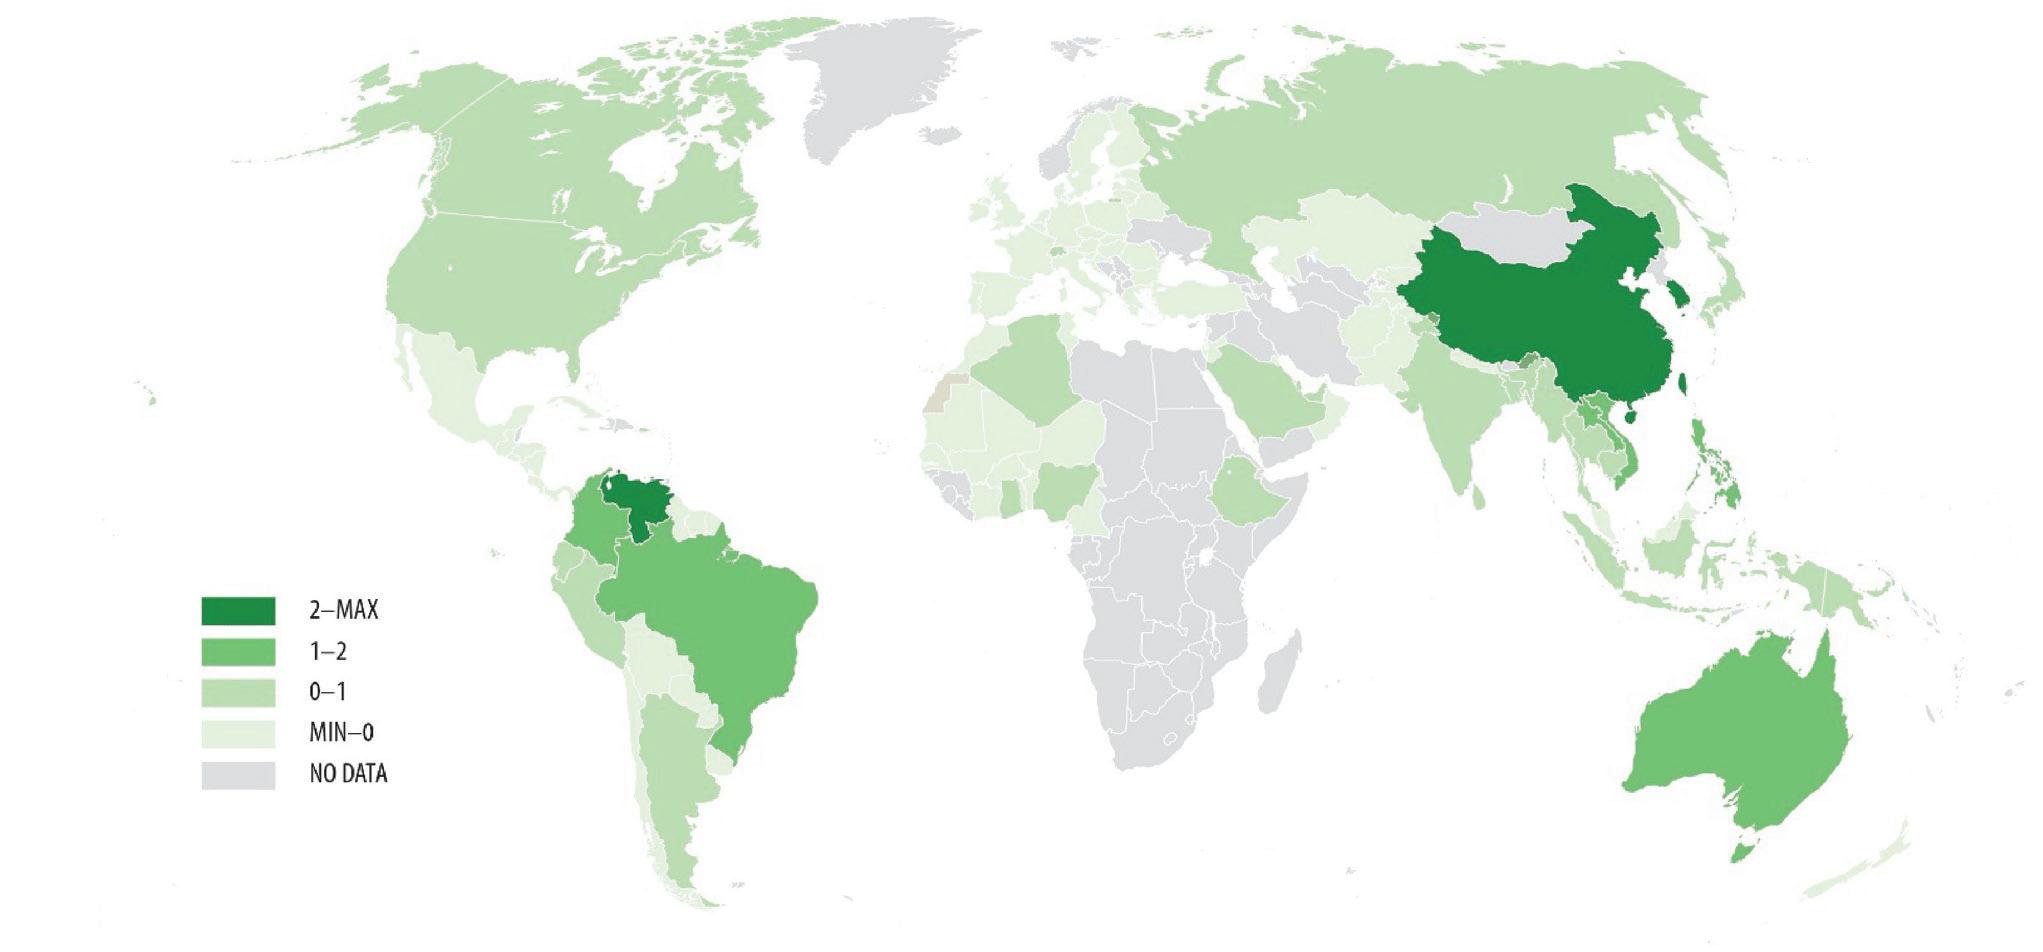
Source: UnCTAD 2023
Note: The map shows the average difference between the number of border nTMs applied by an economy in each product and the average number of measures applied to that product based on TRAIns nTM data in 2021. Averages are computed by weighing each product by its importance in world trade. Following Ederington and Ruta (2016), border nTMs cover: all price and quantity control measures (e.g., quotas, bans, prohibitions, non-automatic licenses), pre-shipments inspections, port of entry or direct consignment requirements as well as other customs monitoring and surveillance requirements, customs inspection, processing and servicing fees, additional taxes and charges levied in connection to services provided by the government (e.g., stamp tax, statistical tax). Border nTMs also cover: sPs registration, testing, certification, inspection, traceability, and quarantine requirements, and conformity assessments as well as TBT registration, testing, certification, inspection, and traceability requirements, and conformity assessments.
Box II.B6. Competition and Economies of Scale – Kiribati Coconut Industry
Economies of scale mean that dried coconut processing is concentrated in a few large coconut producers. Given the highly tradeable, shelf-stable characteristics of coconut oil and dried coconut, the market has ultimately become global. Global production has become concentrated in a few highly efficient hubs in EAP. Indonesia and the Philippines both grow more coconut and produce more coconut oil than the rest of the world combined. But what does this mean for small remote island economies, such as Kiribati, that have historically relied on coconut farming and processing?
Efficient logistics services can facilitate firm innovation in new product types – where firm scale is less of a barrier –such as fresh coconuts. Firm scale is less of a barrier to participating in the fresh coconut industry. However, the moisture content in fresh coconuts makes it more perishable and so access to advanced cold chain logistic services is key to deliver these products to export markets. Following a 2010 government initiative, logistics services have become a key competitive advantage for Thailand’s Ratchaburi province farmers and firms – becoming a global cluster for exports of such fresh coconuts.
shifting to fresh coconut products in Kiribati faces additional constraints to due to subsidies and small industry scale. Kiribati maintains a subsidy for dried copra, which is at least four times the true market value, and prevents resources being reallocated to more productive firms, segments and industries.
In Thailand, small scale fresh coconut producers can thrive because the industry is large enough to support specialized logistics services. However, small island economies, like Kiribati, may have insufficient industry scale to support these logistics services firms. Kiribati may therefore need to look to technological solutions, like High Pressure Processing and Flash Freezing, that make coconut water more easily tradeable using deep freeze shipping containers.
Figure II.21. More productive firms report trade regulations, workforce skills and transport or telecommunication infrastructure, as important constraints to business operations
Figure II.22. However, the most productive firms report fewer constraints relating to business licensing, corruption and the courts, electricity infrastructure or taxes
Constraint severity by labor productivity quartile (versus bottom quartile)
Source: World Bank Enterprise surveys.
Constraint severity by labor productivity quartile (versus bottom quartile) 2nd Quartile 3rd Quartile Most Productive Quartile
Notes: Manufacturing labor productivity quartiles are calculated within each country and year (applying sampling weights). scores reflect the severity of constraint reported by firms (on the scale 0 to 4) within each quartile, relative to the bottom quartile least productive firms. Presents the results of firm-level regressions of reported constraints on labor productivity quartiles, controlling for firm size and country and year fixed effects. Reflects data for 13 low- and middle-income EAP countries.
Source: World Bank Enterprise surveys.
Notes: Manufacturing labor productivity quartiles are calculated within each country and year (applying sampling weights). scores reflect the severity of constraint reported by firms (on the scale 0 to 4) within each quartile, relative to the bottom quartile least productive firms. Presents the results of firm-level regressions of reported constraints on labor productivity quartiles, controlling for firm size and country and year fixed effects. Reflects data for 13 low- and middle-income EAP countries.
Access to modern data infrastructure is uneven in the EAP and needs to go beyond only access, to focus on integrated highquality digital public infrastructure. While access to mobile broadband is widespread in EAP, high-speed fiber is unevenly available across and within countries (figure II.23). There are wide variations in the availability of data centers within EAP needed to store, share and process data via the cloud. Data localization and variations in data privacy laws limit access to cross border data and cloud computing.
Governments need to go beyond piecemeal access to focus on whole-of-government integration of digital stacks. so called digital stacks refer to the integration and interoperability of systems, including digital identity, digital payment systems, data exchange and information systems (such as relating to health or education) (World Bank, 2022). The interoperability of these digital systems facilitate digital services and can lead to innovation in both the public and private sector, which for instance in Thailand allows linking digital IDs with financial accounts to facilitate online payments. However, many countries within EAP have struggled with the challenge of shifting towards electronic health records and integrated digital health systems (Raghavan, 2023).
The right skills to leverage technology productively are not widely available in EAP. Ensuring universal foundational skills through basic education in the region is essential. In 14 of the region’s 22 middle-income countries, more than half of 10-year-olds are unable to read and understand an age-appropriate text (Afkar et al. 2023). Countries need to invest in tandem in the more sophisticated skills required for new technology adaptation and innovation. Digital occupations
Figure II.23. High-speed broadband is unevenly available within and across EAP countries
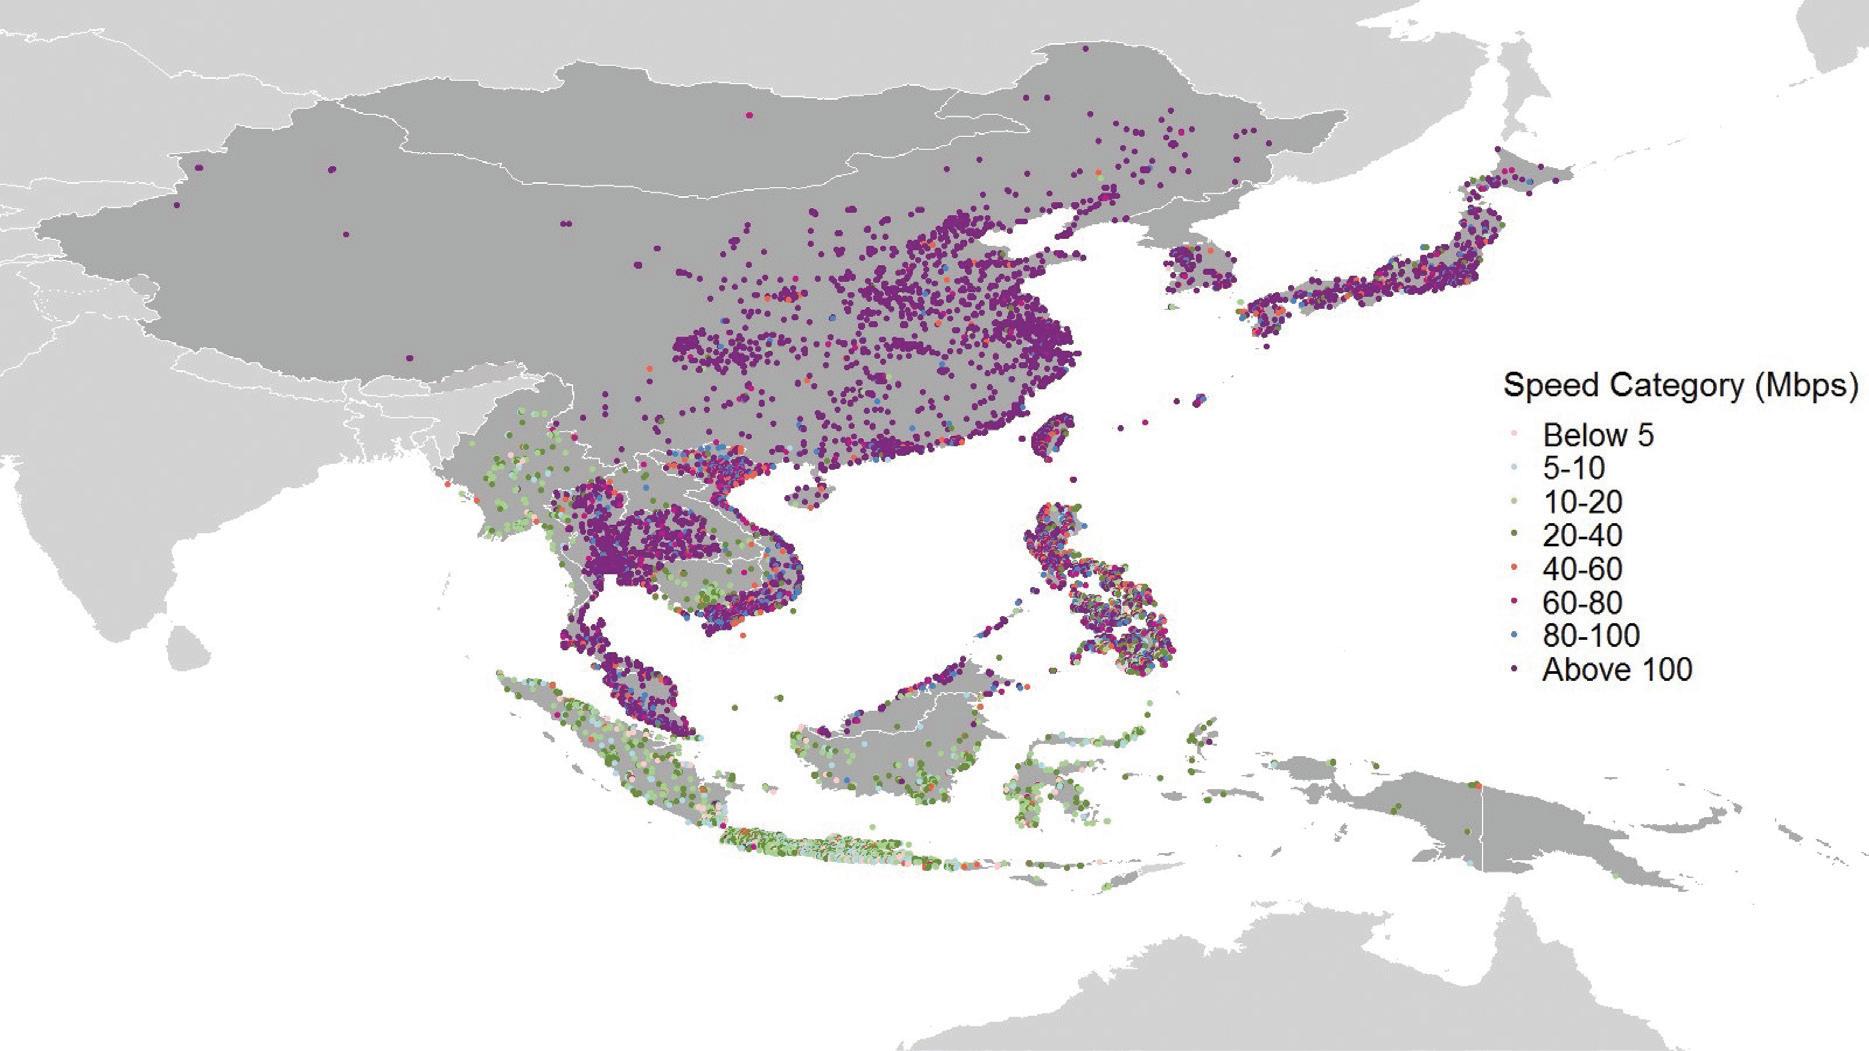
Source: ookla fixed broadband speedtest data at 2023-Q2.
also demand different skills from non-digital jobs (Cunningham et al., 2022). But even basic digital skills are not widely available in EAP, with less than a quarter of workers in Cambodia, Mongolia, Philippines, Thailand, and viet nam able to use the “copy and paste” function in a document (figure II.24)
An often-overlooked dimension of the skills gap is the lack of managerial capabilities needed to take advantage of technologies and reap the productivity gains. Management skills and organizational capital have been shown to be strongly correlated Speed Category (Mbps)
Source: ITU.
with technology adoption and productivity (Bloom et al., 2012). Firms in both developed and developing EAP countries are on average less well managed than the Us (figure II.25). notably, the best managed firms in developing EAP countries are further behind the best managed firms in advanced EAP and far behind the best managed in the Us. securing the best managers appears to be a challenge for the best firms in developing EAP.
Figure II.25. The best managed firms in developing EAP have skills far below the best in advanced economies
Distance in management skills versus the US for different levels of management sophistication
China Viet Nam Singapore
Australia New Zealand
Policy reforms and support can help generate both the incentives to invest in technology to improve productivity and the capabilities to do so. Although policies related to competition, digital infrastructure and skills are already known as some of the many drivers of growth more generally, we highlight this subset as policy priorities for reigniting frontier firm productivity. While it may be presumed that capacity issues are purely an issue for laggard firms, our evidence in the previous section showed that frontier firms also do not have sufficient capacity in some respects, such as management skills.
Note: The charts reflect the gap in management scores between the top 10 per cent best managed firms in EAP compared to the top 10 per cent best managed firms in Us. Bottom 10 per cent and median are defined similarly.
Reforms to goods and services markets can spur competition and accelerate productivity growth. Reform of both tariffs and non-tariff measures could increase the exposure of goods markets to foreign competition. While goods tariffs are low, many non-tariff barriers behind the border persist. Elimination of restrictions on entry and operation in services could have a procompetitive impact. Reforms in services, especially given the growing role of services in manufacturing, can have positive productivity impacts extend beyond the direct impact on services to manufacturing firms that use services (Arnold et al., 2016)
Evidence for EAP and other countries confirms that reducing barriers to competition in services spurs higher productivity growth in services sectors as well as in the manufacturing sectors that use these services (figure II.26). services reforms in viet nam raised labor productivity of firms in these same sectors as well as downstream manufacturing (figure II.27). Following the country’s accession to the WTo in 2007, viet nam has made noticeable progress to liberalize services trade. Between 2008 and 2016, the services trade restrictiveness index (sTRI) declined sharply in sectors such Finance, Transport, and Professional services. The liberalization led to a 2.9 per cent annualized increase in labor productivity in these services sectors (panel A) and a 3.1 per cent increase in labor productivity in downstream manufacturing that used these services inputs (panel B). However, the World Bank-WTo services Trade Restrictions Database reveals that service trade liberalization is still unfinished business in the EAP region.
The diffusion of new technologies can present new avenues for competition-induced growth. The diffusion of platforms in the Philippines presents a competition shock, for example e-commerce platforms affect traditional wholesalers and retailers by offering customers new ways of connecting with suppliers, e.g., through online matching, review and rating systems (Rivares et al. 2019). We follow Rivares et al. (2019) and proxy the diffusion of platforms using data on Google
Figure II.26. openness to foreign investment is positively associated with technology diffusion and productivity
A. Correlation between technology use propensity and firm foreign ownership
B. Correlation between TFP and firm foreign ownership
Figure II.27. opening services to competition can increase productivity in these services sectors and downstream manufacturing sectors that use services inputs
A. Productivity effects of service reform on services firms (own-effect)
B. Productivity effects of services reform on manufacturing firms (downstream effect)
Source: World Bank staff estimation based on data from viet nam enterprise surveys 2008 and 2016.
Note: ols regression results. The dependent variable is the change in log value-added per worker between 2016 and 2008. The main explanatory variable is the change in sTRI values in Trade, Transport, Finance, Professionals, and Telecommunication sectors between 2016 and 2008 in Panel A, and the change in the “downstream” sTRI for manufacturing sectors in Panel B. The downstream sTRI is a sector-specific measure for each 2-digit manufacturing sector, calculated by the average sTRI of the above five services sectors weighted by the corresponding purchasing value from each manufacturing sectors. The regression sample in panel A consists of all enterprises operating in Trade, Transport, Finance, Professionals, and Telecommunication sectors, and all manufacturing enterprises in Panel B, in 2008 and 2016. All regressions control for firms’ baseline revenue and employment. standard errors clustered at the industry level.
search trends for major platforms (figure II.28 panel A). There is a particularly rapid explosion in wholesale and retail, with major e-commerce platforms such as Grab, lazada and shopee appearing in the period 2012–2015, and to a lesser degree transport and accommodation and hotels (pre-CovID). In the Philippines, we see that platform diffusion increases the wages and productivity of incumbents in the same sectors, as well as much larger increases in wages and productivity for downstream firms that use these services (figure II.28 panel B).
Figure II.28. Diffusion of platforms in PHl can be seen as a competition shock that increases firm productivity
A. Diffusion of Platforms
B. Effect of platform diffusion on productivity on firms in the same sector and indirectly on downstream sectors
Source: Authors’ calculations using Google Trends Data (left panel), Philippines statistical Authority – AsPI and CPBI Databases (right panel), following approach of Rivares et al. (2019).
Notes: Platform use is proxied using the frequency of Google searches - following Rivares et al. (2019).
The chart reflects forty-two platforms (nine retail,eleven transport, eight food service, seven finance and seven travel and accommodation). Platform use index is normalized relative to retail platform use in 2020. The right hand chart shows the results from regressions of firm performance metrics on measures of platform diffusion, including firm and year fixed effects. To aid comparisons across regressions, the figure presents the estimated percentage change in firm performance from a one standard deviation change in platform diffusion, roughly equivalent to going from the median to the ninetieth percentile change. Direct own-sector results reflect the correlations between firm performance and platform diffusion in accommodation and Travel, Food services, Transport and Wholesale and Retail. The downstream platform diffusion measure is a weighted sum of upstream platform diffusion, with the weights reflecting intermediate input shares taken from the Philippine’s Io table. Indirect downstream effects are representative of manufacturing and services sectors (IsIC rev 4 divisions 10-33 and 45-82) for the period 2010 to 2019. Wage correlations are statistically insignificant for direct own-sector effect, all other coefficients are significant at the 90% level or more.
Ì b) Complementary reforms to both expand access to capabilities and increase competition reinforce impact.
Widening access to infrastructure combined with reforms to spur competition have larger impacts in combination. Initial evidence from the rollout of the Philippines’ fiber backbone to 12 provinces suggests that this leads to increased use of e-commerce, but mainly for firms with higher quality connections and also for firms in more competitive sectors (measured by downstream services trade restrictiveness index or platform usage). In the Philippines, openness to foreign competition and access to fiber broadband both individually increase technology adoption, but combined their impact is more than double (figure II.29).
Figure II.29. Firm TFP or data analytics use is strongly associated with having both access to fiber broadband and foreign ownership
Correlation between productivity or Data Analytics and Foreign Ownership or Fiber Broadband Use
Source: Authors’ calculations using Philippines statistical Authority – AsPI and CPBI Databases.
Improving human capital has at least three dimensions. First is completing the unfinished agenda of fixing the foundation of basic skills on which more advanced skills can be built (Afkar et al., 2023). Teacher knowledge of content and teaching practices have been identified as key problems. Ensuring meritocratic teacher recruitment and investing in teacher training, motivation and support is imperative and is estimated to produce benefits in terms of discounted life-time earnings that are ten times larger than the costs.
second, individuals must be equipped with the skills to work with new technologies and the ability to innovate. That requires investments in tertiary education to develop workers’ advanced cognitive, technical, and socio-emotional skills.
A significant proportion of innovative firms in Indonesia, Malaysia, Myanmar, the Philippines, Thailand, and viet nam cite the scarcity of interpersonal and communication, foreign language, computer and information technology (IT) sills, or technical (non-IT) skills as critical challenges when it comes to hiring (Cirera et al., 2021). In China and viet nam, innovation intensive firms have higher demand for analytical and inter-personal skills (figure II.30). links between classroom learning and exposure to tasks from the factory floor to the R&D center can help. Today, linkages between research institutions and firms, including incentives for research institution-industry collaboration, are weak in the region and need to be strengthened. Technology is simply a tool by itself and requires complementary skills training for productivity gains to materialize. For instance, in historical examples of technology transfer to China and Italy, advanced machinery had a small and temporary impact on productivity, but when accompanied by skills training there were permanent increases in firm productivity (Giorcelli, 2019; Giorcelli and li, 2023).
Figure II.30. More innovative firms have higher demand for analytical or interpersonal skills


Notes: Firms are categorized by “innovation intensity,” measured by the number of innovation activities undertaken, as captured in the respective surveys. scaled from 0–5, low-, medium-, and high-innovation are defined, respectively, as those undertaking 0–1, 2–3, and 4–5 innovation activities. The viet nam analysis does not include an aggregated measure of “routine task intensity”; therefore, panel b shows instead an individual measure of “routine manual” tasks. no information was included in either panel on routine cognitive tasks because none of the related regression coefficients was statistically significant.
Advancing in the parallel tracks of ensuring universal strong foundations and more advanced skills is a balancing act. The extent of prioritization varies with a country’s demographic and institutional context and development level. A key challenge is determining the different roles for the public and private sectors in financing, provision and regulation of education services. Governments need to ensure equitable access through direct provision, financing and other targeted policies to remedy market failures and align the supply of skills to the demand.
Third, is enhancing the abilities of managers, both new graduates and those already in the work force. Differences in management quality are an important contributor to productivity differences across countries. Recent research suggests that management quality can be improved through interventions. For example, firms provided with management consulting in Colombia improved their management practices and increased employment (Iacovone et al. 2022). Another example is business training in Kenya, which helped firms figure out new products to sell, and there was little adverse impact on their rivals, and so overall (market) sales volume has grown (McKenzie and Puerto, 2021). such targeted support can be especially effective when combined with fostering competition, motivating managers skill upgrading (Box II.B7).
Targeted support to firms – so-called Industrial Policy – is being increasingly used, with governments choosing to go beyond getting the basic regulatory conditions right (Juhasz et al., 2023). These policies often have the goals of creating jobs, fostering innovation, productivity growth or accelerating technology development. It is clearly difficult to generalize evidence across contexts, but a recent paper by McKenzie (2023) considers how policies can achieve these aims, as summarized below.
one challenge for governments is choosing the target firms, especially given limited information. Governments do not need to pick winners but can design programs that the best potential firms select into. For example, in one business plan competition, while experts were unable to pick the fastest growing firms, the competition itself led to high potential firms selecting into applying.
The risks of capture by political elites or lobbying from powerful firms depends upon policy design. For example, the European Commission mitigates these risks by setting rules on the use of state aid that help prevent individual countries and politicians doling out support as favors.
supporting firms should be combined with fostering competition. Financing some firms to do more of what they were already doing can just result in them stealing business from unsupported firms – as in the case of a subsidized loan program in China. However, supporting all private schools in Pakistan villages resulted in firms competing on improving quality, raising children’s test scores. In Colombia, providing consulting to small groups of firms that were not directly competing with one another delivered lasting improvements in management at one-third the cost of providing individual consulting (Iacovone et al, 2022). The threat of Chinese import competition motivated Colombian firms to improve their management practices.
Improving access to capabilities is likely to be especially important for laggard firms for whom increases in competition magnifies their limited capabilities. laggard firms are heterogeneous – some are simply young and starting small, others are inefficient firms that should exit the market (Berlingieri et al., 2020). Therefore, support needs to both be targeted to firms with sufficient growth potential and be cost effectively scalable (Box II.B7). In Colombia, intensive and expensive one-on-one consulting and consulting in small groups of firms led to improvements in management practices of a similar magnitude (8–10 percentage points) and in firm sales, profits and labor productivity (Iacovone et al. 2022). But returns on group-based learning were higher and more robust, pointing to the potential of group-based approaches as a pathway to scaling up management improvements. Training micro-entrepreneurs in Chile similarly found similar returns to individual and group training (lafortune et al., 2018). This is despite group-based consulting often being less expensive and so more scalable than one-on-one (McKenzie and Woodruff, 2023).
There also appear to be important synergies between worker skills in general and management skills specifically. Regions in 19 countries (including China) with greater availability of skills and closer proximity to universities have firms with better management practices (Feng and valero, 2020). Using rotations of managers within a large multinational firm across 100 countries shows that being allocated a good manager leads to persistent gains for other workers in their team, in terms of wages, promotion and productivity (Minni, 2023).
Productivity refers to Total Factor Productivity, which is estimated using a value-added production function following the two-step estimator proposed by Wooldridge (2009). The production function is estimated separately for each country and 2-digit industry, which allows for differences in production technologies across industries and countries. To allow comparability, all monetary variables are expressed in real 2005 PPP dollars, using national industry price deflators (rebased to 2005) and the local currency to PPP dollar exchange rate in 2005. The TFP of the global frontier firms has been calculated similarly by the oECD and expressed in PPP dollars (Andrews et al., 2016, Criscuolo, 2023).
The national frontier in developing East Asia is defined as the most productive 10% of firms within a given country, 2-digit industry and year. The oECD defines frontier firms as the most productive 5% of firms in each 2-digit industry globally. our comparisons of the national and global frontier are for firms within the same 2-digit industry, which abstracts from differences across industries, for instance, in their tradability.
The lack of available price data is a common challenge in productivity estimation, so we use monetary values, rather than unit quantities in our production function. As a result, we measure revenue-productivity (so-called TFPR), which encompasses both higher quantity productivity (TFPQ) and higher markups (and so higher prices). our measure of the frontier reflects both firms with high TFPQ and firms with high markups. High markups may be due to greater market power (e.g. of state owned enterprises), but can also reflect the production of higher quality varieties or the use of sunk cost technologies – which would be the case if the frontier captures the more sophisticated firms. However, where price data is available, studies commonly find a strong correlation between TFPR and TFPQ (Eslava, 2013; Haltiwanger et al., 2018). In addition, firm surveys show that TFPR can be a better measure of firm capabilities than TFPQ (Atkin et al., 2019).
We define the frontier according to their level of productivity in a given country and industry and year, and examine their changes in productivity in the following sections of this report. To do so we report cross-sections of the productivity distribution over time - which allows for changes in the composition of the frontier over time. It is important to contrast this with so-called firm-level convergence regressions. Conventional convergence regressions often show faster within-firm productivity growth for initially less productive firms, conditional on survival. However, since entering firms can be less productive than incumbents, these conventional convergence regressions may go hand-in-hand with stable productivity distributions over time.
Arteta, C., Kamin, s., & Ruch, F.U. (2022). How do rising U.s. interest rates affect emerging and developing economies? It depends. Policy Research Working Paper; no.WPs 10258 Washington, D.C.: World Bank Group.
Baker, s. R., Bloom, n., & Davis, s. J. (2016). Measuring economic policy uncertainty. The Quarterly Journal of Economics, 131(4), 1593–1636.
Baumeister, C., & G. Peersman. (2013). Time-varying effects of oil supply shocks on the U.s. economy. American Economic Journal: Macroeconomics, 5(4), 1–28.
Baxi, P., naidoo, D., & Tandon, s. (2024). How much of economic growth trickles down to the population in resource-rish countries? Evidence from Papua new Guinea. Research Working Paper, World Bank, Washington, D.C. Binder, C. C. (2017). Measuring uncertainty based on rounding: new method and application to inflation expectations. Journal of Monetary Economics, 90, 1–12.
Blanchard, o. (2021). “Thoughts about Fiscal Policy”. February 2021. Bloom, n. (2009). The impact of uncertainty shocks. Econometrica, 77(3), 623–685.
Boer, l., Pescatori, A., & stuermer, M. (2023). not all energy transitions are alike: Disentangling the effects of demand and supply-side policies on future oil prices. IMF Working Paper 23/160, Caldara, D., Cavallo, M., & Iacoviello, M. (2019). oil price elasticities and oil price fluctuations. Journal of Monetary Economics, 103, 1–20.
Caldara, D., & Iacoviello, M. (2022). Measuring geopolitical risk. American Economic Review, 112(4), 1194–1225. Corriere ortofrutticolo. (2024, January 16). http://www.corriereortofrutticolo.it/.
Esquivel, C., & samano, A. (2023). Expansionary fiscal consolidation under sovereign risk. Mimeo. Evenett, s., Jakubik, A., Martin, F., & Ruta, M. (2024). The return of industrial policy in data. IMF Working Paper. Ha, J., & so, I. (2023). Global confidence, uncertainty, and business Cycles. International Journal of Central Banking, 19(1), 451–495.
Islamaj, E., & samano, A. (2022). Drivers of public debt in East Asia and Pacific economies. World Bank’s Research & Policy Briefs, 60. World Bank, Washington, DC. © World Bank. https://openknowledge.worldbank.org/handle/10986/38422 license: CC BY 3.0 IGo.
Islamaj, E., & samano, A., & sommers, s. (2024). The sovereign spread compressing effect of fiscal rules during global crises. Mimeo.
Jarociński, M., & Karadi, P. (2020). Deconstructing monetary policy surprises—the role of information shocks. American Economic Journal: Macroeconomics, 12(2), 1–43.
Jurado, K., ludvigson, s. C., & ng, s. (2015). Measuring uncertainty. American Economic Review, 105(3), 1177–1216. leduc, s., & liu, Z. (2016). Uncertainty shocks are aggregate demand shocks. Journal of Monetary Economics, 82, 20–35.
londono, J. M., sai, M., & Wilson, B. A. (2021). The global transmission of real economic uncertainty. International Finance Discussion Papers 1317. Washington: Board of Governors of the Federal Reserve system. ly, s., Hayati, F., De vaan, T. l., Muco, s., Edwards, K.A., Hill, s. C., & Tong, K. (2023). Cambodia economic update – From recovery to reform: special focus – Accelerating structural reforms to boost productivity and competitiveness. Washington, D.C.: World Bank Group.
Ma, H., Mei, X., & Tian Y. (2020). The impacts and potential mechanisms of credit support with regard to overcapacity: Based on theoretical and empirical analyses of steel enterprises. Resources Policy, 68, Article 101704. Mauro, Paolo; Zilinsky, Jan. 2016. “Reducing Government Debt Ratios in an Era of low Growth”. Policy Briefs PB16-10, Peterson Institute for International Economics.
Pandey, M. K, & Howes, s. (2022). Have living standards improved in PnG over the last two decades? Evidence from Demographic and Health surveys. Government, Economy and Society, 163.
Papua new Guinea national statistical office and United nations Population Fund. (2023). The socio-economic and demographic survey 2022 key indicators report. https://png.unfpa.org/sites/default/files/pub-pdf/socio-demographic_ and_economic_survey_digital_version.pdf.
Rodrik, D. (1991). Policy uncertainty and private investment in developing countries. Journal of Development Economics, 36(2), 229–242.
stock, J. H., & Watson, M. W. (2012). Disentangling the channels of the 2007–2009 recession (no. w18094). national Bureau of Economic Research.
World Bank. (2018). The independent state of Papua new Guinea – systematic country diagnostic. World Bank. (2021). World Bank East Asia and Pacific economic update, April 2021: Uneven recovery. © Washington, DC: World Bank.
World Bank. (2023a). World Bank East Asia and Pacific economic update, April 2023: services for development.” Washington, D.C.: World Bank.
World Bank. (2023b). Pacific economic update, August 2023: Recovering in the midst of uncertainty – special focus: Harnessing the benefits of Pacific migration. Washington, DC: World Bank.
World Bank. (2024a, January). Global economic prospects: subdued growth, multiple challenges. Washington, DC: World Bank. World Bank. (2024b). Pacific economic update, March 2024: Back on track? The imperative of investing in education. Washington, DC: World Bank.
Yang, Y., Z., liu, H. B., saydaliev, H. B., & Iqbal, s. (2022). Economic impact of crude oil supply disruption on social welfare losses and strategic petroleum reserves. Resources Policy, 77, Article 102689.
Afkar, R., Beteille, T., Breeding, M.E, linen, T., Mason, A.D., Mattoo, A., Pfutze, T., sondergaard, l.M., Yarrow, n. (2023). Fixing the foundation: Teachers and basic education in East Asia and Pacific. Washington, D.C. : World Bank Group.
Aghion, P., Bloom, n., Blundell, R., Griffith, R., & Howitt, P. (2005). Competition and innovation: An inverted-U relationship. Quarterly Journal of Economics, 120(2), 701–728.
Aghion, P., Blundell, R., Griffith, R, Howitt, P., & Prantl, s. (2009). The effects of entry on incumbent innovation and productivity. Review of Economics and Statistics, 91(1), 20-32.
Aghion, P. (2017). Entrepreneurship and growth: lessons from an intellectual journey. Small Business Economics, 48, 9–24.
Andrews, D., Criscuolo, C., & Gal, P. n. (2016). The best versus the rest: The global productivity slowdown, divergence across firms and the role of public policy. oECD Productivity Working Papers, no. 5.
Angrist, n., Djankov, s., Goldberg, P.K., & Patrinos, H.A. (2021). Measuring human capital using global learning data. Nature, 592, 403–408.
Araujo, J.T., vostroknutova, E., Wacker, K.M., & Clavijo, M. (2016). Understanding the income and efficiency gap in latin America and the Caribbean. Washington, DC: World Bank.
Arnold, J.M., Javorcik, B., lipscomb, M., & Mattoo, A. (2016). services reform and manufacturing performance: Evidence from India. Economic Journal, 126(590), 1-39.
Atkin, D., Khandelwal, A.K., & osman, A. (2019). Measuring productivity: lessons from tailored surveys and productivity benchmarking. AEA Papers and Proceedings, 109, 444-49.
Autor, D., Dorn, D., Katz, l.F., Patterson, C., & van Reenen, J. (2020). The fall of the labor share and the rise of superstar firms. The Quarterly Journal of Economics, 135(2), 645–709.
Bachas, P., Fattal Jaef, R.n., & Jensen, A. (2019). size-dependent tax enforcement and compliance: Global evidence and aggregate implications. Journal of Development Economics, 140, 203–22.
Bartelsman, E., Haltiwanger, J., & scarpetta, s. (2004). Microeconomic evidence of creative destruction in industrial and developing countries. World Bank Policy Research Working Paper 3464.
Bazzi, s., Muendler, M-A., & Rickey, l. (2014). sources of labor productivity changes in Brazil. Mimeo. Berlingieri, G., Calligaris, s., Criscuolo, C., & verlhac, R. (2020). “laggard firms, technology diffusion and its structural and policy determinants. OECD Science, Technology and Industry Policy Papers, no. 86.
Bloom, n., sadun, R., & van Reenen, J. (2012). Americans do IT Better: Us multinationals and the productivity miracle. The American Economic Review, 102(1), 167–201.
Bollard, A., Klenow, P., & sharma, G. (2013). India’s mysterious manufacturing miracle. Review of Economic Dynamics, 16(1), 59-85.
Brandt, l., litwack, J., Mileva, E., Wang, l., Zhang, Y., & Zhao, l. (2020a). China’s productivity slowdown and future growth potential. World Bank Policy Research Working Paper 9298.
Brandt, l., Kambourov, G., and storesletten, K. (2020b). Barriers to entry and regional economic growth in China. Mimeo.
Brown, J.D., Crespi, G.A., Iacovone, l., & Marcolin, l. (2018). Decomposing firm-level productivity growth and assessing its determinants: Evidence from the Americas. Journal of Technology Transfer, 43, 1571–1606.
Brynjolfsson, E., McAfee, A., sorell, M., & Zhu, F. (2008). scale without mass: Business process replication and industry dynamics. Harvard Business school Technology & operations Management Unit Research Paper no. 07-016.
Calvino, F., Criscuolo, C., Marcolin, l., & squicciarini, M. (2018). A taxonomy of digital intensive sectors. OECD Science, Technology and Industry Working Papers, no. 2018/14.
Ciani, A., Hyland, M.C., Karalashvili, n., Keller, J.l., Ragoussis, A., & Tran, T. (2020). Making it big: Why developing countries need more large firms. Washington, DC: World Bank.
Cirera, X., Mason, A.D., de nicola, F., Kuriakose, s., Mare, D.s., & Tran, T. (2021). The innovation imperative for developing East Asia. Washington, DC: World Bank.
Cirera, X., Comin, D., & Cruz, M. (2022). Bridging the technological divide: Technology adoption by firms in developing countries. Washington, DC: World Bank.
Cirera, X., Comin, D., Cruz, M., lee, K.M., & soares Martins neto, A. Forthcoming. Distance and convergence to the technology frontier. Mimeo
Corrado, C., Haskel, J., Jona-lasinio, C., & Massimiliano, I. (2016). Intangible investment in the EU and Us before and since the Great Recession and its contribution to productivity growth. EIB Working Papers 2016/08.
Corrado, C., Criscuolo, C., Haskel, J., Himbert, A., & Jona-lasinio, C. (2021). new evidence on intangibles, diffusion and productivity. OECD Science, Technology and Industry Working Papers, no. 2021/10.
Criscuolo, C. (2023). Productivity growth and structural change in the era of global shocks. KDI-Brookings Joint seminar: Productivity in a Time of Change.
Cunningham,W., Moroz, H.E., Muller, n., & solatorio, A.v. (2022). The demand for digital and complementary skills in southeast Asia. World Bank Policy Research working paper 10070.
Cusolito, A.P., Garcia-Marin, A. & Maloney, W. F. (2023). Proximity to the frontier, markups, and the response of innovation to foreign competition: Evidence from matched production-innovation surveys in Chile. American Economic Review: Insights, 5(1), 35-54.
Decker, R.A., Haltiwanger, J., Jarmin, R.s., & Miranda, J. (2020). Changing business dynamism and productivity: shocks versus responsiveness. American Economic Review, 110(12), 3952-90.
De Ridder, M. (2024). Market power and innovation in the intangible economy. American Economic Review, 114(1), 199-251.
Didier, T., & Cusolito, A.P. Forthcoming. Unleashing productivity through firm financing. World Bank. Ederington, J., & Ruta, M. (2016). non-tariff measures and the world trading system. World Bank Policy Research Working Paper series 7661.
Eslava, M., & Haltiwanger, J. (2013). Trade reforms and market selection: Evidence from manufacturing plants in Colombia. Review of Economic Dynamics, 16(1), 135-58.
Estrin, s., & Meyer, K.E. (2004). Investment strategies in emerging markets: New horizons in international business. Edward Elgar Publishing.
Fattal-Jaef, R. n. (2022). Entry barriers, idiosyncratic distortions, and the firm size distribution. American Economic Journal: Macroeconomics, 14(2), 416-68.
Feng, A., & valero A. (2020). skill-biased management: Evidence from manufacturing firms. The Economic Journal, 130(628), 1057–1080.
Foster, l., Haltiwanger, J.C., & Krizan, C.J. (2001). Aggregate productivity growth: lessons from microeconomic evidence. In C.R. Hulten, E.R. Dean, and M.J. Harper (Eds.), new developments in productivity analysis. University of Chicago Press.
Giorcelli, M. (2019). The long-term effects of management and technology transfers. American Economic Review, 109(1), 121-52.
Giorcelli, M., & li, B. (2023). Technology transfer and early industrial development: Evidence from the sino-soviet alliance. Mimeo.
Hallward-Driemeier, M., Kochanova, A. & Rijkers, B. (2021). Does democratisation promote competition? Evidence from Indonesia. The Economic Journal, 131(640), 3296–3321.
Haltiwanger, J., Kulick, R., & syverson, C. (2018). Misallocation measures: The distortion that ate the residual. nBER Working Paper 24199.
Harrison, A., Martin, l.A., & shanthi, n. (2011). learning versus stealing: How important are market-share reallocations to India’s productivity growth. nBER Working Paper 16733.
Iacovone, l. (2012). The better you are the stronger it makes you: Evidence on the asymmetric impact of liberalization. Journal of Development Economics, 99(2), 474-485.
Iacovone, l., Maloney, W. and McKenzie, D. (2022). Improving management with individual and group-based consulting: Results from a randomized experiment in Colombia. Review of Economic Studies, 89(1), 346–371.
ITs. (2003). Making regional integration work-company perspectives on non-tariff measures in Asia Pacific.
Juhasz, R., lane, n.J., & Rodrik, D. (2023). The new economics of industrial policy. nBER Working Paper 31538. lafortune, J., Riutort, J., & Tessada, J. (2018). Role models or individual consulting: The impact of personalizing microentrepreneurship training. American Economic Journal: Applied Economics, 10(4), 222-45.
Maloney, W. F., & sarrias, M. (2017). Convergence to the managerial frontier. Journal of Economic Behavior & Organization, 134(C), 284-306.
McKenzie, D., & Puerto, s. (2021). Growing markets through business training for female entrepreneurs: A market-level randomized experiment in Kenya. American Economic Journal: Applied Economics, 13(2), 297-332. McKenzie, D. (2023). Is there still a role for direct government support to firms in developing countries? Policy Research Working Papers; 10628. © World Bank, Washington, DC.
McKenzie, D., & Woodruff, C. (2023). Training entrepreneurs. VoxDevLit, 1(3). Melitz, M.J., & Polanec s. (2015). Dynamic olley-Pakes productivity decomposition with entry and exit. The RAND Journal of Economics, 46(2), 362-375.
Minni, v. (2023). Making the invisible hand visible: Managers and the allocation of workers to jobs. CEP Working Paper no. 1948.
Pancost, n.A., & Yeh, C. (2022). Decomposing aggregate productivity. Working Papers number CEs-22-25, Center for Economic studies, U.s. Census Bureau.
Paweenawat, A., Chucherd, T., & Amarase, n. (2017). Uncovering productivity puzzles in Thailand: lessons from microdata. PIER Discussion Papers 73, Puey Ungphakorn Institute for Economic Research.
Raghavan, A. (2023). Asia’s digital health innovations: The role of cross-border health data sharing. Asia House Research. Rivares, A.B., Gal, P., Millot, v., & sorbe, s. (2019). like it or not? The impact of online platforms on the productivity of incumbent service providers. oECD Economics Department Working Papers, no. 1548.
sivadasan, J. (2009). Barriers to competition and productivity: Evidence from India. The BE Journal of Economic Analysis & Policy, 9(1), 1-66.
UnCTAD. (2023). Key statistics and trends in 2022 – green goods trade and trade policies. WB-WTo. 2023 services trade restrictiveness database. Available at: https://itip-services-worldbank.wto.org/default.aspx Wooldridge, J.M. (2009). on estimating firm-level production functions using proxy variables to control for unobservables. Economics Letters, 104(3), 112-114.
World Bank. (2020). Thailand manufacturing firm productivity report. Washington, D.C. : World Bank Group. World Bank. (2022). A digital stack for transforming service delivery ID-payments and data sharing. Washington, D.C. : World Bank Group.
World Bank. (2023). The business of the state. Washington, D.C. : World Bank Group. World Bank. Forthcoming. From potential to prosperity: Growing to high income in Europe and Central Asia”. Washington, D.C. : World Bank Group.