2024 BUDGET
MAYOR’S RECOMMENDED
WE ARE SIOUX FALLS. TOGETHER WE THRIVE.

GNIKAT ERAC O F T O D A Y F O R A B E T T E R TOMORROW • TAKING CARE OF TO D A Y F O R A B ETTER TOMORROW • TAKING CARE O F T O D A Y F O R A B E T T E R WORROMOT
CITY COUNCIL CITY OF SIOUX FALLS


PAGE 3
DAVID BARRANCO SOUTHEAST
RICH MERKOURIS AT-LARGE
CURT SOEHL CENTRAL
SARAH COLE AT-LARGE
GREG NEITZERT NORTHWEST
PAT STARR NORTHEAST
PAUL TENHAKEN MAYOR
ALEX JENSEN AT-LARGE
MARSHALL SELBERG SOUTHWEST
PAGE 4
Intentionally Left Blank
September 17, 2019

Subject: Fiscal Year 2020 Budget

Dear Residents:
Today, I submit to you the final 2020 budget The 2020 budget reflects our citywide vision of “taking care of today for a better tomorrow ” Being good stewards of taxpayer dollars is one of our most important duties as elected officials. The budget recognizes that, as the City expands, so too does the need for improving and growing our public infrastructure, providing essential services that residents and visitors can rely on, and enhancing our quality of life to keep Sioux Falls at the top of everyone’s list for best places to live
This budget reflects stable revenue growth and the City’s ability to make the most of existing revenue sources, not taking any more than allowed by inflation or what is necessary to maintain essential services. It is critical we leverage data to make informed decisions and implement innovative ideas to maximize our use of resources to accommodate this growth, take care of our existing infrastructure, and plan ahead for an even brighter future for Sioux Falls.
In keeping with the One Sioux Falls Framework, new expenditures for programs and projects are specifically tied to this framework or a departmental BHAG (big hairy audacious goal) to make Sioux Falls even better


Safety and Health: The 2020 budget funds our top priority of public safety by adding five new positions within the police department and funding our share of several new employees for Metro Communications. A Community Resource Officer focused on mental health is also part of this budget. Accompanying this investment in mental health is funding for our partnership to launch the Community Triage Center in 2020. These combined efforts are part of a strategy to help narcotics users overcome their addiction while going after the drug suppliers and dealers. We’ve also included a pilot project for a Police report-to-work location to stretch existing resources by saving both commute times and space constraints at the downtown location.
in our city. As we are growing, crime rates have remained relatively steady within Sioux Falls, and part of the reason
PAGE 5
STAINABLEGROWTH
INNOVATION
PAGE 6
KIDS&FAMILIES ENGAGING PEOPLE S U
2024 CITY OF SIOUX FALLS BUDGET


PAGE 7 FIRE $40.4M INTERNAL SERVICES $126.3M PARKS & RECREATION $42.7M ENTERTAINMENT VENUES $12.9M POWER & DISTRIBUTION $16M HOUSING $10.8M TRANSIT $17M HIGHWAYS & STREETS $145.8M LIBRARY $11.3M WATER RECLAMATION $143.6M LANDFILL $17.2M PLANNING & DEVELOPMENT SERVICES $24M HUMAN RESOURCES FINANCE GENERAL FACILITIES INNOVATION & TECHNOLOGY COMMUNICATIONS OPERATIONS TEAM $19.8M MAYOR CITY COUNCIL CITY ATTORNEY’S OFFICE GENERAL ADMINISTRATION $5.7M PUBLIC HEALTH $19.8M WATER $44.9M POLICE $53.9 PUBLIC PARKING $3.4M
MAYOR'S RECOMMENDED $790.1M STORM DRAINAGE $19.1M SALES TAX SUPPORTED DEBT $15.6M
PAGE 8
Intentionally Left Blank
2024 BUDGET OVERVIEW / PG. 10
2024 CAPITAL PROGRAM PROJECTS / PG. 14
CITY PROFILE / PG. 16
CITY FINANCIAL PROFILE / PG. 19
2024 BUDGET BY DEPARTMENT / PG. 20
GENERAL ADMINISTRATION / PG. 21
Mayor
City Council
City Attorney’s Office
OPERATIONS TEAM / PG. 24
Human Resources
Finance
General Facilities
Innovation and Technology
Communications
PUBLIC SAFETY / PG. 31
Fire
Police
HIGHWAYS & STREETS / PG. 39
Highways and Streets
Storm Drainage
PUBLIC HEALTH / PG. 45
Public Health
CULTURE & RECREATION / PG. 45
Siouxland Libraries
Parks and Recreation
Entertainment Venues
ENTERPRISE FUNDS / PG. 68
Power and Distribution
Landfill
Water
Water Reclamation
Public Parking
INTERNAL SERVICE FUNDS / PG. 78
Fleet Management Fund
Health Benefits Fund
Workers’ Compensation
Risk Management Fund
Enterprise Network Technology Fund
Centralized Facilities Fund
Employee’s Retirement System
Firefighters’ Pension
115 Healthcare Trust
BUDGET EXHIBITS / PG. 87
Budget Resolution and Ordinance
Budget and Actuals by Fund
Budget and Actuals by Department
2024-2028 Capital Program
Service Outcomes and Statistics
Fulltime Positions by Department
URBAN & ECONOMIC DEVELOPMENT / PG. 60
Planning and Development Services
Housing
Transit
Tax Increment Financing (TIF)
PAGE 9
TABLE OF CONTENTS
2024 BUDGET OVERVIEW
THE CITY BUDGET
The City budget is divided into three types of expenses: operating, capital, and internal service. Operating expenses are the day-today expenses necessary to keep services running smoothly. Capital expenses are the large investments focusing on replacement, rehabilitation, and expansion of infrastructure and equipment. Internal service expenses are used to account for and fund employee benefits, insurance, City-wide fleet, centralized building management, and hardware/software technology.
The total City budget for 2024 is $790.1 million.
REVENUE SOURCES
$330.2M OPERATING
$341.1M CAPITAL
$118.8M INTERNAL SERVICE
When thinking about how the City is funded, most people think about taxes. While taxes make up a large part of the budget, there are actually multiple revenue sources that fund City services. Total revenue is $787.2 million.
SERVICE EXPENDITURE BUDGET BREAKDOWN*
BUDGET HIGHLIGHTS
• Over 700 Blocks of Street Reconstruction
• South Veterans Parkway
• Benson Road & I-229 Interchange
• 85th Street & I-29 Interchange
• Cliff Avenue & I-229 Interchange
• Drinking Water Well 25 Improvements
• Pump Station 240 Utility Infrastructure
• Water Reclamation NW Expansion (Basin 15)
• McKennan Pool Replacement
• Design of Indoor Pool & Recreation Space (Frank Olson and Keuhn Park)
• Harmodon Field Renovations
• Midco® Pool Locker Room Expansion
• Arrowhead Park House Renovations
• Park Trail Improvements (Arrowhead & Glenview)
• Strategic Land Acquisition
• 24 New Fulltime Positions (Including 7 New Police Officers)
• Employer of Choice (Market Competitive Wages and Recruitment)
• Part-time Wage Adjustments
• Public Safety Training Center Operations
• Snow Removal Equipment
• Centralized Technology
• Centralized Fleet and Facilities
*Internal Service and Fiduciary Funds not included
PAGE 10
41% TAXES $323.7M 24% CHARGES FOR GOODS & SERVICES $186.4M 3% CONTRIBUTIONS $25.1M 2% LICENSES, PERMITS, MISC. (ASSESSMENTS, RENTALS, FINES) $18.7M 12% OTHER FINANCING (SRF LOANS) $93.8M 2% TRANSFERS IN $13.3M 7% INVESTMENTS & INTEREST EARNINGS $54.1M 9% INTERGOVERNMENTAL $72.1M
Parking: $3.4M 1% Power & Distribution: $16M 2% Sanitary Landfill: $17.2M 3% Transit: $17M 2% General Government $25.5M 4% Planning & Development: $34.8M 5% Culture & Recreation: $66.9M 10% Tax Supported Debt Service: $17.3M 3% Public Safety & Health: $114.1M 17% Highways & Streets: $163.2M 25% Water & Water Reclamation: $188.4M 28%
2024 GENERAL FUND OVERVIEW
The 2024 budget for the City’s primary operating fund, the General Fund, is $234.1 million, up $18.6M or 8.6%. This fund provides the essential operating services of the City, including fire and police, highways and streets, parks and recreation, public health, and public libraries.
2024 General Fund Expenditures by Departments
General Government: $24.8M, 11% Highways & Streets: $36.3M, 15%
Public Health: $19.7M, 8%

Total General Fund Sources: $229.1M
Property Tax: $85.0M, 37%
GENERAL FUND MAJOR IMPACTS
• $9.3M Wage and Benefit Adjustments
• $1.6M New Fulltime Positions (21) (Including 7 New Police Officers)
• $0.6M Part-time Wage Adjustments

• $1.4M Snow Removal Equipment Lease
• $1.4M Centralized Technology
• $0.9M Centralized Fleet
Sales Tax: $97.6M, 43%
Planning & Development: $15.5, 7% Transfers (Transit, Housing, Facilities): $10.7M, 5%
Other: $46.5M, 20%
• $0.8M Flood Control Mitigation (Grant Offset)
• $0.6M Public Safety Training Center Operations
• $0.5M Housing Fund Support
• $0.4M Street Teams and Network of Care
• $0.4M Zoo Operating Support
• $0.4M Asphalt for Road Repairs
• $0.4M Sidewalk Repair Program (75% revenue offset)
WHERE DOES THE CITY TAX REVENUE GO?
PAGE 11
Police: $52.4M, 22% Fire: $37.3M, 16% Culture & Recreation: (Parks & Library) $37.4M, 16%
PERCENTAGE OF POPULATION WITH A LIBRARY CARD ENGAGED
85% 26,000
STUDENTS WITH ENHANCED LEARNING OPPORTUNITIES THROUGH MORE THAN 100 INTERACTIVE EXHIBITS, PROGRAMS, AND TRIPS AT THE WASHINGTON PAVILION

8.0 40% TAKING CARE OF TODAY
ENSURING PUBLIC HEALTH THROUGH EFFICICENT EMS
RESPOND TO
90%
OF PRIORITY 1 CALLS IN 9:00 MINUTES
PAGE 12 FIRE RESPONSE TIME TRAVEL TO 90% OF EMERGENCY CALLS IN AVERAGE TRAVEL TIME
ON POLICE PRIORITY CALLS
9:33 MIN. 7:30
2021: 9:37 min. 2022: 9:44 min. 2023: 9:33 min. 2021: 7:47 min. 2022: 7:34 min. 2023: 7:30 min. Note: Total travel time includes dispatch, turnout and travel time KIDS & FAMILIES PERCENTAGE OF RESIDENTS RATING CITY PARKS AS GOOD OR EXCELLENT PERCENTAGE OF RESIDENTS RATING PARKS’ RECREATION PROGRAMS OR CLASSES AS GOOD OR EXCELLENT
2021: 88% 2022: N/AA 2023: 88% 2021: 80% 2022: N/AA 2023: 80% 2021: 39% 2022: 40% 2023: 42% 2021: 7.5 2022: 7.4 2023: 8.0 A—National Community Survey conducted every other year A—National Community Survey conducted every other year Note: Travel time includes call to dispatch and dispatch to arrival SAFETY & HEALTH
2024 LIBRARY
MIN.
90%
SERVICE OUTCOMES
CIRCULATION PER CAPITA
PAGE 13 2024 SERVICE OUTCOMES ACCESSIBLE HOUSING 288 600 TOTAL HOUSING UNITS PRODUCED, PRESERVED, OR REHABILITATED NUMBER OF HOUSEHOLDS WHO RECEIVE ASSISTANCE 2021: 266 2022: 161 2023: 288 2021: 330 2022: 652 2023: 600 SUSTAINABLE GROWTH 70.0 21 DAYS CONDITION RATING OF STREETS AVERAGE DAYS OF COMPLETION OF COMMERCIAL BUILDING PLANNING & DEVELOPMENT REVIEW 2015: 70 & 2020:70 Results will be released in 2024 2 DAYS (SCALE 1–100; LAST SURVEY COMPLETED IN 2019) (NATIONAL AVERAGE BETWEEN 60—65) 48 HOURS AVERAGE DAYS OF COMPLETION FOR RESIDENTIAL PLANNING & DEVELOPMENT REVIEW 19% 365 DAYS EFFICIENT SNOW REMOVAL SERVICES. TIME IT TAKES TO PLOW ALL THE STREETS AFTER A SNOW ALERT AS BEEN ISSUED. LANDFILL GARBAGE HAULER RECYCLING HAULING RATE DAYS PER YEAR DRINKING WATER DELIVERED TO CUSTOMERS AT ADEQUATE VOLUMES. 2021: >36 Hours 2022: >36 Hours 2023: 48 Hours 2021: 365 Days 2022: 365 Days 2023: 365 Days 2021: 21% 2022: 19% 2023: 19% 2021: 2 Days 2022: 2 Days 2023: 2 Days 2021: 33 Days 2022: 23 Days 2023: 21 Days FOR A BETTER TOMORROW
CAPITAL PROGRAM PROJECTS 2024
Projects subject to change due to available funding
Highways and Streets
• 6th Street: Foss Avenue to Veterans Parkway
• 49th Street: West Avenue to Grange Avenue
• 57th Street & Sundowner Avenue Intersection Improvements
• 85th Street & I-29 Intersection Improvements
• Arrowhead Parkway & Veterans Parkway Intersection Improvements
• Downtown Streetscape Maintenance
• Minnesota Ave: Phase 2 2nd Street to 7th Street
• North Drive & BNSF Railroad Bridge
• North Drive & Big Sioux River Bridge
• North Veterans Parkway Improvements
• Russell Street & Big Sioux River Bridge
• South Veterans Parkway: I-29 to Western
• Tallgrass Avenue: 85th Street to 271st Street
• Valley View Road: McGovern Middle School Area
• Various Railroad Crossing Improvements
• Various Traffic Signal Improvements

State Projects
• 85th Street & I-29 Interchange
• Arrowhead Parkway & Veterans Parkway Intersection
• Interstate I-29/I-229: From 85th Street to Louise Avenue Exit
• Railroad Crossing Improvements
• Veterans Parkway: Tallgrass Avenue to Western Avenue
Storm Drainage Projects
• Southwest Sioux Falls Phase 3
• Sump Pump Collection System
• Drainage Improvements in Existing Areas
• Drainage Improvements in Developing Areas
• Covell Area Basin Drainage Improvements
Power and Distribution
• Circuit Improvements
• Circuit 13 Project
• System Reconstruction
Water Projects
• Lewis & Clark Regional Water System Repayment
• City Wide Water Main Replacement Projects (Mesa Pass)
• Retrofit Cathodic Protection
• 38th & Bahnson Avenue Neighborhood
• Water Storage Improvements
• Water Purification Building Improvements
Water Reclamation Projects
• PS 240 Capacity Improvements
• Basin 15 Sanitary Sewer Extension
• Basin 18C Sanitary Sewer Extension
• Pump Station Improvements
• Southeast Basin Sanitary Sewer Improvements
• Sanitary Pipe Lining
• Sanitary Sewer—Other Mains
Parks and Recreation Projects
• Arrowhead Park House Renovation
• Big Sioux River Bike Trail Extension, Lien Park to Great Bear
• Community/Regional Park Improvements
• Cyclic Park Infrastructure Improvements
• Frank Olsen Pool Reconstruction & Renovation
• Kuehn Park Pool Reconstruction & Renovation
• Prairie Trail Park Improvements
• Great Plains Zoo Improvements: Generators
• Parks & Recreation System Master Plan
Other City Facilities
• Fire Stations 3, 9 Improvements
• Landfill: Buildings and Site Improvements

• Landfill: Leachate Recirculation/Gas Infrastructure
• Landfill Phase 1 Closure
• Landfill: Wetlands & Drainage Way Improvements
• Underground Storage Tanks
Entertainment Venues
• Convention Center Improvements
• Events Center Improvements
• Sioux Falls Stadium Improvements
• Washington Pavilion Improvements
• Orpheum Building Improvements

PAGE 14 PAGE 1 l CIP 2024–2028


PAGE 15
2024 CAPITAL PROGRAM PROJECTS
ECONOMIC PROFILE CITY OF SIOUX FALLS
POPULATION AND DEMOGRAPHICS
The City of Sioux Falls continues to see significant growth over the last 50 years as indicated by the data above. The estimated 2022 population of Sioux Falls is 208,900, growing by 3.1% from 2021.

The City grew in area, adding 1.96 square miles within its borders to equal 83.34 square miles total. The City has added 72 new and annexed centerline miles of roads, 12 miles of storm sewer, 17 miles of sanitary sewer, and 26 miles of water mains to its infrastructure (excluding construction-in-progress). Infrastructure and capital contributions added $114.0 million to the City’s capital assets in 2022.
Median Age: 34.2
The median age is the age at which 50% of the population are younger than this age and 50% are older.
Average Family Size: 2.4
The average family size is a measure obtained by dividing the number of people in a household by the number of households.
Education Levels: 93% of the population of Sioux Falls 25 years and older has a high school degree or greater, with 36% holding a bachelor’s degree or greater.
• Persons under 18 years old—32.6%
• Persons 19–64 years old—54.5%
• Persons over 65 years old—12.9%
QUALITY OF LIFE
#1 Most Affordable Places to Live & Work (GoodHire)
#2 Best Cities for Young Professionals (SmartAsset)
#8 MSA for Economic Strength (Policom)
#17 Best Run City in America (WalletHub)
#38 Best Places to Live (Livability)
Top 25 Best Places to Retire in 2022 (Forbes)
PAGE 16
11% 12% 24% 23% 24% 27% 21% 23% 0.0% 5.0% 10.0% 15.0% 20.0% 25.0% 30.0% 0 60,000 120,000 180,000 240,000 300,000 1970 1980 1990 2000 2010 2020 2030 Est. 2040 Est.
CITY OF SIOUX FALLS ECONOMIC PROFILE
UNEMPLOYMENT AND LABOR FORCE
As of May 2023, the City’s unemployment rate is 1.7% compared to the national unemployment rate of 3.4%.
2022 YE Unemployment Rates
1.9% Sioux Falls MSA 2.2% South Dakota 3.3% National Sioux Falls MSA Labor Force Growth (2013–2022) 14.9%

INCOME
$66,761 MEDIAN HOUSEHOLD INCOME
$85,908 MEDIAN FAMILY INCOME 733
BUILDING ACTIVITY
Median Income (2021 dollars):
The Sioux Falls median household income is $66,761 based on the 2021 American Community Survey 5-Year Estimates.
South Dakota tied for the fifth highest average resident FICO score at 733 in 2021 reported by Experian.
In 2022, Sioux Falls recorded total building permit valuations of $1.9B. This exceeded the previous record (2021) by 75%. Of this total, 81% was related to nonresidential construction.
PAGE 17
FICO SCORE
$205 $349 $282 $376 $408 $340 $345 $351 $286 $492 $869 $571 $491 $588 $620 $676 $702 $739 $787 $771 $920 $1,104 $1,105 $0 $400 $800 $1,200 $1,600 $2,000 2012 2013 2014 2015 2016 2017 2018 2019 2020 2021 2022 2023 Millions Through June Full Year
CITY OF SIOUX FALLS ECONOMIC PROFILE

Residential construction also continues to be strong as it tries to keep up with rapid growth. The City averaged 706 new single family homes, 408 townhomes/duplexes, and 1,665 multi-family units over the last five years.
INDUSTRY DIVERSIFICATION
Sioux Falls MSA has shown continued growth in non-farm employment over the past 10 years. The five-year growth is 7.7% and the 10-year growth is 19.7%
MAJOR EMPLOYERS
PAGE 18
DEPT. OF VETERAN AFFAIRS MEDICAL & REGIONAL OFFICE 1,214 CITY OF SIOUX FALLS 1,477 LIFESCAPE 1,081 WALMART/SAM’S CLUB 1,547 WELLS FARGO 2,035 SIOUX FALLS SCHOOL DISTRICT 49-5 3,688 AVERA HEALTH 7,888 SANFORD HEALTH 11,010 SMITHFIELD 3,400 HY-VEE FOOD STORES 2,806 CITI 1,400 FIRST PREMIER BANK PREMIER BANKCARD 1,158 2% 3% 4% 5% 7% 9% 9% 10% 9% 10% 12% 21% 0% 5% 10% 15% 20% 25% Information Transportation, Utilities, & Warehousing Other Services Wholesale Trade Natural Resources/Mining/Construction Manufacturing Total Government Leisure & Hospitality Financial Activities Professional & Business Services Retail Trade Education & Health Services 2022 Sioux Falls MSA Nonfarm Wage & Salaried Workers 2,022 1,642 2,717 3,132 4,384 1,403500 1,000 1,500 2,000 2,500 3,000 3,500 4,000 4,500 2018 2019 2020 2021 2022 2023 YTD (June) Residential Permits Single Family Multi-Family Townhome/Duplex
Prudent and Appropriate Reserves
The General Fund total unassigned and assigned fund balance, combined, was $82.8 million, an increase of $5.1 million. This increase was primarily due to higher than anticipated sales tax revenues, on-sale liquor licenses, and building permit growth. The City has a reserve policy target of that as of December 31 of each fiscal year equal to 25% to the total General Fund expenditure budget for that year.


Sales Tax Growth
First Penny sales tax collections, is the City’s largest revenue source. The City experienced a significant increase of sales tax collections in 2022, even after a large increase in 2021. This revenue source ensures the City is able to fund essential services and keep pace with infrastructure growth. As of December 31, 2022, the City’s sales tax growth rate was 12.2%. The 2024 Sales Tax estimate is built on a more conservative historical average of 4-5% for both 2023 projection and 2024.
Property Tax Growth
Property tax revenues is one of the major revenue sources to the primary operating account, the General Fund. This revenue is integral to supporting continued growth and keeping up with inflation.
Entertainment Tax Growth

The Entertainment Tax is derived primarily from a third penny tax on lodging, sales on alcoholic beverages, dining out, as well as ticket sales for entertainment related services. This tax can be seen as an indicator for the local economy as it primarily represents discretionary spending. The City is continuing to see strong collections after experiencing a rebound in 2021 from the COVID pandemic. Looking forward the City is anticipating a more normalized and conservative growth rate of 5% for both 2023 projection and 2024 budget.
Debt Position
The City borrows only for large capital infrastructure projects. City debt levels are both prudent and are substantially below the debt per capita position of regional peers. The City of Sioux Falls manages the repayment of its long-term debt which remains well below policy coverage targets of 50% of projected sales tax revenues. The 2024 Budget includes $15.6M of debt service payments supported by the 2nd penny sales tax.
PAGE 19
OF
CITY
SIOUX FALLS FINANCIAL PROFILE
2014 2015 2016 2017 2018 2019 2020 2021 2022 2023 Budget 2024 Budget Growth 4.3% 4.9% 2.1% 4.7% 3.0% 4.4% 3.2% 4.1% 2.8% 3.2% 4.0% CPI 2.1% 1.4% 1.5% 0.0% 1.0% 2.1% 2.4% 1.7% 1.2% 3.0% 3.0% 0.0% 1.0% 2.0% 3.0% 4.0% 5.0% 6.0% 7.0% 8.0% 2013 2014 2015 2016 2017 2018 2019 2020 2021 2022 2023 Proj. 2024 Budget Entertainment Tax $6,072 $6,418 $7,047 $7,449 $7,561 $7,824 $8,293 $7,164 $9,234 $10,571 $11,100 $11,655 % Increase 5.7% 5.7% 9.8% 5.7% 1.5% 3.5% 6.0% -13.6% 28.9% 14.5% 5.0% 5.0% $$2,000 $4,000 $6,000 $8,000 $10,000 $12,000 $45.8 32.3% $46.1 32.7% $43.5 28.9% $42.2 26.5% $46.7 29.4% $52.1 32.2% $55.7 32.4% $62.6 35.1% $77.7 37.5% $82.8 37.8% 0% 5% 10% 15% 20% 25% 30% 35% 40% 45% 2013 2014 2015 2016 2017 2018 2019 2020* 2021 2022 General Fund Total Unassigned and Assigned Fund Balance (in millions) Target 2013 2014 2015 2016 2017 2018 2019 2020 2021 2022 2023 Proj. 2024 Budget First Penny $51,697 $54,334 $57,428 $59,391 $60,087 $62,797 $66,921 $66,465 $79,281 $88,936 $93,383 $97,118 % Increase 7.9% 5.1% 5.7% 3.4% 1.2% 4.5% 6.6% -0.7% 19.3% 12.2% 5.0% 4.0% $$20,000 $40,000 $60,000 $80,000 $100,000 30.2% 26.0% 23.9% 20.1% 18.0% 17.1% 16.0% 19.8% 17.6% 16.3% 15.1% 8.0% $0 $20 $40 $60 $80 $100 $120 $140 2016 2018 2020 2021 2022 2023 2024 2025 2027 2029 2031 2033 Millions Total Sales Tax Revenue 50% Sales Tax Revenue Current & Projected Debt Service
2024 BUDGET BY DEPARTMENT

PAGE 20
MAYOR

OPERATING BUDGET BY CATEGORY
5 FULLTIME POSITIONS
OPERATING BUDGET IMPACTS
FULLTIME WAGES AND BENEFITS
$60,258 increase due to normal fulltime wage and benefit adjustments.
PART-TIME
$2,673 increase due to inflationary wage adjustments and adding hours for a potential summer internship.
0
PROFESSIONAL SERVICES
$1,160 increase due to inflationary adjustments for internal insurance charges and the Sioux 52 Mentorship Program in partnership with the HelpLine Center.
RENTALS
$228 decrease printer lease payments being classified as Lease Payments per government accounting rules.
STAINABLEGROWTH
KIDS&FAMILIES
INNOVATION
PAGE 21 GENERAL ADMINISTRATION
Personnel Operating Debt Service Capital $0.9M $ 0.8M $ 0.1M $ –$ –
S U
ENGAGING PEOPLE 2023 Budget 2024 Budget $ Change % Change Expenses Fulltime Wages & Benefits $767,354 $827,612 $60,258 7.9% Part-time 7,259 9,932 2,673 36.8% Overtime - - -Total Personnel 774,613 837,544 62,931 8.1% Professional Services 53,598 54,758 1,160 2.2% Rentals 11,237 11,009 (228) -2.0% Supplies & Materials 22,100 22,100 - 0.0% Training & Education 13,735 13,735 - 0.0% Utilities 1,620 1,620 - 0.0% Lease Payments - 1,650 1,650Total Other Operating 102,290 104,872 2,582 2.5% Total Operating Expenses $876,903 $942,416 $65,513 7.5%
CITY COUNCIL OPERATING BUDGET BY CATEGORY
OPERATING BUDGET IMPACTS
TOTAL PERSONNEL
$140,493 decrease is primarily due to the reallocation of internal auditing to an external professional services.
PROFESSIONAL SERVICES
$464,786 increase due to the bi-annual election costs and the reallocation of internal auditing to external professional services.
RENTALS
$9,373 increase due to a City-wide adjustment in internal technology rental charges for cyclic replacement, security, and network enhancements.
SUPPLIES AND TRAINING
$17,269 decrease due to budget to actual trends.
LEASE PAYMENTS
$2,860 being reclassified per government accounting rules as lease payments for multi-year operating expense contracts (printers, subscription software, rentals).

PAGE 22 GENERAL ADMINISTRATION
FULLTIME POSITIONS CITY COUNCIL MEMBERS 8 6 0 Personnel Operating Debt Service Capital $1.9M $ 1.0M $ 0.9m $ –$ –2023 Budget 2024 Budget $ Change % Change Expenses Fulltime Wages & Benefits $1,007,782 $851,665 $(156,117) -15.5% Part-time 175,096 190,720 15,624 8.9% Overtime 2,585 2,585 - 0.0% Total Personnel 1,185,463 1,044,970 (140,493) -11.9% Professional Services 185,465 650,251 464,786 250.6% Rentals 44,403 53,776 9,373 21.1% Supplies & Materials 90,500 89,700 (800) -0.9% Training & Education 150,247 133,778 (16,469) -11.0% Utilities 6,560 6,560 - 0.0% Lease Payments - 2,860 2,860Total Other Operating 477,175 936,925 459,750 96.3% Total Operating Expenses $1,662,638 $1,981,895 $319,257 19.2%
CITY ATTORNEY’S OFFICE
OPERATING BUDGET BY CATEGORY
OPERATING BUDGET IMPACTS
REVENUES
$481,000 decrease due to no new liquor licenses in even number years.
$100,000 increase in liquor tax revenue based on trends.
$43,000 increase in other alcohol licenses and renewals based on trends.
TOTAL PERSONNEL
$243,229 increase for normal fulltime wages and benefits adjustments.
18
0
FULLTIME POSITIONS
PROFESSIONAL SERVICES
$40,000 decrease for removal of unrealized third party DBE partnership contribution.
$776 increase due to inflationary adjustments for online records research and a City-wide adjustment in internal property liability and risk charges.
RENTALS
$26,452 increase due to a City-wide adjustment in internal technology rental charges for cyclic replacement, security, and network enhancements.
839 MAGISTRATE COURT CASES FOR CITY ORDINANCE VIOLATIONS

SUPPLIES & MATERIALS
$950 decrease in supplies & materials based on trends.
TRAINING
$1,635 increase for memberships & dues for new staff and other inflationary adjustments.
LEASE PAYMENTS
$2,880 being reclassified per government accounting rules as lease payments for multiyear operating expense contracts (printers, subscription software, rentals).
A) NUMBER OF CASES RESOLVED PRIOR TO TRIAL
B) NUMBER OF CASES PREPARED FOR TRIAL
275
PAGE 23 GENERAL ADMINISTRATION
AGREEMENTS
BY THE CITY ATTORNEY’S OFFICE
564
Personnel Operating Debt Service Capital $2.8M $ 2.3M $ 0.5M $ –$ –2023 Budget 2024 Budget $ Change % Change Revenues Taxes $13,500 $13,500 $ - 0.0% Licenses and Permits 977,894 539,450 (438,444) -44.8% Government Shared 1,012,646 1,112,600 99,954 9.9% Other (Charges, Miscellaneous) 600 600 - 0.0% Total Revenues $2,004,640 $1,666,150 $(338,490) -16.9% Expenses Fulltime Wages & Benefits $2,027,929 $2,271,158 $243,229 12.0% Part-time 54,100 54,100 - 0.0% Overtime - - -Total Personnel 2,082,029 2,325,258 243,229 11.7% Professional Services 169,472 130,248 (39,224) -23.1% Multi-Cultural Center Support 146,062 146,062 - 0.0% Rentals 86,381 109,203 22,822 26.4% Supplies & Materials 17,900 16,950 (950) -5.3% Training & Education 19,255 20,890 1,635 8.5% Utilities 62,525 62,650 125 0.2% Lease Payment - 2,880 2,880Total Other Operating 501,595 488,884 (12,711) -2.5% Total Operating Expenses $2,583,624 $2,814,141 $230,518 8.9%
MANAGED
1,125
OPERATIONS TEAM
OUR PURPOSE
The Operations Team, which includes Human Resources, Finance, Facilities Management, Communications, and Information Technology, supports all City departments in delivering strategic initiatives and ensure key operational issues are aligned for effective and efficient operations.
OUR FOCUS
ENSURE THE CITY CONTINUES TO BE AN EMPLOYER OF CHOICE BY DEVELOPING COMPREHENSIVE STRATEGIES IN EMPLOYEE RETENTION, WELLBEING, AND RECRUITMENT
SUSTAIN FINANCIAL STRENGTH, BALANCE, AND INTEGRITY TO SUPPORT DELIVERY OF DIVERSE AND HIGH-QUALITY SERVICES THAT MEET THE NEEDS OF A GROWING COMMUNITY THROUGH PROACTIVE AND COLLABORATIVE PLANNING, BUDGETING AND MODELING
COORDINATE AND LEAD A COLLABORATIVE APPROACH TO MAINTAINING AND SHARING SPACE IN CITY FACILITIES TO EFFICIENTLY AND EFFECTIVELY DELIVER PUBLIC SERVICES WHILE PROVIDING A POSITIVE WORKPLACE ENVIRONMENT
DELIVER TRANSPARENT, TIMELY, AND INFORMATIVE COMMUNICATION THROUGH MULTIPLE MARKETING CHANNELS FOR EMPLOYEES AND RESIDENTS, FOSTERING A STRONG SENSE OF COMMUNITY
MANAGE A RELIABLE AND REDUNDANT TECHNOLOGY NETWORK AND PROTECT THE CITY AGAINST CYBER THREATS
REALIZE EFFICIENCY AND DELIVER EFFECTIVE PUBLIC SERVICES THROUGH LEVERAGING THE USE OF TECHNOLOGY AND OPTIMIZING APPLICATION UTILIZATION
LEAN INTO A CITY-WIDE DATA FORWARD STRATEGY BY COLLECTING AND ANALYZING INFORMATION TO ASSIST IN MAKING DECISIONS, SHAPE POLICY, UNDERSTAND CHALLENGES, PURSUE SOLUTIONS, EVALUATE PROGRESS, AND OPTIMIZE THE USE OF LIMITED RESOURCES

PAGE 24 OPERATIONS TEAM
Human Resources Finance General Facilities Information & Technology Communications $19.8M $ 2.4M $ 4.3M $ 2.9M $ 6.9M $ 3.3M
$2.4M
HUMAN RESOURCES
OPERATING BUDGET BY CATEGORY
OPERATING BUDGET IMPACTS
TOTAL PERSONNEL
$68,400 increase due to normal fulltime wage and benefit adjustment and the addition of one Payroll and Benefit Specialist.
PROFESSIONAL SERVICES
$100,000 decrease due to completion of compensation and benefit study.
$34,400 increase for recruitment strategy implementation and recruitment services.
RENTALS
$10,000 increase due to a City-wide adjustment in internal technology rental charges for cyclic replacement, security, and network enhancements.
224 NEW HIRES AND PROMOTIONS
SUPPLIES & MATERIALS
15,000 increase due to employee development software, the expense is being reclassified per government accounting rules as lease payments for multi-year operating expense contracts, resulting in 0 increase for supplies and materials category.

TRAINING & EDUCATION
$3,200 decrease primarily for membership dues, subscriptions and publications.
LEASE PAYMENTS
$18,500 being reclassified from per government accounting rules as lease payments for multi-year operating expense contracts (printers, subscription software, rentals).
FULLTIME POSITIONS
18
1
TURNOVER RATE 5.9% 9.3% W/ RETIREMENTS W/O RETIREMENTS
IN 2022
65 FTE PER 10,000 POPULATION IN 2022 IN 2022
56,205 PAYROLL STATEMENTS
PAGE 25 OPERATIONS TEAM
Personnel Operating Debt Service Capital
$ 1.6M $ 0.8M $ –$ –
2023 Budget 2024 Budget $ Change % Change Expenses Fulltime Wages & Benefits $1,509,941 $1,578,319 $68,378 4.5% Part-time 17,000 17,000 - 0.0% Total Personnel 1,526,941 1,595,319 68,378 4.5% Professional Services 595,527 529,927 (65,600) -11.0% Rentals 50,548 60,528 9,980 19.7% Supplies & Materials 165,970 165,970 - 0.0% Training & Education 17,300 14,105 (3,195) -18.5% Utilities 2,160 2,160 - 0.0% Lease Payments - 18,548 18,548Total Other Operating 831,505 791,238 (40,267) -4.8% Total Operating Expenses $2,358,446 $2,386,556 $28,110 1.2%
FINANCE OPERATING BUDGET BY CATEGORY
OPERATING BUDGET IMPACTS
FULLTIME WAGES & BENEFITS
$524,770 increase due to normal fulltime wage and benefit adjustments and the addition of one new finance coordinator position.
PART-TIME
$15,283 increase due to inflationary wage adjustments and adding hours for the ascend internship program.
PROFESSIONAL SERVICES
$8,708 decrease due reallocating budget to Supplies and Materials for new software related to GASB Leases.
RENTALS
$34,469 increase due to a City-wide adjustment in internal technology rental charges for cyclic replacement and security.
SUPPLIES AND MATERIALS
$15,000 increase for new software related to GASB Leases partially offset by reallocating budget from professional services.
UTILITIES
$1,000 increase based on budget to actual trends for mobile network access.
LEASE PAYMENTS
$1,430 being reclassified from per government accounting rules as lease payments for multiyear commitments of operating expenses (printers, subscription software, rentals).
32 FULLTIME POSITIONS 1
AUDITED FINANCIAL STATEMENTS WITHIN 90 DAYS OF YEAR-END

GENERAL FUND RESERVE TARGET 25.0%
OR BETTER REVENUE TO DEBT SERVICE WITHIN THE SALES TAX FUND.
MANAGE OVER
2.0 $2.6 BILLION IN ASSETS
PAGE 26 OPERATIONS TEAM
TIMES
Personnel Operating Debt Service Capital $4.3M $ 4.0M $ 0.3M $ –$ –2023 Budget 2024 Budget $ Change % Change Expenses Fulltime Wages & Benefits $3,417,543 $3,942,313 $524,770 15.4% Part-time 88,416 103,699 15,283 17.3% Overtime 5,000 5,000 - 0.0% Total Personnel 3,510,959 4,051,012 540,053 15.4% Professional Services 98,644 89,936 (8,708) -8.8% Rentals 114,916 148,385 33,469 29.1% Supplies & Materials 11,000 26,000 15,000 136.4% Training & Education 30,530 30,530 - 0.0% Utilities 5,400 6,400 1,000 18.5% Lease Payments - 1,430 1,430Total Other Operating 260,490 302,681 42,191 16.2% Total Operating Expenses $3,771,449 $4,353,693 $582,244 15.4%
GENERAL FACILITIES OPERATING BUDGET BY CATEGORY
OPERATING BUDGET IMPACTS
REVENUES
$500,000 decrease based on projected use of grant funding for Link facility expenses.
WAGES & BENEFITS
$103,000 increase in Centralized Facilities charges based on normal fulltime wages & benefits adjustments.
PROFESSIONAL SERVICES
$7,963 increase due to a City-wide adjustment in internal property liability and risk charges.
GENERAL GOVERNMENT BUILDINGS

REPAIR & MAINTENANCE
$500,000 decrease based on projected use of grant funding for Link facility expenses.
$10,000 increase in Centralized Facilities charges based on forecasted maintenance and projects.
UTILITIES
$35,000 increase in Centralized Facilities charges based on forecasted utility expenses.

PAGE 27 OPERATIONS TEAM
Personnel Operating Debt Service Capital $2.9M $ 1.0m $ 1.3m $ –$ 0.6M Sources 2nd Penny Sales Tax TOTAL CAPITAL SOURCES Projects Land Acquisition TOTAL CAPITAL PROGRAM 2024 Budget CAPITAL PROGRAM $560,000 $560,000 560,000 $560,000 CITY HALL CARNEGIE CITY CENTER ANNEX (THE LINK) GRAYBAR 2023 Budget 2024 Budget $ Change % Change Revenues State Grant (The Link) $700,000 $200,000 $(500,000) -71.4% Total Revenues $700,000 $200,000 $(500,000) -71.4% Expenses Fulltime Wages & Benefits $912,000 $1,015,000 $103,000 11.3% Part-time - - -Overtime - - -Total Personnel 912,000 1,015,000 103,000 11.3% Professional Services 79,635 87,598 7,963 10.0% Rentals 193,000 193,000 - 0.0% Repair & Maintenance 1,037,000 547,000 (490,000) -47.3% Supplies & Materials 112,000 112,000 - 0.0% Utilities 320,000 355,000 35,000 10.9% Total Other Operating 1,741,635 1,294,598 (447,037) -25.7% Total Operating Expenses $2,653,635 $2,309,598 $(344,037) -13.0%
INNOVATION AND TECHNOLOGY
BUDGET BY CATEGORY
OPERATING BUDGET IMPACTS
FULLTIME WAGES
$801,246 increase is due to normal wage and benefits adjustments and 4 new positions to support new initiatives.
PART-TIME
$20,008 decrease is an adjustment for technology support across the department.
PROFESSIONAL SERVICES
$145,469 decrease is due a reduction in special initiatives driven by other priorities.
RENTALS
$101,555 increase due to a City-wide adjustment in internal technology rental charges for cyclic replacement, security and network enhancements.

SUPPLIES & MATERIALS
$113,524 decrease is due to software analysis and alignment resulting in a shift to enterprise sources.
TRAINING & EDUCATION
$10,000 increase is due to certifications and trainings to support initiatives and critical cross training.
UTILITIES
$22,964 decrease due to lower internet cost from finished projects.
LEASE PAYMENTS
$2,000 being reclassified per government accounting rules as lease payments versus rental expenses. These payments are for printer lease agreements. Overall, no impact to budget.
POSITIONS
4
MAINTAINED IN 2022
PAGE 28 OPERATIONS TEAM
47 FULLTIME
CITY FEATURES AND ASSETS
5.5M+
Personnel Operating Debt Service Capital $6.9M $ 5.6m $ 1.3m $ –$ –2023 Budget 2024 Budget $ Change % Change Expenses Fulltime Wages & Benefits $4,594,219 $5,415,473 $821,254 17.9% Part-time 180,248 160,240 (20,008) -11.1% Overtime 3,053 3,053 - 0.0% Total Personnel 4,777,520 5,578,766 801,246 16.8% Professional Services 572,654 427,185 (145,469) -25.4% Rentals 318,488 420,043 101,555 31.9% Repair & Maintenance 72,500 72,500 - 0.0% Supplies & Materials 285,481 171,957 (113,524) -39.8% Training & Education 90,094 100,094 10,000 11.1% Utilities 104,544 81,580 (22,964) -22.0% Lease Payments - 2,000 2,000Total Other Operating 1,443,761 1,275,359 (168,402) -11.7% Total Operating Expenses $6,221,281 $6,854,125 $632,844 10.2%
2,000+ DEVICES MANAGED IN 2022
COMMUNICATIONS
BUDGET BY CATEGORY
OPERATING BUDGET IMPACTS
FULLTIME WAGES AND BENEFITS
$125,719 increase is due to normal wage and benefits adjustments.
PROFESSIONAL SERVICES
$175,000 increase is for various city-wide communication programs through multiple platforms.
RENTALS
$16,052 increase due to a City-wide adjustment in internal technology rental charges for cyclic replacement, security and network enhancements.

SUPPLIES & MATERIALS
$25,035 increase is primarily due to materials for public education of various city-wide initiatives.
TRAINING
$4,000 increase is for updated training based on changes in position realignment.
LEASE PAYMENT
$5,900 being reclassified per government accounting rules as lease payments versus rental expenses. These payments are for printer lease agreements. Overall, no impact to budget.
IMPRESSIONS SERVED IN 2022 24.2M
POSITIONS
21
Sources
PAGE 29 OPERATIONS TEAM
FULLTIME
2nd Penny Sales Tax TOTAL CAPITAL SOURCES Equipment CityLink Equipment TOTAL CAPITAL PROGRAM 2024
160,000 $160,000 160,000 $160,000
PROGRAM
Budget
CAPITAL
0 Personnel Operating Debt Service Capital $3.3M $ 2.4m $ 0.8m $ –$ 0.2m 2023 Budget 2024 Budget $ Change % Change Revenues Cable Franchise Fee $200,000 $200,000 $ - 0.0% Total Revenues $200,000 $200,000 $ - 0.0% Expenses Fulltime Wages & Benefits $2,146,876 $2,272,595 $125,719 5.9% Part-time 88,216 88,216 - 0.0% Overtime 6,500 6,500 - 0.0% Total Personnel 2,241,592 2,367,311 125,719 5.6% Professional Services 400,553 575,553 175,000 43.7% Rentals 80,556 96,608 16,052 19.9% Repair & Maintenance 23,301 23,301 - 0.0% Supplies & Materials 49,421 74,456 25,035 50.7% Training & Education 11,044 15,044 4,000 36.2% Utilities 5,535 5,535 - 0.0% Lease Payments - 5,900 5,900Total Other Operating 570,410 796,397 225,987 39.6% Total Operating Expenses $2,812,002 $3,163,708 $351,706 12.5%
Intentionally Left Blank
PAGE 30
FIRE
OUR PURPOSE
$40.4M $ 31.8m $ 5.5m $ –$ 3.1M
Personnel Operating Debt Service Capital
Sioux Falls Fire Rescue is committed to protecting the people and property of our community. Through public education, inspection, code enforcement, and fire investigation, SFFR provides a full range of services, while fostering a culture of community risk reduction. If you have experienced or witness a traumatic event such as a car crash, medical emergency, fire, or rescue, you have seen first-hand the professionalism and expertise of those who serve with Sioux Falls Fire Rescue.

OUR FOCUS
INVEST IN TRAINING AND GROWTH IN EMPLOYEE HEALTH INITIATIVES
INVEST IN CURRENT FACILITIES BY REPAIRING AND REMODELING FIRE STATIONS TO KEEP UP WITH 24/7/365 UTILIZATION
WORK WITH THE SIOUX FALLS POLICE DEPARTMENT AND METRO 911 ON THE FIRST FULL YEAR OF PUBLIC SAFETY CAMPUS OPERATIONS
WORK WITH COMMUNITY AND REGIONAL PARTNERS TO MITIGATE AND PREVENT LOSS THROUGH RISK REDUCTION EFFORTS
This will be accomplished by investing time, energy, and money into firefighter health and wellness initiatives, constructing an additional fire station in 2026-2027, and continuing to build relationships with community partners through education,and programs to keep residents safe from preventable incidents.
PAGE 31 PUBLIC SAFETY
FIRE OPERATING BUDGET BY CATEGORY
$376.6M
VALUE OF PROPERTY SAVED AFTER FIRE EXPOSURE (98.4%)
90% OF PRIORITY EMERGENCY CALLS HAVE A TOTAL RESPONSE TIME OF 9:33
CARDIAC ARREST LIVES SAVED 20
OPERATING BUDGET IMPACTS
REVENUES
$120,000 increase in expected Fire Insurance Premium Reversion based on trends.
$30,000 increase in licenses and permit fees based on trends.
$25,000 increase for offsetting contributions for purchases of smoke alarms.

TOTAL PERSONNEL
$2,176,707 increase for normal fulltime wages and benefits adjustments and the addition of one Fire Training Captain.
PROFESSIONAL SERVICES
$18,000 increase for annual physicals, testing, and wellness services.
$17,000 increase due to a City-wide adjustment in internal property liability and risk charges.
RENTALS
$172,000 increase due to a City-wide adjustment in internal technology rental charges for cyclic replacement, security, and network enhancements.
REPAIR & MAINTENANCE
$80,000 increase for service and maintenance of new fire training prop.
$61,000 increase due to centralized facilities charges for ongoing facilities improvements.
$37,000 increase due to to adjustments and cost increases for SCBA equipment, EMS equipment, PPE, and radios.
SUPPLIES & MATERIALS
$125,000 increase due to adjustments and cost increases, including for fire hose, EMS supplies, PPE, emergency response equipment, and miscellaneous supplies.
$32,000 increase for software & analytics, particularly for exposure tracking & injury/ loss prevention.
$35,000 increase for smoke alarms.
$10,000 for medical vault replacements.
$10,000 Increase in centralized facilities supplies charges for the opening of the new public safety center.
TRAINING
$46,000 increase for certifications, training materials, and classes.
UTILITIES
$230,000 increase in centralized facilities charges for utilities for normal inflationary impacts and the opening of the new Public Safety Center.
LEASE PAYMENTS
$10,591 being reclassified per government accounting rules as lease payments for multiyear operating expense contracts (printers, subscription software, rentals).
PAGE 32 PUBLIC
SAFETY
2023 Budget 2024 Budget $ Change % Change Revenues Government Shared $863,000 $983,000 $120,000 13.9% Charges 790,600 820,600 30,000 3.8% Contributions - 25,000 25,000Total Revenues $1,653,600 $1,828,600 $175,000 10.6% Expenses Fulltime Wages & Benefits $27,823,470 $30,000,177 $2,176,707 7.8% Part-time 123,760 123,760 - 0.0% Overtime 1,690,000 1,690,000 - 0.0% Total Personnel 29,637,230 31,813,937 2,176,707 7.3% Professional Services 512,747 564,262 51,515 10.0% Rentals 561,725 720,280 158,556 28.2% Repair & Maintenance 1,591,014 1,769,100 178,086 11.2% Supplies & Materials 1,334,594 1,546,631 212,037 15.9% Training & Education 266,300 311,890 45,590 17.1% Utilities 300,820 530,820 230,000 76.5% Lease Payment - 10,591 10,591Total Other Operating 4,567,200 5,453,574 886,375 19.4% Total Operating Expenses $34,204,430 $37,267,511 $3,063,082 9.0%
OPERATING BUDGET BY PROGRAM
NUMBER OF ANNUAL COMMERCIAL INSPECTIONS:
5,286 12 FIRE STATIONS
SAVING LIVES AND PROTECTING PROPERTY


PAGE 33 PUBLIC SAFETY Fire Service 32,214,581 Fire Prevention 2,623,457 Emergency Preparedness 542,212 Centralized Facilities 1,887,262 Total Operating Budget by Program $37,267,511 FULLTIME POSITIONS 229 KEY STATISTICS 2022 Total Response Time for 90% of Priority Emergency Calls 9:44 Total Fire Incidents 345 Total Nonfire Incidents 15,209 Medical 8,045 False Alarms 2,009 Mutual Aid 68 Hazardous Materials 218 Other Hazardous Responses 454 Other Responses 4,415 Sources 2nd Penny Sales Tax Grant TOTAL CAPITAL SOURCES Equipment Fire Engines (2) Other Vehicles CPR Devices (12) HazMat Equipment Air Compressor Patient Care Simulator Manikins Helmet Washer EMS Equipment Radios Other Equipment TOTAL CAPITAL EQUIPMENT TOTAL CAPITAL PROGRAM 2024 Budget CAPITAL
3,023,000 104,000 $3,127,000 1,925,000 325,000 265,500 169,000 65,000 175,000 35,000 59,000 36,500 72,000 $3,127,000 $3,127,000 2024 Budget
PROGRAM
Intentionally Left Blank
PAGE 34
POLICE
$53.9M
OUR PURPOSE
The Sioux Falls Police Department serves, protects, and promotes the quality of life in the City. Officer training emphasizes a public servant mindset with a strong understanding of and commitment to justice. The department’s primary role is to enforce the law, maintain order, and prevent crime through community-oriented policing, which establishes collaborative partnerships among law enforcement and the individuals and organizations they serve.

OUR FOCUS
PROTECTION OF HUMAN LIFE AND RESIDENT PROPERTY, LAW ENFORCEMENT, CRIME PREVENTION, AND COMMUNITY CARETAKING
ENSURE OUR CURRENT AND FUTURE WORKFORCE MEETS THE PUBLIC SAFETY EXPECTATIONS OF CITIZENS WHILE MAINTAINING OFFICERS’ WORK-LIFE BALANCE
COLLABORATION WITH SIOUX FALLS FIRE RESCUE AND METRO 911 ON THE PUBLIC SAFETY CAMPUS OPERATIONS
CONTINUE TO FOSTER RELATIONSHIPS AND TRUST WITH OUR COMMUNITY YOUTH COORDINATE HOMELESSNESS OUTREACH AND COMMUNITY POLICING TO OFFER HELP WHERE NEEDED, FOSTER RELATIONSHIPS, AND REDUCE THE NEED FOR FUTURE ENFORCEMENT. ENSURE THE SAFETY OF OUR POLICE OFFICERS BY PROVIDING CONTINUING TRAINING, ADEQUATE EQUIPMENT, AND RELIABLE VIDEO TECHNOLOGY
To meet this vision, the 2024 budget includes the addition of seven police officers to the department, planning for additional report-to-work stations throughout the city, and developing innovative ways to connect with Sioux Falls residents.
PAGE 35 PUBLIC SAFETY
Personnel Operating Debt Service Capital
$ 43.3m $ 9.2m $ –$ 1.4M
POLICE
OPERATING BUDGET BY CATEGORY
OPERATING BUDGET IMPACTS
REVENUES
$114,150 decrease due to completed and expiring grants.
TOTAL PERSONNEL
$3,940,995 increase due to normal fulltime wage & benefit adjustments and the addition of seven new Police Officers.
$22,500 increase in training officer overtime.
PROFESSIONAL SERVICES
$2,145,000 decrease due to completion of one-time contribution to Metro Communications for purchase of equipment at the new Public Safety Answering Point.
$167,505 increase for the City’s annual contribution to Metro Communications due to growth and demand for services.
$39,000 increase for the City’s contribution to Children’s Inn based on demand for services.
$42,000 increase due to a City-wide adjustment in internal property liability and risk charges.
RENTALS
$334,776 increase due to a City-wide adjustment in internal technology rental charges for cyclic replacement, security, and network enhancements.
$28,000 increase due to cost escalation for outside vehicle rentals.
REPAIR & MAINTENANCE
$11,550 increase due to inflationary adjustments.
SUPPLIES & MATERIALS
$80,000 decrease due to completed and expiring grants.
$111,000 increase for portable radio and other communication equipment replacements.
$75,000 increase for new and replacement armor.
$42,000 increase for firearm replacements.
$42,000 increase due to various adjustments and cost increases, including for uniforms, PPE, and equipment.
$34,000 increase for ammunition.
$15,000 increase for new software.
TRAINING
$9,500 increase due to inflationary adjustments and new training materials.
UTILITIES
$7,000 increase due to growth in mobile data usage.
LEASE PAYMENTS
$15,904 being reclassified per government accounting rules as lease payments for multi-year operating expense contracts (printers, subscription software, rentals).
PAGE 36 PUBLIC SAFETY
2023 Budget 2024 Budget $ Change % Change Revenues Government Shared $1,721,650 $1,607,500 $(114,150) -6.6% Charges 150,500 150,500 - 0.0% Licenses & Permits 50,000 50,000 - 0.0% Other (Contributions, Rentals) 40,000 40,000 - 0.0% Total Revenues $1,962,150 $1,848,000 $(114,150) -5.8% Expenses Fulltime Wages & Benefits $37,799,195 $41,740,190 $3,940,995 10.4% Part-time 259,004 259,004 - 0.0% Overtime 1,230,500 1,253,000 22,500 1.8% Total Personnel 39,288,699 43,252,194 3,963,495 10.1% Professional Services 1,418,823 1,520,486 101,663 7.2% Metro Communications 4,238,815 2,261,320 (1,977,495) -46.7% Rentals 1,364,760 1,710,068 345,308 25.3% Repair & Maintenance 979,125 990,675 11,550 1.2% Supplies & Materials 1,799,063 2,038,338 239,275 13.3% Training & Education 250,500 260,000 9,500 3.8% Utilities 382,530 389,500 6,970 1.8% Lease Payment - 15,904 15,904Total Other Operating 10,433,616 9,186,291 (1,247,325) -12.0% Total Operating Expenses $49,722,315 $52,438,485 $2,716,170 5.5%

PAGE 37 PUBLIC SAFETY Uniformed Services 39,612,601 Investigations 5,823,976 Crime Lab 1,404,918 Centralized Facilities 917,361 Metro Communications 2,261,320 Animal Control 1,327,492 Records 1,090,817 Total Operating Budget by Program $52,438,485 FULLTIME POSITIONS 333 7 Sources 2nd Penny Sales Tax Grant TOTAL CAPITAL SOURCES Equipment Patrol Vehicles Radios Multi Spectral Camera (Grant) GPS Control Equipment Motorcycles K-9 Dog TOTAL CAPITAL PROGRAM 2024 Budget CAPITAL PROGRAM 1,361,100 83,000 $1,444,100 1,260,000 38,500 83,000 8,600 36,000 18,000 $1,444,100 2024 Budget OPERATING BUDGET BY PROGRAM AVERAGE RESPONSE TIME ON PRIORITY CALLS 7:30 MAINTAIN OR REDUCE RATIO OF INJURY PRODUCING TRAFFIC ACCIDENTS (PER 1,000) 6.0 KEY STATISTICS 2022 Civilian Employees 37 Residents Who Felt Safe in Their Neighborhoods 93% Average Response Time on Priority Calls 7:34 Part 1 Violent Crimes Clearance Rate 74% Part 1 Property Crimes Clearance Rate 40% Traffic Citations Issued 23,015 Police Calls 127,089 as of last National Citizen Survey (2021) 295 SWORN OFFICERS
Intentionally Left Blank
PAGE 38
HIGHWAYS AND STREETS
OUR PURPOSE
$145.8M $ 15.5M $ 20.8M $ –$ 109.5M
Personnel Operating Debt Service Capital
Public Works is responsible for the long-range planning, design, construction, and maintenance of our roads to assure an efficient, reliable and safe transportation network. Highways and Streets includes engineering, street maintenance, and traffic and lighting, a dedicated team that oversees some of the most challenging and impactful work in our city.

OUR FOCUS
DELIBERATE PLANNING FOR DEVELOPMENT AND GROWTH OF THE CITY, WHILE MAINTAINING EXISTING STREET AND UTILITY INFRASTRUCTURE
CONTINUED INVESTMENT IN REHABILITATION AND RECONSTRUCTION, WITH THE GOAL OF MAINTAINING AN “ABOVE AVERAGE” PAVEMENT CONDITION SCORE WHEN COMPARED TO OTHER NORTHERN CLIMATE MUNICIPALITIES
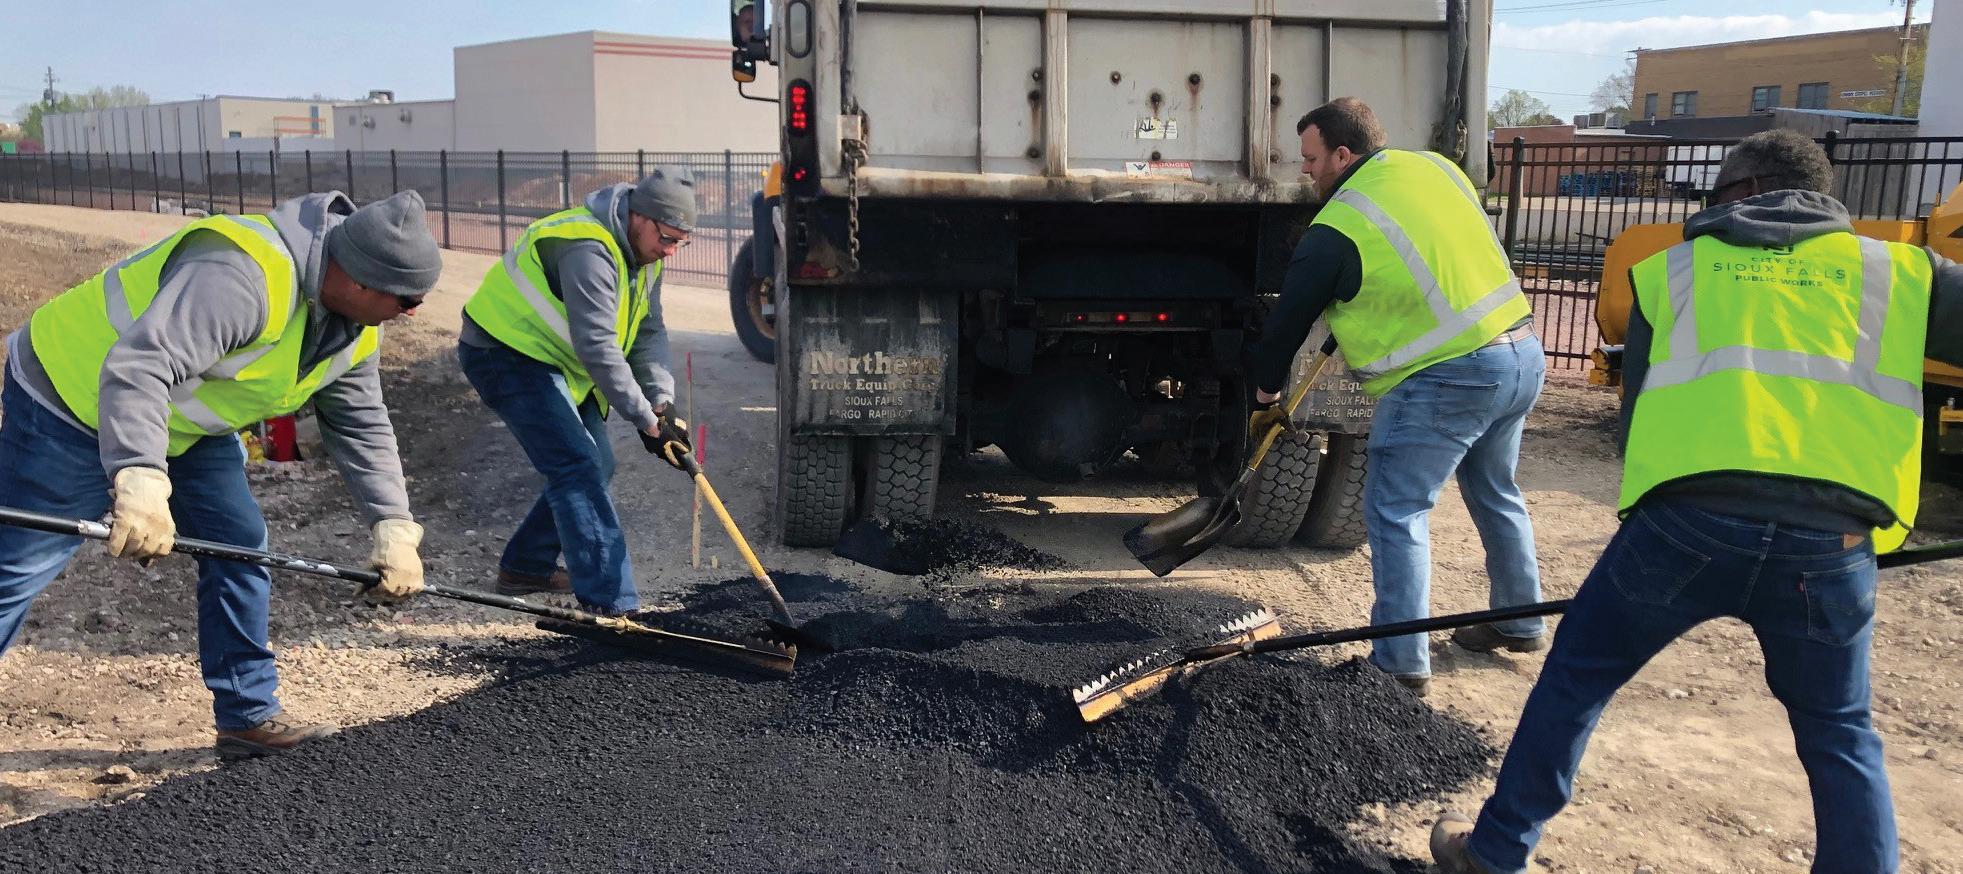
CONTINUED DEVELOPMENT OF THE SPOT ASPHALT REPAIR PROGRAM TO REDUCE POTHOLE NUMBERS AND IMPROVE STREET CONDITIONS OVERALL
EFFICIENT AND EFFECTIVE SNOW AND ICE REMOVAL SERVICES BY UTILIZING TECHNOLOGY TO FOSTER BEST PRACTICE APPLICATION PROCESSES AND REDUCE COSTS, LESSEN NEGATIVE ENVIRONMENTAL IMPACTS, AND ASSURE OPTIMAL LIFE OF STREETS
CONTINUE INVESTING IN THE LED STREET LIGHT CONVERSION AND POLE IMPROVEMENTS PROGRAM TO SUPPORT SAFE STREETS AND REDUCE ELECTRIC COSTS
INVEST IN ADAPTIVE TRAFFIC SYSTEMS AND MAINTENANCE PROGRAMS TO ENSURE A RELIABLE AND EFFICIENT TRAFFIC CONTROLS SYSTEM
PAGE 39 HIGHWAYS & STREETS
HIGHWAYS AND STREETS OPERATING BUDGET BY CATEGORY
OPERATING BUDGET IMPACTS
REVENUE (CHARGES)
$35,070 increase in License and Permits to align with actuals.
$677,440 increase in Charges for the reimbursement of expenses associated with the City repairing private sidewalks.
TOTAL PERSONNEL
$949,818 increase due to normal fulltime wage and benefit adjustments and the addition of one equipment operator.
PROFESSIONAL SERVICES
$92,350 decrease primarily for the pavement data survey being complete in fall of 2023.
RENTALS
$165,866 increase due to a City-wide adjustment in internal technology rental charges for cyclic replacement, security, and network enhancements.
$518,825 increase in internal fleet charges and seasonal equipment rental based on the needs of the department.
$1,010,009 decrease in rental equipment being reclassified as lease payment verse rental expenses.
REPAIR & MAINTENANCE
$265,986 increase for fleet equipment repairs.
$368,394 increase for additional asphalt for street maintenance repairs.
$109,140 increase in traffic signals, striping and street light maintenance due to anticipated price escalation.
$422,750 increase primarily related to expenses associated with the City repairing private sidewalks. This expense is offset with revenues.
SUPPLIES & MATERIALS
$203,562 decrease in road salt to align with actual usage and greater operational efficiency.
TRAINING
$1,135 increase in training for CDL certification training.
UTILITIES
$231,651 decrease primarily for street light electricity due to LED change outs and to align with actual trends.
LEASE PAYMENTS
$2,425,408 being reclassified per government accounting rules as lease payments versus rental expenses. These payments are for motor grader and front-end loader lease agreements to provide effective snow removal services for the city. Overall motor grader and front-end lease expenses are up $1.4M in 2024.
PAGE 40 HIGHWAYS & STREETS
TIME IT TAKES TO PLOW ALL STREETS AFTER A SNOW ALERT HAS BEEN ISSUED EFFICIENT SNOW REMOVAL SERVICES AN ABOVE AVERAGE STREET OVERALL CONDITION INDEX RATING (1-100 SCALE, 100 BEING A NEW STREET) (NATIONAL AVERAGE= BETWEEN 60-65) 70.0 TONS OF ASPHALT PREPARED TO REPAIR AND MAINTAIN THE STREETS 10,000 2023 Budget 2024 Budget $ Change % Change Revenues Street Frontage Tax $5,095,697 $5,095,697 $ - 0.0% License and Permits 179,030 214,100 35,070 19.6% Motor Vehicle Licenses & Wheel Tax 3,451,759 3,451,759 - 0.0% Federal Grants 779,000 779,000 - 0.0% Charges 1,064,140 1,741,580 677,440 63.7% Miscellaneous 100,000 100,000 - 0.0% Total Revenues $10,669,626 $11,382,136 $712,510 6.7% Expenses Fulltime Wages & Benefits $13,201,759 $14,151,577 $949,818 7.2% Part-time 893,883 893,883 - 0.0% Overtime 497,000 497,000 - 0.0% Total Personnel 14,592,642 15,542,460 949,818 6.5% Professional Services 1,936,075 1,843,725 (92,350) -4.8% Rentals 4,348,937 4,020,579 (328,358) -7.6% Repair & Maintenance 5,859,071 7,025,341 1,166,270 19.9% Supplies & Materials 3,604,335 3,400,773 (203,562) -5.6% Training & Education 67,994 69,129 1,135 1.7% Utilities 2,250,085 2,018,434 (231,651) -10.3% Lease Payments - 2,425,408 2,425,408Total Other Operating 18,066,496 20,803,389 2,736,893 15.1% Total Operating Expenses $32,659,137 $36,345,849 $3,686,711 11.3%
<48 HRS
OPERATING BUDGET BY PROGRAM


PAGE 41 HIGHWAYS & STREETS 2024 Budget Street Winter 11,694,363 Street Maintenance 8,701,778 Engineering 8,423,210 Lights, Signs, & Signals 7,043,498 Centralized Facilities 483,000 Total Operating Budget by Program $36,345,849
Sources 2nd Penny Sales Tax State Contributions and Grants Other Contributions Platting Fees TOTAL CAPITAL SOURCES Projects Arterial Street/Intersections Maintenance and Rehab Major Street Reconstruction Downtown Improvements Bridge Rehab/Replacement Other Public Works Projects Salt Storage Facility SDDOT Project Coordination TOTAL CAPITAL PROJECTS Equipment Arrowboards Asphalt Equipment Equipment Attachments GPS Collector Systems Traffic Control Equipment TOTAL CAPITAL EQUIPMENT TOTAL CAPITAL PROGRAM 2024 Budget CAPITAL
59,267,845 45,025,000 2,000,000 3,210,000 $109,502,845 16,761,761 17,221,600 8,294,484 1,725,000 19,900,000 9,545,000 1,000,000 34,725,000 $109,172,845 20,000 155,000 25,000 30,000 100,000 $330,000 $109,502,845 122 FULLTIME POSITIONS 1 KEY STATISTICS 2022 Front Footage 5,226,063 Lane Mileage 3,436 Pothole Requests 1,946 Crack Sealing Blocks 247 Surface Treatment Blocks 390 Mill and Overlay Blocks 209 Sweeping Events 3 Snow Alerts 2 Snow Fall (Inches) 20.0 Traffic Counts 617 Traffic Studies and Signal Enhancers 4 78% % OF LIGHTS SWITCHED TO LED (REDUCED POWER CONSUMPTION) 22,511 3% % OF EMBEDDED POLES REPLACED NUMBER OF STREET LIGHTS MAINTAINED 20,000 BUDGE TED IN 2024 PREPARED TO REPAIR MORE THAN MA JOR 10,000 POTHOLES 8.1 BILLION 3.1 MILES OVER 1,000 BLOCKS OF STREET PRESERVATION, REHABILITATION, AND RECONSTRUCTION IN 2024 IN 2022
PROGRAM
STORM DRAINAGE
OUR PURPOSE
The city’s storm drainage department works to protect Sioux Falls by managing the systems that collect, hold, and release storm water at a controlled rate. The storm drainage system is made up of 1,300 acres of land, 200 miles of drainage ways, 520 miles of storm drainage pipe, and 13,000 storm water inlets. This infrastructure and the Big Sioux River levee flood-control system play key roles in managing water during storms or river flooding.

OUR FOCUS
DELIVERING EXCEPTIONAL AND RELIABLE SERVICE TO MEET CURRENT AND FUTURE GROWTH DEMANDS SUPPORTED SOLELY BY USER FEES
SAFEGUARD PRIVATE PROPERTY BY PROTECTING THE INTEGRITY OF THE BIG SIOUX RIVER LEVEE FLOOD-CONTROL SYSTEM
CONTINUED IMPROVEMENTS TO BOTH LEVEE AND STORM DRAINAGE SYSTEMS, WHILE BALANCING THE NEEDS OF STRONG CYCLIC MAINTENANCE
OVER THE NEXT 5 YEARS, SEVEN PONDS WILL BE CONSTRUCTED AND ADDED INTO THE CARE PLAN IN COORDINATION WITH VETERANS PARKWAY
MEETING CHALLENGES OF GROWTH BY COLLABORATING WITH DEVELOPERS TO ENSURE SYSTEM PERFORMANCE BEGINS WITH A PLAN FOR NEW AND REDEVELOPING PROPERTIES
PAGE 42 HIGHWAYS & STREETS
Personnel Operating Debt Service Capital
$ 3.0M $ 1.9M $ 1.7M $ 12.4M
$19.0M
STORM DRAINAGE
BUDGET BY CATEGORY
FULLTIME POSITIONS
16
OPERATING BUDGET IMPACTS
REVENUE (CHARGES)
$1,457,846 increase in rate and economic development.
STATE REVOLVING LOANS
$3,500,000 increase in SRF loans due to timing of capital projects.
TOTAL PERSONNEL
$138,596 increase due to normal fulltime wage and benefit adjustments and the addition of one equipment operator.
$23,950 increase in overtime to align with trends.
PROFESSIONAL SERVICES
$157,625 decrease for completion of consultants to review and update levee and a storm system standards to meet federal requirements.
RENTALS
2,888 INLETS /STORM JETTED
INLETS CLEANED
670,256 1
FEET DRAINAGE ACRES MAINTAINED
$104,759 increase in internal fleet charges based on department use.
REPAIR & MAINTENANCE
$62,330 increase for detention pond maintenance and vehicle repairs.

SUPPLIES & MATERIALS
$16,987 increase for purchase of flood flight pump accessories.
CAPITAL
$1,165,000 increase is due to various timing of capital projects and purchasing of equipment.
BOND/SRF DEBT SERVICE
$513,109 increase based on adjusted debt schedules and timing of projects.
MATERIAL REMOVED FROM DRAINAGE (TONS)
1,300 INLETS REPAIRED/ REPLACED (EACH)
72 60,820
CAPITAL PROGRAM
Sources
Drainage Fees State Loans
TOTAL CAPITAL SOURCES Projects
Drainage Improvements
Non-point Source Improvements
Regional Stormwater Analysis and Improvements
Land Acquisition
Storm Drainage Improvements—Streets Projects
Sump Pump Collection Systems
Flood Control System Improvements
$12,405,000
Storm Drainage Improvements—Water Reclamation Projects
TOTAL CAPITAL PROJECTS
Equipment Dump Truck Wood Chipper TOTAL CAPITAL EQUIPMENT TOTAL CAPITAL PROGRAM
PAGE 43 HIGHWAYS & STREETS
2024 Budget 8,905,000
225,000 50,000
$12,405,000
3,500,000
4,560,000 3,500,000 1,430,000 1,180,000 620,000 500,000 280,000 60,000 $12,130,000
$275,000
2023 Budget 2024 Budget $ Change % Change Revenues Charges - Drainage Fee $12,100,224 $13,558,070 1,457,846 12.0% State Revolving Loans (SRF) - 3,500,000 3,500,000Platting Fees 1,774,820 1,774,820 - 0.0% Total Revenues $13,875,044 $18,832,890 $4,957,846 35.7% Expenses Fulltime Wages & Benefits $2,784,256 $2,922,852 138,596 5.0% Part-time 44,000 44,000 - 0.0% Overtime 26,050 50,000 23,950 91.9% Total Personnel 2,854,306 3,016,852 162,546 5.7% Professional Services 326,470 168,845 (157,625) -48.3% Rentals 207,120 311,879 104,759 50.6% Repair & Maintenance 1,229,669 1,291,999 62,330 5.1% Supplies & Materials 95,238 112,225 16,987 17.8% Training & Education 16,110 16,110 - 0.0% Utilities 10,085 10,085 - 0.0% Lease Payments - - -Total Other Operating 1,884,692 1,911,143 26,451 1.4% Capital 11,240,000 12,405,000 1,165,000 10.4% Bond/SRF Debt Service 1,219,593 1,732,702 513,109 42.1% Total Expenditures $17,198,591 $19,065,696 $1,867,105 10.9% IN 2022
Intentionally Left Blank
PAGE 44
PUBLIC HEALTH
OUR PURPOSE
Personnel Operating Debt Service Capital
$19.6M $ 11.9M $ 7.6M $ –$ 0.1M
The Sioux Falls Health Department (SFHD) protects and promotes health and well-being in Sioux Falls through essential public health services. Services and programs that SFHD provides to the community include protection from environmental health hazards, health promotion, disease prevention, ensuring equitable access to primary healthcare services, public health emergency preparedness and response activities, and quality assurance for emergency medical services.
OUR FOCUS
EVALUATING THE CITY’S EMERGENCY MEDICAL SERVICES SYSTEM
EXPANDING HEALTH PROMOTION AND DISEASE PREVENTION EFFORTS BY WORKING WITH PARTNERS TO IMPLEMENT THE 2022-2025 SIOUX FALLS COMMUNITY HEALTH IMPROVEMENT PLAN
INVESTING IN CLINICAL PATIENT SERVICES THROUGH EXPANDED MEDICATION ACCESS AND TECHNOLOGY

COLLABORATING WITH PARTNERS TO ASSIST IN ADDRESSING HOMELESSNESS THROUGH THE ESTABLISHMENT OF STREET OUTREACH TEAMS
ENSURING A SUSTAINABLE, EQUITABLE, AND DATA FORWARD APPROACH IN PROVIDING ACCESS TO HEALTHCARE SERVICES
SUSTAINING THE DELIVERY OF HIGH-QUALITY ENVIRONMENTAL HEALTH SERVICES
These objectives will be achieved through investment in technology and staff training as well as through collaboration with other City departments and community partners.
PAGE 45 PUBLIC HEALTH
PUBLIC HEALTH
OPERATING BUDGET BY CATEGORY
421
21,223 MEDICAL VISITS
COMMUNITY BENEFIT FROM SUBSIDIZED HEALTHCARE IN 2022:

$2.2M
OPERATING BUDGET IMPACTS
REVENUES
$1,221,393 decrease in one-time grants due to expiration and completion of grants, primarily related to the American Rescue Plan Act.
$129,764 increase in net charge revenue based on historical trends.
$155,000 decrease in miscellaneous revenue based on trends in prior year recovery and Medicaid incentives.
WAGES & BENEFITS
$496,803 increase for normal wage and benefit adjustments.
$87,459 decrease in part-time due to expiring grant expenses.
$5,000 increase in overtime based on trends.
PROFESSIONAL SERVICES
$23,000 decrease in collection expenses based on historical trends.
$44,000 increase in program support for patient transportation and medication access.
$10,000 increase in facility and provider expenses.
$4,035 increase due to a City-wide adjustment in internal property liability and risk charges.
RENTALS
$77,000 increase due to a City-wide adjustment in internal technology rental charges for cyclic replacement, security, and network enhancements.
REPAIRS & MAINTENANCE
$1,152,933 decrease in renovation expenses at Falls Community Health tied to expiring and completed grants.
SUPPLIES & MATERIALS
$179,000 offset due to reclassification of software expenses as lease payments per government accounting rules for multi-year operating expense contracts.
$62,000 increase in software expenses based on trends and new softwares for medication access, and remote exams.
$73,000 net increase in general clinic supplies and pharmaceuticals.
TRAINING
$12,000 increase in cost for training subscriptions.
LEASE PAYMENTS
$191,792 being reclassified per government accounting rules as lease payments for multiyear operating expense contracts (printers, subscription software, rentals). This includes an increase of $35,000 for new software for population health.
PAGE 46 PUBLIC HEALTH
611
FLU SHOTS COVID VACCINATIONS Falls Community Health Clinic 2023 Budget 2024 Budget $ Change % Change Revenues Government Shared (Grants) $5,100,552 $3,879,159 $(1,221,393) -23.9% Charges (Net) 3,219,291 3,349,055 129,764 4.0% Miscellaneous 602,000 447,000 (155,000) -25.7% Total Revenues $8,921,843 $7,675,214 $(1,246,629) -14.0% Expenses Fulltime Wages & Benefits $7,695,647 $8,192,450 $496,803 6.5% Part-time 1,018,016 930,557 (87,459) -8.6% Overtime 45,000 50,000 5,000 11.1% Total Personnel 8,758,663 9,173,007 414,344 4.7% Professional Services 2,152,684 2,187,851 35,168 1.6% Rentals 264,492 331,647 67,155 25.4% Repair & Maintenance 1,433,323 280,390 (1,152,933) -80.4% Supplies & Materials 930,000 936,007 6,007 0.6% Training & Education 96,874 108,874 12,000 12.4% Utilities 117,842 117,842 - 0.0% Lease Payments - 191,792 191,792Total Other Operating 4,995,214 4,154,403 (840,811) -16.8% Total Operating Expenses $13,753,877 $13,327,410 $(426,467) -3.1% IN 2022
OPERATING BUDGET BY CATEGORY
OPERATING BUDGET IMPACTS
REVENUES
$25,000 net increase in grant revenue based on reallocations of existing grants and addition of potential grant to help address homelessness.
$25,749 net increase in revenues based on historical trends for charges and fines.
$457,500 increase in revenue from National Opioid Settlements based on timing of expenses.
WAGES & BENEFITS
$169,000 increase for normal fulltime wage and benefit adjustments.
$57,000 increase in part-time for normal wage adjustments and additional part-time and internship for emergency medical services.
PROFESSIONAL SERVICES
$359,000 increase in non-profit support for homeless outreach initiatives and Network of Care support.
$200,000 increase for State Crisis Stabilization Grant expenses for the Link.
$120,000 increase for emergency medical services consultant.
$40,000 increase for Public Health grant funded consultants.
RENTALS
$45,000 offset due to reclassification of rental expenses as lease payments per government accounting rules for multi-year operating expense contracts.
$24,000 increase due to a City-wide adjustment in internal technology rental charges for cyclic replacement, security, and network enhancements.
$16,000 increase in internal Fleet rental charges.
REPAIRS & MAINTENANCE
$200,000 decrease for completed grant funded renovation expenses.
SUPPLIES & MATERIALS
$12,000 decrease in vector control chemicals based on historical trends.
$8,000 decrease for completed grant funded furniture expenses.
TRAINING
$8,000 decrease for removal of completed grant funded training.
LEASE PAYMENTS
$148,512 being reclassified per government accounting rules as lease payments for multiyear operating expense contracts (printers, subscription software, rentals). This includes an increase of $100,000 for software replacement and implementation.
LEASE RIGHT-TO-USE LIABILITY
1,286 SERVICES PROVIDED TO
401,480 ACRES
$250,000 offsetting revenue and expense to recognize a right-to-use asset and liability for potential long-term software lease per government accounting rules.
PAGE 47 PUBLIC HEALTH IN 2021
Medical Dental Falls Community Health Clinic Community Safety & Enforcement Community Health & Wellness The Link Total Operating Budget by Program 10,195,059 3,132,351 13,327,410 3,383,332 1,589,645 1,157,500 $19,457,887
Budget FULLTIME POSITIONS KEY STATISTICS 2022 Medical Visits 21,223 Dental Visits 10,064 Behavioral Health Visits 1,018 Facility Inspections 3,145 Home Daycare Registrations 212 Nuisance Cases Resolved 1,109 Nuisance Property Cleanups 23 Vector Control Treatment Sites 11,589 Community Health Educational Materials Distributed 2,500+ Project NICE/KEEP Clean Up Area—Miles2 1.9 Community Engagement & Outreach Events 30+
85 OPERATING BUDGET BY PROGRAM
2024
HOMELESS
PATIENTS AT FALLS COMMUNITY HEALTH
Sources 2nd Penny Sales Tax TOTAL CAPITAL SOURCES Equipment Vehicle (2) Clinic Equipment TOTAL CAPITAL PROGRAM 2024 Budget CAPITAL PROGRAM 138,000 $138,000 110,000 28,000 $138,000
CONTROL TREATMENTS OVER 0 Community Health, Safety, and Enforcement 2023 Budget 2024 Budget $ Change % Change Revenues Government Shared $2,304,000 $2,329,000 $25,000 1.1% Charges 339,651 345,400 5,749 1.7% Contributions/Settlements 49,000 506,500 457,500 933.7% Other (License/Permits, Fines) 422,610 442,610 20,000 4.7% Total Revenues $3,115,261 $3,623,510 $508,249 16.3% Lease Right-to-Use Asset 250,000 Expenses Fulltime Wages & Benefits $1,944,930 $2,113,535 $168,605 8.7% Part-time 548,730 605,753 57,023 10.4% Overtime 12,000 13,000 1,000 8.3% Total Personnel 2,505,660 2,732,288 226,628 9.0% Professional Services 1,829,064 2,534,748 705,684 38.6% Rentals 154,376 143,656 (10,720) -6.9% Repair & Maintenance 258,600 63,565 (195,035) -75.4% Supplies & Materials 498,437 455,362 (43,075) -8.6% Training & Education 31,243 23,243 (8,000) -25.6% Utilities 29,102 29,102 - 0.0% Lease Payments - 148,512 148,512Total Other Operating 2,800,823 3,398,188 597,366 21.3% Total Operating Expenses $5,306,483 $6,130,477 $823,994 15.5% Lease Right-to-Use Liability 250,000
11,626 VECTOR
Intentionally Left Blank
PAGE 48
LIBRARY
OUR PURPOSE
Siouxland Libraries aims to serve the needs of its customers by expanding minds, building community, and inspiring curiosity. The library strengthens our community, supports the Kids and Families tenet of the One Sioux Falls Framework by creating an inclusive sense of place in each of its 13 branches, and ensures that all citizens have access to a wide range of resources promoting a lifelong love of reading, learning, and literacy.
OUR FOCUS
PROVIDE EXPERIENCES THAT SURPRISE AND DELIGHT, ENCOURAGE EARLY LITERACY, AND ARE THE CENTER FOR LIFELONG LEARNING

PROMOTE LIBRARY SERVICES AND PROGRAMS THROUGH OUTREACH AND MARKETING, AND EXPLORE NEW APPROACHES TO ENGAGE OUR GROWING, DIVERSE AND DYNAMIC COMMUNITY
ADAPT TO CHANGING SERVICES AND CONSUMERS BY PROVIDING WELCOMING SPACES FOR PEOPLE TO GATHER, LEARN, AND CONNECT
BRING THE COMMUNITY TOGETHER, CELEBRATE OUR RICH TRADITIONS, AND EMBRACE THE DIVERSITY OF A DYNAMIC AND GROWING COMMUNITY IN PARTNERSHIP WITH SERVICE AGENCIES, LEARNING INSTITUTIONS, AND COMMUNITY LEADERS
CONTINUE TO ADAPT LIBRARY COLLECTIONS, SERVICES, AND TECHNOLOGY IN RESPONSE TO THE NEEDS OF OUR COMMUNITY
These priorities have been guided by community input as detailed in the Siouxland Libraries Strategic Plan 2023-2027 as adopted by the Library Board of Trustees.
PAGE 49 CULTURE & RECREATION
Personnel Operating Debt Service Capital
$ 7.1M $ 3.3M $ –$ 0.9M
$11.3M
SIOUXLAND LIBRARIES
BUDGET BY CATEGORY
40% LIBRARY CARD HOLDERS AS A PERCENTAGE OF POPULATION
2.0 MILLION LIBRARY VISITS (PHYSICAL & VIRTUAL)
OPERATING BUDGET IMPACTS
REVENUE
(COUNTY OPERATING SUPPORT)
$70,000 increased contribution from Minnehaha County for operations.
$15,000 decrease based on actual trends and implementation of a new fine policy.
TOTAL PERSONNEL
$314,200 increase due to normal fulltime wage and benefit adjustments.
$31,300 increase due to part-time wage adjustments and additional part-time support to Oak View branch.
PROFESSIONAL SERVICES
$9,000 increase for marketing of specific library services to targeted segments of the population based on Strategic Plan goal.
$9,300 increase due to a City-wide adjustment in internal property and liability risk charges.
$8,000 decrease as services for E-Rate consultant not needed due to low reimbursements through E-rate.
8.0 CIRCULATION PER CAPITA
RENTALS
$113,500 increase due to a City-wide adjustment in internal technology rental charges for cyclic replacement, security, and network enhancements.
$17,400 decrease in copiers rentals due to reclassification per government accounting rules for multi-year lease payments.
REPAIR & MAINTENANCE
$10,000 increase mainly due to centralized facility charges.
$43,000 decrease due to less expensive maintenance cost for upgraded self-checkout and AMH equipment.
SUPPLIES & MATERIALS
$19,000 increase for panels, cameras, speakers, and installation for expanded access at 2 rural branches. $11,000 increase for display screens.
$8,400 increase primarily for supplies for programs for all ages at all locations due to cost escalation, record participation levels, and school/public library initiatives. $158,000 decrease in software due to reclassificassion per government accounting rules for multi-year lease payments.
TRAINING & EDUCATION
$2,000 increase for staff training.
UTILITIES
$14,100 increase to align budget with actual trends.
LEASE PAYMENTS
$213,700 being reclassified from per government accounting rules as lease payments for multi-year operating expense contracts (printers, subscription software, rentals).
SIOUXLAND MUSEUM SUPPORT
$45,000 increase in support for the Museum primarily due to wage and benefit increases and inflationary impact.
PAGE 50
CULTURE & RECREATION
2023 Budget 2024 Budget $ Change % Change Revenues County Operating Support $1,345,000 $1,415,000 $70,000 5.2% Charges and Fines 98,000 83,000 (15,000) -15.3% Contributions, Grants, Misc. 30,000 30,000 - 0.0% Total Revenues $1,473,000 $1,528,000 $55,000 3.7% Expenses Fulltime Wages & Benefits $6,455,805 $6,770,039 $314,234 4.9% Part-time 278,697 310,000 31,303 11.2% Overtime 500 500 - 0.0% Total Personnel 6,735,002 7,080,539 345,537 5.1% Professional Services 432,840 443,186 10,346 2.4% Rentals 395,427 491,509 96,082 24.3% Repair & Maintenance 626,300 593,300 (33,000) -5.3% Supplies & Materials 391,122 271,590 (119,532) -30.6% Training & Education 18,025 20,070 2,045 11.3% Utilities 300,308 314,406 14,098 4.7% Lease Payments - 213,712 213,712Total Other Operating 2,164,022 2,347,773 183,751 8.5% Siouxland Museum Support 861,623 906,620 44,997 5.2% Total Operating Expenses $9,760,647 $10,334,932 $574,285 5.9%

PAGE 51 CULTURE & RECREATION 63 OPERATING BUDGET BY PROGRAM FULLTIME POSITIONS 310,803 ITEMS TO BE CHECKED OUT (C OLLEC TION SIZE IN 202 2) 87,386 LIBRARY CARDHOLDERS IN 202 2 PEOPLE ATTENDED 1, 250 PROGRAM S MEETING ROOMS USE: 11,491 TIMES OVER 1.8 MILLION ITEMS BORROWED IN 202 2 (1,424,584 PHYSIC AL & 373,912 DIGITAL) 718,190 VISITORS IN 202 2 22 ,943 HOURS OPEN FOR SERVICE IN 202 2 106,7 21 COMPUTER SESSIONS IN 2022 IN 202 2 IN 202 2 31,611 0 Sioux Falls Branches Caille Downtown Library Oak View Prairie West Ronning SIOUXLAND LIBRARIES BRANCHES Rural Branches Baltic Brandon Colton Crooks Garretson Hartford Humboldt Valley Springs LIBRARIES 2024 Budget Operations (includes wages & benefits) 7,084,363 Technology 815,082 Collections 238,350 Program Support 62,200 Centralized Facilities 1,228,318 Siouxland Museum 906,620 Total Operating Budget by Program $10,334,932 Sources 2nd Penny Sales Tax Minnehaha County Donation TOTAL CAPITAL SOURCES Equipment Van Books TOTAL CAPITAL EQUIPMENT TOTAL CAPITAL PROGRAM 2024 Budget CAPITAL PROGRAM 845,000 65,000 11,000 $921,000 75,000 846,000 $921,000 $921,000
Intentionally Left Blank
PAGE 52
PARKS AND RECREATION
Personnel Operating Debt Service Capital
OUR PURPOSE
Sioux Falls Parks and Recreation provides a comprehensive mix of high-quality parks and recreation programs, facilities, and services that contribute to a quality of life that is unparalleled in the region. The department aims to enhance the wellbeing of resident experiences through people, programs, places, partnerships and aid in the community’s economic growth by investing in a city where people want to live.
OUR FOCUS
PROMOTE HEALTH AND WELLNESS FOR ALL AGES AND ABILITIES THROUGH PARK FACILITIES AND RECREATIONAL PROGRAM OPPORTUNITIES
PLANNING AND MANAGING THE PARK SYSTEM AND A DIVERSE URBAN FOREST WITH A FOCUS ON KEEPING PACE WITH COMMUNITY GROWTH AND PROVIDING EQUITABLE ACCESS
IMPLEMENT A STRATEGY FOR AQUATICS THAT MANAGES COSTS, REFRESHES, AND ENHANCES EXISTING RESOURCES INCLUDING POOL REPLACEMENTS AND PARK IMPROVEMENTS AT FRANK OLSON, KUEHN, AND MCKENNAN PARKS AMONG OTHER UPGRADES TO BE FUNDED WITH A QUALITY-OF-LIFE BOND
EMBRACING THE NATURAL FEATURES OF THE COMMUNITY TO FOSTER A HIGH QUALITY OF LIFE WITH CONSTRUCTION OF THE NEXT PHASE OF THE BIG SIOUX RIVER TRAIL CORRIDOR
EXPANDING RECREATIONAL OPPORTUNITIES AND EXPERIENCES THROUGH PARTNERSHIPS AND PROJECTS INCLUDING JACOBSON PLAZA, PHASE 3 OF THE DOWNTOWN RIVER GREENWAY, HISTORY PLAZA IMPROVEMENTS AT THE MJW ARBORETUM, AND CONSTRUCTION AT THE GREAT PLAINS ZOO
LEVERAGE TECHNOLOGY AND PARTNER WITH OTHER CITY DEPARTMENTS TO BUILD DATA DRIVEN CYCLICAL IMPROVEMENT PLANS FOR PLAYGROUNDS, PARKING LOTS, PARK ROADS, SIDEWALKS, AND THE RECREATION TRAIL TO ENSURE THE PARK SYSTEM INFRASTRUCTURE STAYS SAFE, CURRENT, AND PROVIDES THE BEST CUSTOMER EXPERIENCE
PAGE 53 CULTURE
& RECREATION
$42.7M $ 14.5M $ 12.5M $ –$ 15.7M
PARKS AND RECREATION
OPERATING BUDGET BY CATEGORY
OPERATING BUDGET IMPACTS
REVENUES
$5,000 decrease due to one-time state grant.
TOTAL PERSONNEL
$758,100 increase due to normal fulltime wage and benefit adjustment and the addition of one Park Technician.
$516,000 increase in part-time wages primarily due to wage adjustments. The increase has been offset by $276,000 reduction with the Community Center agreement, resulting in actual budget increase of $240,300.
PROFESSIONAL SERVICES
$475,000 increase due to Community Center agreement.
$296,500 increase for the Great Plains Zoo management agreement. $45,100 increase for an ongoing tree inventory initiative. $40,200 increase primarily based actual trends for property liability insurance.
RENTALS
$91,700 increase due to a City-wide adjustment in internal technology rental charges for cyclic replacement, security, and network enhancements.
REPAIR & MAINTENANCE
$195,000 increase due to Big Sioux Greenway Trail and park-wide parking lot asphalt cyclic repair.
$155,100 increase for fleet repairs to align budget to actual trends due to aging fleet.
$150,300 increase related to maintenance of buildings and grounds, based on cyclic needs and to align budget to actual trends.
$372,200 decrease due to Community Center agreement.
SUPPLIES & MATERIALS
$76,400 increase mainly due to pool chemicals and small tools and equipment inflationary adjustments. The increase has been offset by $44,000 reduction with Community Center agreement and $7,400 to align budget to actual trend, resulting in actual budget increase of $25,000.

UTILITIES
$373,000 increase mainly due to inflationary adjustments and to align budget to actuals. The increase has been offset by $79,300 reduction with Community Center agreement, resulting in actual budget increase of $293,700.
LEASE PAYMENTS
$11,300 being reclassified from per government accounting rules as lease payments for multi-year operating expense contracts (printers, subscription software, rentals).
PAGE 54 CULTURE & RECREATION
SATISFACTION WITH QUALITY OF PARKS 90% SATISFACTION WITH QUALITY OF PROGRAMS OR CLASSES 85% SATISFACTION WITH RECREATION CENTERS OR FACILITIES 100% 90% 80% 70% 60% 50% 85%
2023 Budget 2024 Budget $ Change % Change Revenues Charges $2,193,000 $2,193,000 $ - 0.0% Contributions $148,000 $148,000 - 0.0% Other (Grants, Licenses/Permits, Rentals) 70,450 65,450 (5,000) -7.1% Total Revenues $2,411,450 $2,406,450 $(5,000) -0.2% Expenses Fulltime Wages & Benefits $8,288,545 $9,046,647 $758,102 9.1% Part-time 5,149,366 5,389,659 240,292 4.7% Overtime 70,000 70,000 - 0.0% Total Personnel 13,507,911 14,506,305 998,394 7.4% Professional Services 3,909,147 4,765,861 856,714 21.9% Rentals 455,258 546,915 91,657 20.1% Repair & Maintenance 3,661,938 3,790,100 128,162 3.5% Supplies & Materials 1,163,685 1,188,674 24,989 2.1% Training & Education 60,000 60,000 - 0.0% Utilities 1,895,790 2,189,460 293,670 15.5% Lease Payments - 11,282 11,282Total Other Operating 11,145,818 12,552,291 1,406,473 12.6% Total Operating Expenses $24,653,729 $27,058,597 $2,404,868 9.8%
OPERATING BUDGET BY PROGRAM

PAGE 55 CULTURE & RECREATION 3,393 PARK ACRES 81 DEVELOPED PARKS & 37 MILES OF TRAIL 6 OUTDOOR POOLS & & 2024 Budget Parks & Playgrounds 9,534,734 Aquatics (Midco® Aquatic Center: $2.3M) 5,268,108 Outdoor Sports 3,571,842 Indoor Recreation 1,313,074 Forestry 2,297,931 Zoo 2,460,409 Community Centers 475,000 External Property Maintenance 1,141,080 External Special Events 454,220 Music & Theater Venues 280,198 Centralized Facilities 262,000 Total Operating Budget by Program $27,058,597
Sources 2nd Penny Sales Tax Other Financing (Contributions, Grants) TOTAL CAPITAL SOURCES Projects Community/Regional Parks Greenways/Trails Aquatic Facilities Land Acquisitions Cyclic Park Infrastructure Improvements Playground Improvements Park Storage Facilities Zoo Master Plan Improvements Park Master Plan Neighborhood Parks TOTAL CAPITAL PROJECTS Equipment Vehicles Ball Field Equipment Landscape Equipment Great Bear Equipment Great Plains Zoo Equipment Other Equipment TOTAL CAPITAL EQUIPMENT TOTAL CAPITAL PROGRAM 2024 Budget CAPITAL PROGRAM 15,033,500 640,000 $15,673,500 1,350,000 189,000 6,978,500 1,830,000 1,996,000 571,000 300,000 300,000 175,000 115,000 $13,804,500 826,000 42,000 444,000 330,000 100,000 127,000 $1,869,000 $15,673,500 FULLTIME POSITIONS 81 PART-TIME (FULLTIME EQUIVALENTS) 145 1 MAINTAIN 30 MILES OF TRAIL S 5 YEAR PL AN NEW TREE S PL ANTED IN 2 02 2 2,490 A SH TREE S REMOVED IN 202 2 445 324 PRIVATE BOULEVARD TREE S PL ANTED IN 2 02 2 418,35 5 230 POOL AT TENDANCE IN 202 2 SERVING OVER 2.5 MILLION VISITORS & AT TENDEE S 2,405 ash tr ees re mo ve d 197 new tr ees plan te d 3,346 Park Acres and 80 deve l2,787 swimming less on participa nt s 58,430 Levi tt at the Falls Attende es (new ) 110 FAMILY PROG RAMS IN 202 2 IN 202 2 Midco® Aquatic Center
Intentionally Left Blank
PAGE 56
ENTERTAINMENT VENUES
Events Complex
Sioux Falls Stadium
wASHINGTON pAVILION
oRPHEUM tHEATER
$12.9M $ 5.3M $ 0.9M $ 5.3M $ 1.4M
OUR PURPOSE
Invest in entertainment and convention venues to enhance the quality of life and cultural experience for residents, while attracting business and visitors to our community. The one percent sales “entertainment tax” on lodging accommodations, dining, alcohol sales, and ticketed events enables the City to invest in high-quality facilities that offer a sports, arts, and other entertainment options.
OUR FOCUS
PARTNER WITH OUR ENTERTAINMENT VENUE MANGERS, DONORS, AND SPONSORS TO ENHANCE AND ENRICH OUR COMMUNITY BY PROVIDING ENTERTAINMENT OPPORTUNITIES FOR EVERYONE
INVEST IN MAINTAINING AND IMPROVING OUR EXISTING VENUES TO PROVIDE AN ENJOYABLE CUSTOMER EXPERIENCE TODAY WHILE PLANNING FOR THE FUTURE THROUGH THE COMPLETION OF THE EVENTS CENTER CAMPUS MASTER PLAN
EXPAND OUR FACILITIES THROUGH TIMELY AND OPPORTUNE INVESTMENTS IN ORDER TO PROVIDE AN EVEN WIDER VARIETY OF ENTERTAINMENT OPTIONS THAT WILL APPEAL TO RESIDENTS WHILE ALSO ATTRACTING MORE VISITORS TO OUR COMMUNITY
ENCOURAGE VENUE MANAGERS TO PROVIDE THE BEST RETURN ON INVESTMENT FOR EACH CITY-OWNED FACILITY

To accomplish this, the City partners with Washington Pavilion Management Inc., ASM Global, and Spectra to manage the city’s entertainment venues. Their focus is as follows:
WASHINGTON PAVILION & ORPHEUM THEATER
Delivering memorable experiences that entertain, educate and enrich, inspiring lifelong discovery and inclusive experiences that improve the quality of life for everyone.
EVENTS COMPLEX
Provide access to large scale multi-purpose events space for entertainment, convention, sports, and community events which appeal to a wide variety of interests and attract business and visitors to Sioux Falls.
PAGE 57 CULTURE & RECREATION
EVENTS COMPLEX & SIOUX FALLS STADIUM BUDGET
BY CATEGORY
$6.0M
17
BUDGETED CONCERTS AT THE DENNY SANFORD PREMIER CENTER IN 2024
COMPLEX HOSTED OVER 630 EVENTS WITH A TOTAL ATTENDANCE OF OVER
670,000
RESULTING IN RECORD REVENUE OF $16.6M IN 2022 FOR THE EVENTS COMPLEX
IMPROVING THE FAN EXPERIENCE BY ADDING GRAB-N-GO’S FOR FOOD AND BEVERAGE SERVICE
CAPITAL PROGRAM
Sources
Entertainment Tax
TOTAL CAPITAL SOURCES
OPERATING BUDGET IMPACTS
EVENTS COMPLEX
$274K increase primarily due to the timing of capital investments, projects include canopy replacement and digital wayfinding for the Convention Center, and vehicle intrusion, HVAC improvments, network and concession equipment for the Events Center.
$100K decrease due to the timing of cyclic repair and maintenance projects.
$300K increase for Consulting for Convention Center master planning.
SIOUX FALLS STADIUM

$208K increase is primarily related to roof and stadium seat repairs.
$260K decrease primarily due to the timing of onetime capital investments.
Projects
Arena Improvements
Convention Center Improvements
Events Center Improvements
TOTAL CAPITAL PROJECTS
Equipment
670,000
2024
Budget
3,180,000 3,180,000 200,000 300,000 980,000 $1,480,000
Convention Center: Kitchen Equipment
Convention Center: Maintenance Equipment
Events Center: AV/Technology Equipment
Events Center: Skirting
Events Center: Concessions & Maintenance Equipment
Events Center: Radios
Sioux Falls Stadium: Laundry Equipment
Sioux Falls Stadium: Concession Equipment
TOTAL CAPITAL EQUIPMENT
TOTAL CAPITAL PROGRAM
77,000 72,000 875,000 85,000 400,000 150,000 16,000 25,000 $1,700,000 $3,180,000
PAGE 58 CULTURE
& RECREATION
Operating Contract Repairs, Maintenance, Supplies, Other Capital
$ 0.2M $ 2.8M $ 3.2M
2023 Budget 2024 Budget $ Change % Change Events Complex Operating Contract $ - $ - $ -Repair & Maintenance 1,478,430 1,377,567 (100,863) -6.8% Supplies & Materials 143,520 149,261 5,741 4.0% Professional Services 200,000 500,000 300,000 150.0% Property Insurance 145,227 159,750 14,523 10.0% Capital Buildings 875,000 1,480,000 605,000 69.1% Capital Equipment 1,990,000 1,659,000 (331,000) -16.6% Total Events Complex Expenses $4,832,177 $5,325,578 $493,401 10.2% Sioux Falls Stadium Operating Contract $196,350 $200,000 $3,650 1.9% Repair & Maintenance 200,000 408,000 208,000 104.0% Supplies & Materials 30,000 31,200 1,200 4.0% Professional Services 200,000 200,000 - 0.0% Property Insurance 9,228 10,151 923 10.0% Capital Buildings 260,000 - (260,000) -100.0% Capital Equipment 9,000 41,000 32,000 355.6% Total Sioux Falls Stadium Expenses $904,578 $890,351 $(14,227) -1.6%
WASHINGTON PAVILION & ORPHEUM THEATER BUDGET
BY CATEGORY

670,000
400,000 GUESTS IN FY23 (JULY 2022- JUNE 2023) 26,000 STUDENTS
BETWEEN THE KIRBY SCIENCE DISCOVERY CENTER, VISUAL ARTS CENTER, THEATRE AND CONCERT PERFORMANCES, SPECIAL EVENTS LIKE SIDEWALK ARTS FESTIVAL AND MORE, THE WASHINGTON PAVILION DELIVERED MEMORABLE EXPERIENCES TO ENGAGED WITH ENHANCED LEARNING OPPORTUNITIES THROUGH MORE THAN 100 INTERACTIVE STEAM EXHIBITS, TRAVELING EXHIBITS, OUTREACH PROGRAMS, CAMPS AND SCHOOL TRIPS. TOTAL PERFORMANCES DELIGHTED AUDIENCES AT THE WASHINGTON PAVILION AND ORPHEUM THEATER CENTER.
OPERATING BUDGET IMPACTS
WASHINGTON PAVILION
Overall the Washington Pavilion budget is flat to last year. However, this budget includes investing over $3.0M in maintenance and capital projects. These projects include HVAC upgrades, pit elevator, and KSDC exhibits.
ORPHEUM THEATER
Overall the Orpheum budget is relatively flat to last year. However, this budget includes over $1.0M in maintenance and capital projects. These projects include sound system upgrade, dressing room restoration, and courtyard re-design.
2023 Budget 2024 Budget $ Change % Change Washington Pavilion Operating Contract $1,750,000 $1,750,000 $ - 0.0% Rentals - Exhibits 300,000 300,000 - 0.0% Repair & Maintenance 600,000 635,000 35,000 5.8% Supplies & Materials 100,000 104,000 4,000 4.0% Property Insurance and Other 96,985 106,684 9,699 10.0% Capital Buildings 775,000 1,730,000 955,000 123.2% Capital Equipment 1,647,000 685,000 (962,000) -58.4% Total Washington Pavilion Expenses $5,268,985 $5,310,684 $41,699 0.8% Orpheum Theater Operating Contract $345,000 $345,000 $ - 0.0% Repair & Maintenance 208,000 208,000 - 0.0% Supplies & Materials 52,000 54,080 2,080 4.0% Rentals - - -Property Insurance 6,736 7,410 674 10.0% Capital Buildings 650,000 500,000 (150,000) -23.1% Capital Equipment 65,000 300,000 235,000 361.5% Total Orpheum Theater Expenses $1,326,736 $1,414,490 $87,754 6.6% THE WASHINGTON PAVILION AND ORPHEUM THEATER CENTER WELCOMED VISITORS AND TICKET BUYERS FROM 44 DIFFERENT STATES AND 8 FOREIGN COUNTRIES
285 Sources Entertainment Tax
$6.7M
$6.7M
$6.7M
TOTAL CAPITAL SOURCES
Projects Pavilion Improvements Orpheum Theater Improvements

2024 Budget 3,215,000 $3,215,000 1,730,000 500,000 $2,230,000 CAPITAL PROGRAM
TOTAL CAPITAL PROJECTS Equipment Pavilion: Kitchen Equipment Pavilion: Exhibits Pavilion: Communications Equipment Orpheum Theater: Sound System
TOTAL CAPITAL EQUIPMENT
PAGE 59 CULTURE &
RECREATION
Operating Contract Repairs, Maintenance, Supplies, Other Capital
$ 2.1M $ 1.4M $ 3.2M Operating Contract Repairs, Maintenance, Supplies, Other Capital
$ 2.1M $ 1.4M $ 3.2M Operating Contract Repairs, Maintenance, Supplies, Other Capital
$ 2.1M $ 1.4M $ 3.2M
TOTAL CAPITAL PROGRAM 100,000 500,000 85,000 300,000 $985,000 $3,215,000
PLANNING AND DEVELOPMENT SERVICES
OUR PURPOSE
The Planning and Development Services Division is responsible for guiding the orderly growth and development of Sioux Falls through the implementation of innovative plans, economic development policies, and land use regulations.

OUR FOCUS
PROMOTE REDEVELOPMENT AND INCREASED RESIDENTIAL HOUSING BY COMPLETING PHASES THREE AND FOUR OF THE MINNESOTA AVENUE CORRIDOR STUDY
PROVIDE OVERALL PROGRAM MANAGEMENT SUPPORT FOR DOWNTOWN BY IMPLEMENTING THE INITIATIVES IDENTIFIED IN THE 2035 DOWNTOWN PLAN AND DOWNTOWN TRAFFIC STUDY, COORDINATING RIVERLINE DISTRICT PLANNING EFFORTS, AND REVIEWING OTHER ECONOMIC DEVELOPMENT PROPOSALS AND PLANS
CONTINUE OUR COMMITMENT TO ONGOING GROWTH MANAGEMENT BY COMPLETING AN UPDATE TO THE CITY’S SHAPE SIOUX FALLS COMPREHENSIVE PLAN
COORDINATE THE ONGOING EFFORTS OF THE STRATEGIC LAND ACQUISITION TEAM, INCLUDING THE ANNUAL REVIEW AND UPDATING OF THE CITY’S TIER MAPS FOR FUTURE GROWTH AND IDENTIFYING PROPERTY FOR FUTURE CITY FACILITIES
PROMOTE GREATER REGIONAL COORDINATION OF LAND USE AND TRANSPORTATION PLANNING EFFORTS THROUGH THE COMPLETION OF THE RICE STREET/HOLLY BOULEVARD CORRIDOR STUDY
SUPPORT REGIONAL ECONOMIC DEVELOPMENT EFFORTS THROUGH THE COMPLETION OF THE EVENT CENTER CAMPUS MASTER PLAN
EXPAND THE PUBLIC OUTREACH EFFORTS RELATED TO THE CITY’S FLOODPLAIN REGULATIONS BY PROVIDING GREATER DETAILS ON REGULATED FLOODPLAIN LOCATIONS, PROCESSES, AND CURRENT PROPERTY STANDINGS
EXPAND HOUSING OPPORTUNITIES IN SELECT LOCATIONS THROUGH THE IMPLEMENTATION OF A MIDTOWN MIXED USE ZONING DISTRICT
CONTINUE TO ADDRESS THE CHANGING NEEDS OF DEVELOPMENT THROUGH THE ANNUAL SHAPE PLACES ZONING ORDINANCE UPDATES
PARTICIPATE IN THE METROPOLITAN PLANNING ORGANIZATION (MPO) REGIONAL TRANSPORTATION PLANNING PROCESS THROUGH INVOLVEMENT IN THE UPDATE OF THE LONG-RANGE TRANSPORTATION PLAN AND REGIONAL TRAFFIC MODEL
PAGE 60 URBAN & ECONOMIC DEVELOPMENT
Personnel Operating Debt Service Capital $15.7M $ 6.8M $ 8.6M $ –$ 0.3M
PLANNING AND DEVELOPMENT
OPERATING BUDGET BY CATEGORY
REVENUE
$365,000 decrease primarily due to anticipated economic slow down in building permits and planning review fees.
$280,000 increase mainly in main street assessment due to rate structure adjustment and growth.
$620,000 increase lodging tax due to growth and service demand.
$727,400 increase primarily for floodplain planning mitigation grant.
TOTAL PERSONNEL
$647,600 increase due to normal fulltime wage and benefit adjustment and the addition of one Urban Planner and one Building Inspector.
$2,700 increase for part-time wage adjustments.
PROFESSIONAL SERVICES
$862,500 increase for floodplain planning mitigation effort (partially offset by grant).
$60,700 increase in credit card fees based on actual trends.
$26,700 increase for Sculpture Walk operating support.
$31,100 increase in support for Sioux Falls Development Foundation.

$5,900 increase based actual trends for property liability insurance.
$62,500 decrease for bicycle trail master plan.
RENTALS
$127,850 increase due to a City-wide adjustment in internal technology rental charges for cyclic replacement, security, and network enhancements.
REPAIR & MAINTENANCE
$2,200 increase for vehicle repair and maintenance based on actual trends.
$10,300 decrease for trolley repair.
SUPPLIES & MATERIALS
$12,800 decrease based on actual trends in small tools and field equipment.
TRAINING & EDUCATION
$12,500 increase for travels, conferences, memberships and certifications based on actual trend and inflationary adjustment.
UTILITIES
$4,300 increase based on actual trends.
LEASE PAYMENTS
$3,075 being reclassified from per government accounting rules as lease payments for multi-year operating expense contracts (printers, subscription software, rentals).
BID & LODGING TAX
PASS-THROUGHS
$900,000 increase for BID and lodging tax due to growth and service demand.
PAGE 61 URBAN &
ECONOMIC DEVELOPMENT
IMPACTS
BUDGET BY PROGRAM 2024 Budget BUILDING PERMIT APPLICATIONS COMPLETED ONLINE COMPLETION OF COMMERCIAL BUILDING PLAN REVIEW
BID & LODGING TAX REVENUE PASS-THROUGHS Experience Sioux Falls Downtown BID Tax Hilton Garden Inn Occupancy Fee Total BID and Lodging Tax Revenue Pass-Throughs 3,895,000 475,000 90,000 $4,460,000 2024 Budget 21 Development Services 5,326,179 Building Services 4,619,922 BID and Lodging Tax 4,460,000 Neighborhood Services 1,053,185 Total Operating Budget by Program $15,459,286 56 FULLTIME POSITIONS 2 Sources 2nd Penny Sales Tax TOTAL CAPITAL SOURCES Projects Sculpture Walk Core Façade Easement Equipment Trucks TOTAL CAPITAL PROGRAM 2024 Budget 287,500 $287,500 35,000 100,000 152,500 $287,500 CAPITAL PROGRAM DEVELOPMENT PARTNERSHIPS Downtown Sioux Falls 223,353 Forward Sioux Falls 500,000 SECOG 134,800 SF Development Foundation 320,000 Southeast Tech 205,000 USD Discovery District 153,750 Total Development Partnerships $1,536,903 2024 Budget DAYS CITY SQUARE MILES IN 2022 UP 2.4% 83.3 BUILDING PERMITS IN 2022 PLANNING APPLICATIONS IN 2022 11,171 126 UP 54% DOWN 17% 2023 Budget 2024 Budget $ Change % Change Revenues Licenses & Permits, Charges $4,683,595 $4,318,595 $(365,000) -7.8% Main Street BID & Hilton BID 285,000 565,000 280,000 98.2% Lodging & Occupancy Tax 3,275,000 3,895,000 620,000 18.9% Other (Fines, Grants, Misc) 442,240 1,169,593 727,353 164.5% Total Revenues $8,685,835 $9,948,188 $1,262,353 14.5% Expenses Fulltime Wages & Benefits $6,084,365 $6,731,934 $647,569 10.6% Part-time 44,000 46,680 2,680 6.1% Overtime 22,500 22,500 - 0.0% Total Personnel 6,150,865 6,801,114 650,249 10.6% Professional Services 2,202,154 3,126,512 924,358 42.0% Rentals 536,533 664,381 127,848 23.8% Repair & Maintenance 166,901 158,830 (8,071) -4.8% Supplies & Materials 156,262 143,423 (12,839) -8.2% Training & Education 55,020 67,509 12,489 22.7% Utilities 30,100 34,443 4,343 14.4% Lease Payments - 3,075 3,075Total Other Operating 3,146,970 4,198,173 1,051,202 33.4% BID & Lodging Tax Pass-Throughs 3,560,000 4,460,000 900,000 25.3% Total Operating Expenses $12,857,835 $15,459,286 $2,601,451 20.2%
OPERATING BUDGET
OPERATING
75%
HOUSING
Personnel Operating Debt Service
Capital
$10.8M $ 1.1M $ 9.7M $ –$ –
OUR PURPOSE
The Sioux Falls Housing Division connects residents with resources that help ensure safe and sustainable living conditions. Through partnerships and incentives, Housing provides stable and accessible housing as a vital component in supporting our community’s growth.

OUR FOCUS
WORK WITHIN THE “ONE-TEAM” FRAMEWORK TO TAKE A COMPREHENSIVE APPROACH TO ADDRESS COMMUNITY HOUSING NEEDS
WORK WITH STRATEGIC PARTNERS ACROSS THE COMMUNITY TO PROVIDE ASSISTANCE TO FAMILIES AND INDIVIDUALS RANGING FROM THOSE DEALING WITH HOMELESSNESS TO ASSISTING OUR PUBLIC SAFETY EMPLOYEES IN PURCHASING THEIR FIRST HOME
ADMINISTER PROGRAMS THAT FOCUS ON MAINTAINING SAFE, SANITARY AND AFFORDABLE HOUSING THROUGHOUT THE CITY
LEVERAGE STATE AND FEDERAL FUNDING TO TARGET AREAS OF NEED WITHIN THE CITY AND REVITALIZE NEIGHBORHOODS
EVOLVE AND ADAPT TO ADDRESS DIFFICULT HOUSING AND HOUSING CONNECTED CHALLENGES THROUGH COLLABORATION, INNOVATION AND FLEXIBILITY
PROMOTE A HOUSING FIRST APPROACH TO SUPPORT CASE MANAGEMENT AND A COLLABORATIVE APPROACH TO HOUSING PEOPLE WITH BARRIERS SUCH AS MENTAL HEALTH, SUBSTANCE ABUSE, AND JUSTICE INVOLVEMENT
PAGE 62 URBAN &
DEVELOPMENT
ECONOMIC
HOUSING OPERATING BUDGET BY CATEGORY
HOUSING FUND
CONNECTING PEOPLE WITH HOUSING RESOURCES
HOUSING UNITS PRODUCED, PRESERVED, OR REHABILITATED

288
OPERATING BUDGET IMPACTS
REVENUE
$116,647 increase in grants is primarily due to the timing of one-time grants expiring (COVID/ARPA) and budgeting for new HOME Grant of $1.8M in 2024.
$400,000 decrease is due to the change in business practice of constructing and selling single family homes.
$68,039 combined increase due to the timing of projects, loan repayments for program income, state flex loans, and revitalization revolving income.
$50,000 decrease is due to the removal of a one-time budgeted contribution in 2023.
$460,232 increase in General Fund Transfers supporting the Housing initiatives.
PERSONNEL
$112,499 increase in fulltime wages and benefits is primarily due to internal allocation of positions.
$65,700 increase in part-time to support housing programs and fair housing service levels.
PROFESSIONAL SERVICES PROGRAMMING
$115,169 increase is primarily related to increasing funding for our Rental Rehab Program and the development of two new programs. The first program is to support the rehab of troubled homes (vacant or dilapidated) and the second is to pilot a historic rehab program. This increase is offset by the removal of $400,000 due to a change in business practice of constructing and selling new homes.
PROFESSIONAL SERVICES OTHER
$12,806 increase for hazardous testing and filling fee costs associated with housing programs based actual trends.
RENTALS
$1,138 increase due to a City-wide adjustment in internal technology rental charges for cyclic replacement, security, and network enhancements.
SUPPLIES AND MATERIALS
$31,151 increase due to the purchase and implementation of new software for the enrollment, administration, and reporting of housing programs.
REPAIRS AND TRAINING
$1,000 decrease related to adjusting categories based on actuals.
LEASE PAYMENTS
$200 being reclassified per government accounting rules as lease payments for multi-year operating expense contracts (printers, subscription software, rentals).
20 PEOPLE IMPACTED IN 2022
OPERATING BUDGET BY PROGRAM
HOUSES REHABBED IN 2022
142 UNITS CREATED IN 2022
1,145 0
7 FULLTIME POSITIONS
$10,766,595
PAGE 63 URBAN
& ECONOMIC DEVELOPMENT
2024 Budget Housing Fund 3,577,050 Community Outreach 2,686,043 Rehabilitation 2,375,131 Revitalization 800,000 Administration 938,372 Rental Assistance 390,000 Total Operating Budget by Program
2023 Budget 2024 Budget $ Change % Change Revenues Intergovernmental Federal Grants $3,988,452 $4,105,099 $116,647 2.9% Program Income 713,380 727,966 14,586 2.0% Revitalization Revolving Income 400,000 - (400,000) -100.0% State Loan Proceeds 110,557 164,010 53,453 48.3% Interest Income and Other 22,000 22,000 - 0.0% Contributions 50,000 - (50,000) -100.0% Transfers-In General Fund 1,710,000 2,170,232 460,232 26.9% Total Revenues $6,994,389 $7,189,307 $194,918 2.8% Expenses Fulltime Wages & Benefits $827,883 $940,382 $112,499 13.6% Part-time 40,000 105,700 65,700 164.3% Overtime 1,504 1,504 - 0.0% Total Personnel 869,387 1,047,586 178,199 20.5% Professional Services Programming 9,316,421 9,431,590 115,169 1.2% Professional Services Other 190,934 203,020 12,086 6.3% Rentals 12,806 13,944 1,138 8.9% Repair & Maintenance 1,400 600 (800) -57.1% Supplies & Materials 25,404 56,555 31,151 122.6% Training & Education 12,800 12,600 (200) -1.6% Utilities 500 500 - 0.0% Lease Payments - 200 200Total Other Operating 9,560,265 9,719,009 158,744 1.7% Total Operating Expenses $10,429,652 $10,766,595 $336,943 3.2%
$17.0M
OUR PURPOSE
As Sioux Falls continues to grow in population and area, the need for new approaches to public transit becomes increasingly important. The City’s public transit system, Sioux Area Metro (SAM), provides safe and reliable access for all citizens to jobs, grocery stores, health care, pharmacies, libraries, parks, and many other destinations that are critical to health and wellbeing. Through a mix of multiple scheduled fixed routes, paratransit, and on-demand services, SAM has a positive social and economic impact on the community.
OUR FOCUS
EXPLORE NEW OPPORTUNITIES TO MOVE TRANSIT FORWARD IN THE CITY AS PART OF MAINTAINING AND EXPANDING INFRASTRUCTURE TO BETTER SUPPORT THE COMMUNITY’S NEEDS
BALANCE THE TRANSIT FLEET TO BETTER MATCH THE NEEDS OF OUR RESIDENTS
IMPROVE TRANSIT SERVICES THROUGH TECHNOLOGY THAT ALLOW RIDERS MORE FLEXIBILITY, INFORMATION, RIDE DESTINATIONS, RELIABILITY, AND CONVENIENCE
ENHANCE OPPORTUNITIES FOR KIDS AND FAMILIES TO ACCESS THE TRANSIT SYSTEM
CONTINUE TO EXPLORE THE OPTIONS TO DEVELOP A NEW TRANSIT GARAGE AND OFFICE FACILITY VERSES REMODELING THE CURRENT FACILITY
MAINTAIN A SUSTAINABLE TRANSIT BUDGET THAT BALANCES THE NEEDS OF THE PUBLIC AND ENSURES REVENUES ARE UTILIZED IN THE MOST EFFICIENT MANNER POSSIBLE

PAGE 64 URBAN & ECONOMIC DEVELOPMENT
TRANSIT Personnel Operating Debt Service Capital
$ 0.1M $ 14.6m $ –$ 2.2M
TRANSIT
BUDGET BY CATEGORY
2022 STATISTICS
FIXED ROUTE ON-TIME PERFORMANCE 99.0%
33.0%
OPERATING BUDGET IMPACTS
REVENUE
$606,208 General Fund Transfer increase to maintain a sustainable transit fund.

$127,000 Sales Tax Fund Transfer increase to aid in maintaining a sustainable transit fund as ongoing capital expenditures continue to increase.
$10,887,850 Intergovernmental Grants decrease due to the one time Federal Grant support (ARPA and CARES).
WAGES & BENEFITS
$16,226 increase due to normal wage and benefit adjustments.
OPERATING SUPPORT
$2,025,147 increase to accommodate a new hybrid service model, and other inflationary increases for personnel and other operating costs.
CONSULTANTS, RENTALS, INSURANCE, REPAIR & MAINTENANCE, SUPPLIES, & LEASE PAYMENTS
$16,557 increase due to City-wide adjustments in internal property liability and risk charges and internal technology rental charges.
TRANSIT HQ REMODEL/EXPANSION
439,953
385,565
54,388
$0 increase, budget includes $1,300,000 for ongoing and deferred maintenance. CAPITAL
$1,800,000 increase due to timing of bus purchases and as needed building improvements (HVAC, roof, fuel systems).
100%
80.8%
PAGE 65 URBAN & ECONOMIC DEVELOPMENT
Sources Transit Fund TOTAL CAPITAL SOURCES Projects Transit Facilities Improvements TOTAL CAPITAL PROJECTS Equipment Cutaway buses Bus Shelters TOTAL CAPITAL EQUIPMENT TOTAL CAPITAL PROGRAM 2024 Budget 2,200,000 $2,200,000 900,000 $900,000 1,200,000 100,000 $1,300,000 $2,200,000 CAPITAL PROGRAM SAM OnDemand RIDES REQUESTED WITHIN 1 HOUR OF TRAVELING
AVERAGE WAIT TIME 11 MINUTES
TRANSFER FREE RIDES TRIPS COMPLETED IN 30 MINUTES OR LESS
ANNUAL RIDERSHIP:
FIXED ROUTE:
PARATRANSIT:
2023 Budget 2024 Budget $ Change % Change Revenues General Fund Transfer-in $6,873,599 $7,479,807 $606,208 8.8% Sales Tax Fund Transfer-in 850,000 977,000 127,000 14.9% Intergovernmental Grants 14,594,508 3,706,658 (10,887,850) -74.6% Total Revenues $22,318,107 $12,163,464 $(10,154,643) -45.5% Expenses Fulltime Wages and Benefits $103,419 $119,645 $16,226 15.7% Operating Support 9,671,771 11,696,918 2,025,147 20.9% Outside Agency Support 1,275,233 1,275,233 - 0.0% Consultants, Rentals, Insurance, Repair & Maintenance, Supplies, and Lease Payments 655,127 671,704 16,577 2.5% Transit HQ Remodel/Expansion 1,000,000 1,000,000 - 0.0% Capital 400,000 2,200,000 1,800,000 450.0% Total Expenses $13,105,550 $16,963,501 $3,857,951 29.4%
TAX INCREMENT FINANCING FUND
The City utilizes Tax Increment Financing as a development incentive in our community. Private development helps to create jobs and attract customers, which in turn, attracts more private development. Since the City established its first TIF District in 1989, it has taken a conservative approach to the establishment of TIF Districts and aims to effectively and reasonably use TIF to incentivize job creation and investment in the community.


PAGE 66 URBAN & ECONOMIC DEVELOPMENT
TIF #/Location TIF #10 Lumber Exchange TIF #11 Bancroft TIF #12 DeKalb Lofts TIF #13 Raven TIF #14 River Ramp/HGI TIF #15 Sports Complex
#16 Whittier Heights
#18 Phillips Avenue Lofts
#20 Washington Square
#21 Cascade (Phillips) TIF #23 Foundation Park TIF #24 Steel District TIF #25 Cherapa Place Total TIF Base 778,651 295,270 15,112,683 4,571,705 1,691,952 271,775 258,187 770,775 357,287 396,256 3,522,542 1,591,054 24,102,300 $53,720,437 Current 1 25,944,700 3,695,300 32,197,800 16,866,400 15,722,880 58,443,600 23,932,900 10,676,700 24,503,825 31,764,400 167,728,600 14,657,200 42,193,200 $468,327,505 1 Values Represent Amounts levied in 2022 payable in 2023.
TIF
TIF
TIF
TIF
2023 Budget 2024 Budget $ Change % Change Revenues Property Taxes (TIF) $7,735,000 $8,285,000 $550,000 7.1% Total Revenues $7,735,000 $8,285,000 $550,000 7.1% Expenses Tax Increment Financing District TIF 10 CNA Surety $490,000 $500,000 $10,000 2.0% TIF 11 Bancroft 80,000 80,000 - 0.0% TIF 12 Uptown-Dekalb 300,000 340,000 40,000 13.3% TIF 13 Raven Corporate 245,000 250,000 5,000 2.0% TIF 14 Hilton Hotel 270,000 285,000 15,000 5.6% TIF 15 Sports Complex 1,000,000 1,200,000 200,000 20.0% TIF 16 Whittier Heights 420,000 460,000 40,000 9.5% TIF 18 Phillips Ave Lofts 210,000 205,000 (5,000) -2.4% TIF 20 Washington Square 450,000 470,000 20,000 4.4% TIF 21 Cascade 530,000 605,000 75,000 14.2% TIF 23 Foundation Park 3,640,000 3,250,000 (390,000) -10.7% TIF 24 Steel District 50,000 275,000 225,000 450.0% TIF 25 Cherapa Place 50,000 365,000 315,000 630.0% Total Expenses $7,735,000 $8,285,000 $550,000 7.1%
PAGE 67
Intentionally Left Blank
POWER AND DISTRIBUTION
OUR PURPOSE
The power and distribution division provides power to over 2,900 residential, commercial and government customers. This system owns and maintains a power system comprising 29 miles overhead and 60 miles underground for a total 89 lineal miles of wire.
OUR FOCUS
PROVIDE RELIABLE POWER TO THE WATER RECLAMATION PLANT, THE NEW TRAFFIC AND LIGHTS CAMPUS, AND PUBLIC SAFETY CAMPUS
INCREASE RELIABILITY AND MINIMIZE OUTAGES BY CONTINUING TO MOVE POWER LINES UNDERGROUND IN CORE NEIGHBORHOODS. FINALIZE A 10-YEAR MASTER PLAN FOR THE FUTURE OF POWER IN SIOUX FALLS
IMPLEMENT PHASE 1 OF THE POWER, TRAFFIC AND STREETS LIGHTS CAMPUS WHICH WILL CREATE SYNERGIES BY HAVING THE TEAMS IN ONE LOCATION

PAGE 68 ENTERPRISE FUNDS
Personnel Operating Debt Service Capital $16.0M $ 1.1M $ 7.8M $ –$ 7.1M
POWER AND DISTRIBUTION
BUDGET BY CATEGORY
2,900 PRIVATE AND PUBLIC DISTRIBUTION CUSTOMERS
CAPITAL PROGRAM
Sources
0
Projects
OPERATING BUDGET IMPACTS
CHARGES
$1,450,085 increase is due to expanded service locations and economic development.
TOTAL PERSONNEL
$96,200 increase in Wages and Benefits is due to normal adjustments.
RENTALS
$ 62,283 increase is due to Fleet Charge and Technology increases for cyclical replacements, security and network enhancements.
SUPPLIES & MATERIALS
$652,632 increase is due to an increase in the purchase price of power and demand based on new locations served.

CAPITAL
$5,631,000 increase is primarily due to work on the new Power, Traffic and Street Light campus and purchasing of equipment.
PAGE 69 ENTERPRISE FUNDS
User Fees TOTAL CAPITAL SOURCES
TOTAL CAPITAL PROJECTS Equipment Vehicles Wire Trailer Skidloader Receiver TOTAL CAPITAL EQUIPMENT TOTAL CAPITAL PROGRAM
Circuit Improvements Electrical System Replacement Lights and Power Campus Enhancements
7,102,000
100,000 35,000 75,000 10,000
2024 Budget
$7,102,000 1,102,000 280,000 5,500,000 $6,882,000
$220,000 $7,102,000
14 FULLTIME POSITIONS
2023 Budget 2024 Budget $ Change % Change Revenues Charges - User Fees $10,699,758 $12,149,843 $1,450,085 13.6% Contributions - - -Other (Fines, Interest, Misc.) 64,410 64,410 - 0.0% Total Revenues $10,764,168 $12,214,253 $1,450,085 13.5% Expenses Fulltime Wages & Benefits $886,191 $982,391 $96,200 10.9% Part-time 61,517 61,517 - 0.0% Overtime 21,000 21,000 - 0.0% Total Personnel 968,708 1,064,908 96,200 9.9% Professional Services 120,084 118,051 (2,033) -1.7% Rentals 132,912 195,195 62,283 46.9% Repair & Maintenance 249,026 224,714 (24,312) -9.8% Supplies & Materials 6,605,499 7,258,131 652,632 9.9% Training & Education 20,015 20,015 - 0.0% Utilities 23,563 24,926 1,363 5.8% Lease Payments - 3,500 3,500Total Other Operating 7,151,099 7,844,532 693,433 9.7% Capital 1,471,000 7,102,000 5,631,000 382.8% Bond/SRF Debt Service - - -Total Operating Expenses $9,590,807 $16,011,440 $6,420,633 66.9%
LANDFILL
OUR PURPOSE
The Sioux Falls regional sanitary landfill serves five counties and a population of over 300,000, collecting an average of 28,000 tons per month of household waste, including construction and demolition debris. It continues to make Sioux Falls more sustainable by partnering with commercial haulers to increase recycle rates and support our household hazardous waste program to protect natural resources and safeguard the landfill’s longevity.
Instead of escaping into the air, landfill gas (LFG) is captured, converted, and used as a renewable energy resource, helping to reduce odors and hazards associated with LFG emissions. Through investments in technology, the landfill has collected LFG from an approximately 350-acre footprint that is processed before being directed to the POET ethanol plant in Chancellor.
OUR FOCUS
DELIVERING EXCEPTIONAL AND RELIABLE SERVICE TO MEET CURRENT AND FUTURE GROWTH DEMANDS SUPPORTED SOLELY BY USER FEES
DIVERTING WASTE FROM THE LANDFILL—THROUGH RECYCLING, COMPOSTING, AND REUSE PROGRAMS—TO EXTEND THE LIFE OF THE LANDFILL WHILE BENEFITING THE LOCAL ECONOMY AND NATURAL RESOURCES
IMPROVING CUSTOMER EXPERIENCE BY EXPANDING THE PUBLIC DROP-OFF AREA, A RE-DESIGNING THE SCALE HOUSE AND CUSTOMER ENTRANCE, AND CONTINUING TO INVEST IN TECHNOLOGY TO SUPPORT MAXIMIZING BOTH THE AMOUNT OF MATERIALS/ITEMS PASSING THROUGH THE SYSTEM, AND WAIT TIMES
CONTINUING TO MAINTAIN CURRENT LANDFILL GAS AND LEACHATE (CONTAMINATED LIQUID) INFRASTRUCTURE BY REPLACING VERTICAL WELLS AND ADDING HORIZONTAL PIPING TO MINIMIZE EMISSIONS AND MAXIMIZE LANDFILL GAS AND LEACHATE COLLECTION

PAGE 70 ENTERPRISE FUNDS
Personnel Operating Debt Service Capital $17.2M $ 2.9M $ 7.9M $ –$ 6.4M
LANDFILL BUDGET BY CATEGORY
OPERATING BUDGET IMPACTS
REVENUES (CHARGES)
$1,257,760 increase in charges for rate increases to continue providing reliable services.
$18,914 increase in other charges: scrap metals, rentals, etc. due to demand in service.
TOTAL PERSONNEL
$61,490 increase primarily for normal wage and benefit adjustments.
$2,998 increase in part-time for wages to align with actuals.
PROFESSIONAL SERVICES
$102,272 increase primarily due to recycling disposal rates for hazardous materials at Household Hazardous Waste Facility.
$75,000 increase for composing a composting and feasibility study.
$75,000 increase for education and technology on a new a waste diversion program.
$30,955 decrease primarily due to the reduction of mailing advertising services.
$29,564 increase for temporary staffing services used to ensure we are in compliance with permit regulations.
$27,165 increase to align with actuals for credit card fee transactions.
RENTALS
$437,996 increase in internal fleet charges based on department use.
$37,111 increase due to a City-wide adjustment in internal technology rental charges for cyclic replacement, security, and network enhancements.
REPAIR & MAINTENANCE
$20,199 increase due to inflationary costs for repair and maintenance of equipment.
$10,898 increase for building maintenance of existing buildings.
SUPPLIES & MATERIALS
$51,000 increase due to inflationary for chemicals.
$24,120 increase due to increased fuel usage.
UTILITIES
$16,187 increase to align budgets to actual trends and inflationary adjustments.
LEASE PAYMENTS
$10,973 being reclassified from per government accounting rules as lease payments for multi-year operating expense contracts (printers, subscription software, rentals).
CAPITAL
$778,000 decrease is due to various timing of capital projects and purchasing of equipment.
CAPITAL PROGRAM
Sources User Fees
TOTAL CAPITAL SOURCES
Projects
Leachate Recirculation\Gas Infrastructure
Building and Site Improvements
Storm Water Management Improvements
Landfill Closure
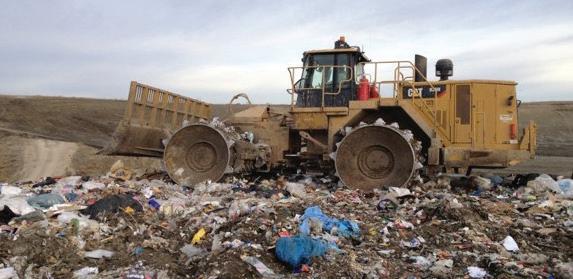
Land Acquisition
Perimeter Control and Fencing
PAGE 71 ENTERPRISE FUNDS
Equipment Material Handler Trash Pump TOTAL CAPITAL EQUIPMENT TOTAL CAPITAL PROGRAM 2024 Budget 6,355,000 $6,355,000 2,720,000 1,400,000 890,000 770,000 200,000 25,000 $6,005,000 300,000 50,000 $350,000 $6,355,000
TOTAL CAPITAL PROJECTS
EXPECTANCY MSW 2075
0 KEY STATISTICS 2022 Municipal Solid Waste (Tons) 211,251 Construction and Demolition (Tons) 118,290 Electronics (Lbs) 843,246 Household Hazardous Waste Incoming (Lbs) 760,990 LFG Sales ($) 1,272,579 2023 GARBAGE HAULER RECYCLING GOAL 2023 Budget 2024 Budget $ Change % Change Revenues Charges $11,097,678 $12,355,438 $1,257,760 11.3% License and Permits 30,250 30,250 - 0.0% Interest Income 80,000 80,000 - 0.0% Other (Scrap, Rentals) 138,086 157,000 18,914 13.7% Total Revenues $11,346,014 $12,622,688 $1,276,674 11.3% Expenses Fulltime Wages & Benefits $2,453,925 $2,515,415 $61,490 2.5% Part-time 260,000 260,000 - 0.0% Overtime 99,917 102,915 2,998 3.0% Total Personnel 2,813,842 2,878,330 64,488 2.3% Professional Services 2,095,991 2,374,191 278,200 13.3% Rentals 2,029,764 2,504,871 475,107 23.4% Repair & Maintenance 1,187,310 1,218,407 31,097 2.6% Supplies & Materials 904,532 977,432 72,900 8.1% Training & Education 26,228 26,228 - 0.0% Utilities 355,653 371,840 16,187 4.6% Other 450,000 450,000 - 0.0% Lease Payments - 10,973 10,973Total Other Operating 7,049,478 7,933,942 884,463 12.5% Capital 7,133,000 6,355,000 (778,000) -10.9% Bond/SRF Debt Service - - -Total Operating Expenses $16,996,320 $17,167,272 $170,952 1.0%
28 FULLTIME POSITIONS MAINTAIN AND/OR INCREASE LANDFILL LIFE
18.7%
WATER
OUR PURPOSE
The water department operates the facilities and infrastructure that collect, purify, and deliver potable water to our customers. Our team of 65 fulltime employees includes expertly trained lab analysts, state-certified water treatment operators, and professional crews who work around-the-clock to ensure access to exceptionally clean and safe water. In 2022, Sioux Falls used 8.18 billion gallons of water, a daily average of 22.4 million gallons (equal to 34 Olympic-sized swimming pools). Our water conservation efforts from 2003 to 2022 have helped reduce cumulative consumption by over 6.5 billion gallons.
OUR FOCUS
DELIVERING EXCEPTIONAL AND RELIABLE SERVICE TO MEET CURRENT AND FUTURE GROWTH DEMANDS SUPPORTED SOLELY BY USER FEES
ENSURE A STRONG WATER PURIFICATION AND DISTRIBUTION SYSTEM THROUGH CONTINUED INVESTMENT IN EXISTING INFRASTRUCTURE WHILE SUPPORTING THE NEEDS OF A GROWING COMMUNITY
COMMITMENT TO COST-EFFECTIVE MANAGEMENT OF AVAILABLE WATER RESOURCES BY PROMOTING WATER CONSERVATION
SECURE FUTURE WATER SUPPLY TO MEET DEMAND THROUGH MAXIMIZING OUR PARTNERSHIP WITH LEWIS AND CLARK REGIONAL WATER SYSTEM, DAKOTA MAINSTEM, AND EXPANDING EXISTING AQUIFER DEVELOPMENT

PAGE 72 ENTERPRISE FUNDS
Personnel Operating Debt Service Capital $44.9M $ 8.2M $ 14.4M $ 4.7M $ 17.5M
WATER BUDGET BY CATEGORY
3.1 MILES
2.3 BILLION
OPERATING BUDGET IMPACTS
CHARGES
$4,667,708 increase is due to an increase in rates and economic development.
STATE GRANT
$7,500,000 decrease is due to no grant in 2024.
TOTAL PERSONNEL
$596,464 increase is normal wage adjustments and addition of 1 locator position.
PROFESSIONAL SERVICES
$71,570 increase is primarily due to an increase in credit card and banking fees based on actual trends.
RENTALS
$130,901 increase due to technology rentals for cyclical replacement, security and network enhancements as well as fleet rental charges.
REPAIR & MAINTENANCE
$488,367 decrease is primarily due to timing of cyclical repairs.
SUPPLIES & MATERIALS
$173,797 increase is primarily due to price increases in chemicals.
UTILITIES
$656,391 increase is due to electrical rate increases.
CAPITAL
$8,184,517 decrease is due to normal fluctuations of capital projects.
BOND/SRF DEBT SERVICE
$695,000 increase is due to planned payment schedule of Lewis and Clark Bond.

Water
Water
Water
Source
Water
8.1 BILLION GALLONS
8.1
OF CLEAN WATER
WATER SAVED (ESTIMATED IN GALLONS) WITH CONSERVATION PROGRAM PER YEAR
69 FULLTIME POSITIONS
1
PAGE 73 ENTERPRISE FUNDS
SEWER PIPE REPL ACED/ADDED 3.4 MILES OF WATER MAIN REPLACED 3.6 MILES OF WATER MAIN EX TENSION
WATER ANNUALLY Sources User Fees Platting Fees TOTAL CAPITAL SOURCES Projects
BILLION GALLONS OF CLEAN
System Improvements—Streets
System Improvements—Water Rec
Main Projects
Building Improvements
Water
Water Improvements
Storage Improvements
Acquisition TOTAL CAPITAL PROJECTS Equipment Meters, AMR, DCU Field Equipment
Equipment Lab Equipment
Wells and Valve Operator Vehicles Pumps Generator Controls TOTAL CAPITAL EQUIPMENT TOTAL CAPITAL PROGRAM 2024 Budget CAPITAL PROGRAM $16,507,983 $1,020,000 $17,527,983 6,325,000 4,605,000 400,000 269,000 1,164,233 1,800,000 50,000 $14,613,233 2,200,000 69,750 190,000 150,000 80,000 95,000 100,000 30,000 $2,914,750 $17,527,983 2023 Budget 2024 Budget $ Change % Change Revenues Charges - User Fees $39,091,189 $43,758,897 $4,667,708 11.9% Misc. (Assessments, Rentals, Other) 1,309,000 1,309,000 - 0.0% State Grant 7,500,000 - (7,500,000) -100.0% Total Revenues $47,900,189 $45,067,897 $(2,832,292) -5.9% Expenses Fulltime Wages & Benefits $7,204,344 $7,800,808 $596,464 8.3% Part-time 205,544 205,544 - 0.0% Overtime 158,687 158,687 - 0.0% Total Personnel 7,568,575 8,165,039 596,464 7.9% Professional Services 1,552,721 1,624,291 71,570 4.6% Rentals 588,185 719,086 130,901 22.3% Repair & Maintenance 2,558,208 2,069,841 (488,367) -19.1% Supplies & Materials 8,066,141 8,239,938 173,797 2.2% Training & Education 84,864 84,864 - 0.0% Utilities 1,040,465 1,696,856 656,391 63.1% Lease Payments - 8,400 8,400Total Other Operating 13,890,584 14,443,276 552,692 4.0% Capital 25,712,500 17,527,983 (8,184,517) -31.8% Bond/SRF Debt Service 4,027,500 4,722,500 695,000 17.3% Total Expenditures $51,199,158 $44,858,798 $(6,340,361) -12.4%
Land
SCADA
VFD
WATER RECLAMATION
OUR PURPOSE
Personnel
Operating Debt Service Capital
$143.6M $ 7.4M $ 10.2M $ 15.8M $ 110.3M
The Sioux Falls regional water reclamation facility and its employees are dedicated to transporting and treating wastewater from Sioux Falls and surrounding communities. The treatment facility has a current rated average daily flow capacity of 21 million gallons mgd and a peak flow capacity of 35 mgd. Its team of professionals are responsible for meeting state-regulated surface water discharge permit conditions to keep wastewater discharged at required regulatory compliance standards.
An average of over 7 billion gallons annually are transported and treated at the facility, where 1,000 miles of sanitary sewer system and over 500 miles of storm sewer system are maintained by the team.
OUR FOCUS
DELIVERING RELIABLE SERVICE TO MEET CURRENT AND FUTURE GROWTH DEMANDS SUPPORTED SOLELY BY USER FEES
ENSURE THE CITY’S DEVELOPMENT NEEDS FOR WASTEWATER TRANSPORT AND TREATMENT BY MAINTAINING ADEQUATE TREATMENT FACILITY CAPACITY AND EXPANDING DEVELOPMENT OF NEW SEWER BASINS FOR DEVELOPMENT AND GROWTH

CONSTRUCT THE LARGEST EXPANSION PROJECT IN SIOUX FALLS REGIONAL WATER RECLAMATION HISTORY. CONSTRUCTION OVER THE NEXT DECADE WILL ASSIST WITH THE GROWTH AND DEVELOPMENT OF SIOUX FALLS OVER THE NEXT 20 YEARS.
DESIGN AND CONSTRUCT INTERCEPTOR SEWERS AND PUMP STATIONS FOR NEW DEVELOPMENT BASINS
CONTINUE TO MAINTAIN EXISTING INFRASTRUCTURE AND COLLABORATE WITH OTHER CITY DEPARTMENTS TO ENSURE THE WATER RECLAMATION SYSTEM SUPPORTS FUTURE GROWTH DEMANDS
PLAN FOR FUTURE TREATMENT AND COLLECTION SYSTEM NEEDS TO KEEP PACE WITH CITY GROWTH
PAGE 74 ENTERPRISE FUNDS
WATER RECLAMATION BUDGET BY CATEGORY
FULLTIME POSITIONS
57
OPERATING BUDGET IMPACTS
CHARGES
$4,256,593 increase due to an increase in rates and economic development.
STATE REVOLVING LOANS/ CONTRIBUTIONS
$69,845,000 increase due timing of phases of expansion project, pump station improvements and basin expansions.
TOTAL PERSONNEL
$626,181 increase is due to wage and benefit adjustments and 1 new controls tech position.
PROFESSIONAL SERVICES
$22,023 increase is due to testing in the Biosolids program and legal fees.

RENTALS
$161,066 increase due to Fleet Rentals and Technology rental charges for cyclical replacements, security and network enhancements.
REPAIR & MAINTENANCE
$165,309 decrease is due to adjustments in maintenance projects at the plant.
SUPPLIES & MATERIALS
$411,761 is primarily due to price increases in treatment chemicals.
UTILITIES $190,405 increase is primarily electric costs.
CAPITAL $76,358,600 increase is primarily due to pump stations and basin expansions or improvements.
GALLONS OF TREATED WASTEWATER PER YEAR
190
6.1 B 1
MILES OF COLLECTION SYSTEM CLEANED PER YEAR MANHOLE COVERS REPLACED PER YEAR
CAPITAL PROGRAM
200
Sources
User Fees Contributions
State Loans
TOTAL CAPITAL SOURCES
Projects
Pump Station Improvements
2024 Budget
Sanitary Sewer Improvements—Street Projects
Septage Receiving Station
Basin Extensions/Improvements
Sanitary Sewers—Other Mains
Facility Expansion/Building Improvements
Interceptors Replacements/Infiltration
Pipe Lining/Manhole Rehab Land
TOTAL CAPITAL PROJECTS
Equipment
15,930,500 4,270,600 90,074,000 $110,275,100 65,465,600 1,704,000 4,050,000 27,387,000 2,000,000 7,751,000 75,000 369,500 103,000 $108,905,100 310,000
PAGE 75 ENTERPRISE FUNDS
Trucks, Trailers,
Small Equipment TOTAL CAPITAL EQUIPMENT TOTAL CAPITAL PROGRAM
& Heavy Equipment
2023 Budget 2024 Budget $ Change % Change Revenues Charges - User Fees $38,894,629 $43,151,222 $4,256,593 10.9% State Revolving Loans (SRF) 24,499,000 94,344,000 69,845,000 285.1% Special Assessments 2,044,350 2,044,350 - 0.0% Interest Earnings 255,194 255,194 - 0.0% Other 53,000 53,000 - 0.0% Total Revenues $65,746,173 $139,847,766 $74,101,593 112.7% Expenses Fulltime Wages & Benefits $6,348,975 $6,975,156 $626,181 9.9% Part-time 123,100 133,100 10,000 8.1% Overtime 215,178 260,000 44,822 20.8% Total Personnel 6,687,253 7,368,256 681,003 10.2% Professional Services 966,063 988,086 22,023 2.3% Rentals 1,006,133 1,167,199 161,066 16.0% Repair & Maintenance 1,755,201 1,589,892 (165,309) -9.4% Supplies & Materials 1,850,953 2,262,714 411,761 22.2% Training & Education 59,670 60,863 1,193 2.0% Utilities 2,377,902 2,568,308 190,405 8.0% Other 1,500,000 1,500,000 - 0.0% Lease Payments 16,200 16,200Total Other Operating 9,515,922 10,153,261 637,339 6.7% Capital 33,916,500 110,275,100 76,358,600 225.1% Bond/SRF Debt Service 15,780,785 15,780,785 - 0.0% Total Expenditures $65,900,460 $143,577,402 $77,676,942 117.9%
1,060,000 $1,370,000 $110,275,100
PUBLIC PARKING
OUR PURPOSE
Public Parking provides safe, sufficient, and convenient downtown parking for employees, customers, and visitors. It is an essential part of an infrastructure that supports the area’s long-term economic development. The division operates and manages almost 4,000 on- and off-street parking spaces, including 6 parking ramps, 10 surface lots, and 866 metered parking spaces throughout downtown.
OUR FOCUS
SUPPORT DOWNTOWN BUSINESSES, RETAILERS, AND EVENTS WITH AVAILABLE AND CONVENIENT ON-AND OFF-STREET PARKING SPACES FOR SHORT-AND LONGTERM PARKING
CONSTANTLY REVIEW AND ASSESS THE NEEDS OF DOWNTOWN PARKING, INCLUDING PICK-UP/DROP-OFF SPOTS, DIAGONAL PARKING WHERE APPROPRIATE, AND EXPANDED ENFORCEMENT HOURS OF DOWNTOWN PARKING AND METERS
CONTINUE MAINTENANCE IMPROVEMENTS TO PROVIDE SAFE PARKING WHILE PROTECTING THE CITY’S INVESTMENTS LONG-TERM
CREATE A BETTER CUSTOMER EXPERIENCE BY HARNESSING TECHNOLOGY TO CREATE EFFICIENCIES AND CONVENIENT PAYMENT OPTIONS
DEVELOP AN EFFECTIVE COMMUNICATIONS STRATEGY TO PROVIDE A BETTER CUSTOMER EXPERIENCE ON SHOWCASING RELEVANT PARKING INFORMATION INCLUDING MARKETING, PARTNERING WITH BUSINESSES, AND UTILIZING TECHNOLOGY THAT HELP PEOPLE FIND AVAILABLE SPACES
PAGE 76 ENTERPRISE FUNDS
$ 0.1M
Personnel Operating Debt Service Capital $3.4M $ 0.8M $ 0.9M $ 1.7M
PUBLIC PARKING
BUDGET BY CATEGORY
OPERATING BUDGET IMPACTS
REVENUES
$65,636 increase in charges based on trends and rate adjustments.
TOTAL PERSONNEL
$67,011 decrease due to turnover and re-allocation of wages due to restructuring.
PROFESSIONAL SERVICES
$36,000 increase in security based on trends and adjustments.
$10,000 increase in credit card & bank fees based on trends and adjustments.
9 FULLTIME POSITIONS
2,917
71% PERCENTAGE OF AVAILABLE OFF-STREET PARKING LEASED AS OF DEC. 31, 2024
$2,961 increase due to a City-wide adjustment in internal property liability and risk charges.
RENTALS
$10,970 increase due to a City-wide adjustment in internal technology rental charges for cyclic replacement, security, and network enhancements.
SUPPLIES & MATERIALS
$300 increase for software adjustments.
UTILITIES
$6,651 increase based on utility usage and rate trends.
LEASE PAYMENTS
$1,504 being reclassified per government accounting rules as lease payments for multiyear operating expense contracts (printers, subscription software, rentals).
CAPITAL
$100,000 decrease based on timing of capital projects and equipment purchases.
DEBT
$77,233 increase due to planned payment schedule of parking ramp bond.
6 RAMPS
0 10 LOTS PARKING SPACES
CAPITAL PROGRAM
Sources User Fees
TOTAL CAPITAL SOURCES
Capital Projects
Parking Lot & Ramp Improvements
3,944 866
TOTAL CAPITAL PROGRAM
TOTAL CAPITAL EQUIPMENT
TOTAL CAPITAL PROGRAM
2024 Budget 65,000 $65,000 65,000 $65,000 $65,000 $65,000
PAGE 77 ENTERPRISE FUNDS
TOTAL OFF-STREET PUBLIC SPACES NUMBER OF METERS 2023 Budget 2024 Budget $ Change % Change Revenues Charges $2,664,496 $2,730,132 $65,636 2.5% Fines 534,335 534,335 - 0.0% Other (Interest, Miscellaneous) 8,500 8,500 - 0.0% Total Revenues $3,207,331 $3,272,967 $65,636 2.0% Expenses Fulltime Wages & Benefits $838,355 $771,344 $(67,011) -8.0% Part-time 7,000 7,000 - 0.0% Overtime 3,000 3,000 - 0.0% Total Personnel 848,355 781,344 (67,011) -7.9% Professional Services 281,814 331,201 49,386 17.5% Rentals 38,144 47,750 9,606 25.2% Repair & Maintenance 245,225 245,225 - 0.0% Supplies & Materials 104,626 104,926 300 0.3% Training & Education 3,500 3,500 - 0.0% Utilities 118,181 124,832 6,651 5.6% Other 8,000 8,000 - 0.0% Lease Payments - 1,504 1,504Total Other Operating 799,490 866,937 67,447 8.4% Capital 165,000 65,000 (100,000) -60.6% Debt 1,575,232 1,652,465 77,233 4.9% Total Operating Expenses $3,388,077 $3,365,746 $(22,331) -0.7%
FLEET MANAGEMENT FUND
OUR PURPOSE
A team of 26 proactively manages the citywide fleet operations, maintaining over 1,800 pieces of equipment and four major fuel sites. The division’s primary responsibility is to ensure maximum uptime through proactive maintenance plans, utilizing technology to gather data that supports timely maintenance. This approach allows the city to oversee vehicle utilization, improve efficiency, and ensure consistency across the citywide fleet.

OUR FOCUS
ENCOURAGE DEPARTMENT COLLABORATION IN SHARING EQUIPMENT AND REDUCE COSTS CITYWIDE
PROACTIVELY MAINTAIN EQUIPMENT UTILIZING TRADITIONAL METHODS AND DATA TO EXTEND THE LIFE, EXPAND THE USEFULNESS, AND MAINTAIN THE FLEET’S RESALE VALUE
REDUCE ENVIRONMENTAL IMPACTS AND CITYWIDE COST SAVINGS BY RESEARCHING AND PILOTING NEXT-GENERATION VEHICLES (ELECTRIC AND HYBRID) IN OUR FLEET WHERE SUITABLE
LEAD CENTRALIZED EFFORTS TO STRATEGICALLY REPLACE EQUIPMENT WITH “USEFUL LIFE” AS A STARTING POINT BUT SHIFTING STRATEGY TO MORE DATADRIVEN DECISIONS
ENSURE EFFECTIVE AND EFFICIENT FUEL MANAGEMENT BY UTILIZING TECHNOLOGY TO CAPTURE DATA FROM VEHICLES AND WORKING WITH DEPARTMENTS
MAINTAIN FOUR SAFE AND RELIABLE FUEL SITE LOCATIONS FOR USE BY CITY WORKERS AND COMMUNITY PARTNERS. THE CAPITAL PROGRAM INCLUDES REPLACEMENT OF MULTIPLE AGING TANKS IN THE NEXT 5 YEAR CAPITAL PLAN
PAGE 78 INTERNAL SERVICE FUNDS
Personnel Operating Debt
Service Capital
$15.1M $ 3.3M $ 7.4M $ –$ 4.4m
FLEET MANAGEMENT FUND
OPERATING BUDGET BY CATEGORY
CITYWIDE CENTRALIZATION OF EQUIPMENT
MANAGE OVER
1,800 PIECES OF EQUIPMENT
OPERATING BUDGET IMPACTS
REVENUE (CHARGES)
$2,101,144 increase in the amount charged to the departments for repairs, maintenance, and replacement costs of equipment leased to the departments.
TOTAL PERSONNEL
$183,737 increase primarily for normal wage and benefit adjustments.
PROFESSIONAL SERVICES
$12,629 increase due to a City-wide adjustment in internal property and liability insurance charges.
RENTALS
$42,876 increase due to a City-wide adjustment in internal technology primarily for security and fleet cyclic replacement charges.
REPAIR & MAINTENANCE
$54,395 increase to align with trends in fleet vehicle repairs.
SUPPLIES AND MATERIALS
$35,943 decrease in technology expenses due to an upgrade in fuel system.
LEASE PAYMENTS
$2,812 being reclassified from per government accounting rules as lease payments for multi-year operating expense contracts (printers, subscription software, rentals).
CAPITAL $3,316,900 decrease is due to the cyclic timing of purchasing of equipment.
IN 2022,
1.2 MILLION GALLONS OF FUEL
WERE TRANSACTED FROM THE CITY FUEL ISLANDS
CAPITAL
Sources
Service Fees
TOTAL CAPITAL SOURCES
Projects
Underground Storage Tanks
TOTAL CAPITAL PROJECTS
Equipment
Large Equipment—Streets
26 FULLTIME POSITIONS
0
Budget
Large Equipment—Water Reclamation
Large Equipment—Storm Drainage
Trucks and Pickups
Sedans, SUV and Vans
Crane
TOTAL CAPITAL EQUIPMENT
TOTAL CAPITAL PROGRAM
$4,430,500 458,000 $458,000 2,215,000 325,000 280,000 867,500 245,500 40,000 $3,972,500 $4,430,500
PAGE 79 INTERNAL SERVICE
FUNDS
2024
PROGRAM 4,430,500
2023 Budget 2024 Budget $ Change % Change Revenues Charges - Service Fees $15,180,346 $17,281,490 $2,101,144 13.8% Miscellaneous 504,500 504,500 - 0.0% Other 290,000 290,000 - 0.0% Total Revenues $15,974,846 $18,075,990 $2,101,144 13.2% Expenses Fulltime Wages & Benefits $2,707,158 $2,890,895 $183,737 6.8% Part-time 286,566 286,566 - 0.0% Overtime 160,000 160,000 - 0.0% Total Personnel 3,153,724 3,337,461 183,737 5.8% Professional Services 141,785 154,414 12,629 8.9% Rentals 120,875 163,751 42,876 35.5% Repair & Maintenance 1,458,457 1,512,852 54,395 3.7% Supplies & Materials 5,585,060 5,549,117 (35,943) -0.6% Training & Education 16,407 16,407 - 0.0% Utilities 42,466 42,466 - 0.0% Lease Payments 2,812 2,812Total Other Operating 7,365,050 7,441,819 76,769 1.0% Capital 7,747,400 4,430,500 (3,316,900) -42.8% Debt Service - - -Total Operating Expenses $18,266,174 $15,209,780 $(3,056,394) -16.7%
HEALTH BENEFITS FUND
OUR PURPOSE
The City maintains a self-insured benefits plan. The internal service Health/Life Benefit Fund provides employee health and dental care along with limited, employee only, life insurance. This fund is self-supported through premiums collected. The City contributes 75% and the employee 25% of the total premium covering more than 3,200 lives.
OUR FOCUS
INVEST IN EMPLOYEE WELLNESS PROGRAMS THAT SUPPORT A HEALTHY EMPLOYEE AND FAMILY
MINIMIZE THE IMPACTS OF INSURANCE PREMIUMS BY ESTABLISHING “HEALTHY” RESERVES

ENSURE COMPETITIVE HEALTH AND DENTAL CARE BENEFITS FOR OUR EMPLOYEES
OPERATING BUDGET BY CATEGORY
OPERATING BUDGET IMPACTS
REVENUE CHARGES
$1,220,794 increase is to cover current claims experience as well as fund an adequate reserve for future claims.
PROFESSIONAL SERVICES
$50,841 increase primarily related for inflationary adjustments for claims processing, network fees, stop loss insurance premiums, and actuarial services.
OTHER $746 increase is based on normal inflationary adjustments and budget to actual trends.
PAGE 80 INTERNAL SERVICE FUNDS
2023 Budget 2024 Budget $ Change % Change Revenues Charges $27,668,440 $28,889,234 $1,220,794 4.4% Interest Earned 100,000 100,000 - 0.0% Total Revenues $27,768,440 $28,989,234 $1,220,794 4.4% Expenses Fulltime Wages & Benefits $178,883 $240,369 $61,486 34.4% Part-time - - -Overtime - - -Total Personnel 178,883 240,369 61,486 34.4% Professional Services 2,107,891 2,158,732 50,841 2.4% Supplies & Materials - - -Training & Education 2,275 1,625 (650) -28.6% Utilities - - -Other 10,220 11,616 1,396 13.7% Total Other Operating 2,120,386 2,171,973 51,587 2.4% Total Benefit Payments 22,651,138 22,651,138 - 0.0% Total Operating Expenses $24,950,407 $25,063,480 $113,073 0.5%
WORKER’S COMPENSATION FUND
OUR PURPOSE
The City manages an internal service Workers’ Compensation fund to self-insure injury by accident claims and mitigate risk through safety programs. This fund provides support to employees who are injured in the course and scope of their job by covering lost wages, medical expenses and ensuring appropriate, timely and safe return-to-work.
OUR FOCUS
SUPPORT EMPLOYEES BY PROVIDING SUFFICIENT MEDICAL CARE AND REHABILITATION SERVICES TO INJURED WORKERS AND ENSURING AN APPROPRIATE AND TIMELY SAFE RETURN-TO-WORK
UTILIZE DATA AND INFORMATION FROM OUR THIRD-PARTY ADMINISTRATOR TO TARGET AND DEVELOP EFFECTIVE SAFETY PROGRAMS, EDUCATE DEPARTMENTS, AND ULTIMATELY INCREASE SAFETY FOR OUR EMPLOYEES

PROTECT THE CITY FROM LOSS RISK BY ENSURING PRUDENT INSURANCE COVERAGE AND ESTABLISHING ADEQUATE RESERVES
OPERATING BUDGET BY CATEGORY
OPERATING BUDGET IMPACTS
PERSONNEL
$19,375 decrease due to normal wage and benefit adjustments.
PROFESSIONAL SERVICES
$58,550 increase due to normal inflationary adjustments for insurance premiums.
PAGE 81 INTERNAL SERVICE
FUNDS
TOTAL
2023 Budget 2024 Budget $ Change % Change Revenues Charges $1,567,884 $1,567,884 $ - 0.0% Interest Income 5,000 5,000 - 0.0% Total Revenues $1,572,884 $1,572,884 $ - 0.0% Expenses Fulltime Wages & Benefits $183,542 $164,167 $(19,375) -10.6% Part-time 3,500 3,500 - 0.0% Overtime - - -Total Personnel 187,042 167,667 (19,375) -10.4% Professional Services 433,568 492,118 58,550 13.5% Rentals 300 300 - 0.0% Supplies & Materials 91,650 91,650 - 0.0% Training & Education 6,900 6,900 - 0.0% Utilities - - -Total Other Operating 532,418 590,968 58,550 11.0% Total Benefit Payments 900,000 900,000 - 0.0% Total Operating Expenses $1,619,460 $1,658,635 $39,175 2.4%
RISK MANAGEMENT FUND
OUR PURPOSE
The City manages an internal service Property Liability and Risk fund to protect the City’s assets by providing protection in the event of a property or liability loss, as well as to identify and eliminate loss exposures that could result in severe financial impact and impair the City’s ability to provide essenial public services.
OUR FOCUS
IDENTIFY, MITIGATE OR ELIMINATE LOSS EXPOSURES THAT COULD RESULT IN SEVERE FINANCIAL IMPACT
PROTECT THE CITY’S ASSETS BY PROVIDING PROPER COVERAGE THROUGH A COMBINATION OF TRADITIONAL INSURANCE OR THE INSURANCE POOL AND ESTABLISHING ADEQUATE RESERVES TO LIMIT THE IMPACT OF AN EVENT ON DIRECT CITY SERVICES
OPERATING BUDGET BY CATEGORY
MAJOR OPERATING BUDGET IMPACTS
CHARGES
$190,000 increase is to ensure adequate balances to limit risk impacts and keep up with service needs. This increase is allocated back to the departments based on a risk and cost share basis.

TOTAL PERSONNEL
$41,564 increase is primarily for normal inflationary costs for wages and benefits.
PROFESSIONAL SERVICES
$374,400 increase is primarily for normal inflationary costs and claims processing.
PAGE 82 INTERNAL SERVICE
FUNDS
REVENUE
2023 Budget 2024 Budget $ Change % Change Revenues Charges $1,980,000 $2,160,000 $180,000 9.1% Interest Income 10,000 10,000 - 0.0% Total Revenues $1,990,000 $2,170,000 $180,000 9.0% Expenses Fulltime Wages & Benefits $186,503 $228,067 $41,564 22.3% Part-time - - -Overtime - - -Total Personnel 186,503 228,067 41,564 22.3% Professional Services 1,870,080 2,244,480 374,400 20.0% Rentals 600 600 - 0.0% Supplies & Materials 11,000 23,500 12,500 113.6% Training & Education 7,825 7,825 - 0.0% Utilities - - -Total Other Operating 1,889,505 2,276,405 386,900 20.5% Total Liability Claims 225,000 220,000 (5,000) -2.2% Total Operating Expenses $2,301,008 $2,724,472 $423,464 18.4%
ENTERPRISE NETWORK TECHNOLOGY FUND OUR PURPOSE


The fund provides a sustainable and strategic approach to maintaining, upgrading, and replacing technology hardware and software citywide. The fund allows the City to invest in the fast changing demands of technology and ensure the network is secure and reliable.
OUR FOCUS

PROTECT THE CITY BY ENSURING ADEQUATE FUND BALANCE TO MEET THE FAST-CHANGING DEMANDS OF TECHNOLOGY SECURITY


PROVIDE A STRATEGIC, CONSISTENT, AND COORDINATED APPROACH TO MAINTAINING, UPGRADING, AND REPLACING SOFTWARE AND EQUIPMENT


LEVERAGING TECHNOLOGY BY FOCUSING ON UTILIZATION AND IMPROVING BUSINESS PROCESSES


BUDGET BY CATEGORY

OPERATING BUDGET IMPACTS
REVENUES
$1,683,123 increase is to ensure technology equipment, security, enterprise systems and network infrastructure are effectively replaced, maintained, and upgraded.
TOTAL OPERATING EXPENSES


$59,870 decrease is primarily related to a shift in priorities from new technologies to backbone and infrastructure expansion and upgrades.
CAPITAL PROGRAM

2024 Budget


PAGE 83 INTERNAL SERVICE FUNDS
Sources Enterprise Network System Fees TOTAL CAPITAL SOURCES Equipment Server, Blade, Storage Switches, Routers, & Equipment Wireless Network Infrastructure TOTAL CAPITAL PROGRAM
875,000
2023 Budget 2024 Budget $ Change % Change Revenues Charges for Goods & Services $5,003,746 $6,684,869 $1,681,123 33.6% Other (Interst and County Contribution) 176,000 178,000 2,000 1.1% Total Revenues $5,179,746 $6,862,869 $1,683,123 32.5% Expenses Fulltime Wages & Benefits $ - $ - $ -Part-time - - -Overtime - - -Total Personnel - - -Professional Services 1,465,000 1,591,251 126,251 8.6% Rentals 50,000 43,000 (7,000) -14.0% Repair and Maintenance - - -Supplies & Materials 3,946,750 2,491,206 (1,455,544) -36.9% Training & Education - - -Utilities 15,000 15,000 - 0.0% Lease Payments - 1,276,423 1,276,423Total Other Operating 5,476,750 5,416,880 (59,870) -1.1% Total Capital Equipment 1,400,000 1,400,000 - 0.0% Total Operating Expenses $6,876,750 $6,816,880 $(59,870) -0.9%
1,400,000 $1,400,000
375,000 150,000 $1,400,000
CENTRALIZED FACILITIES FUND


OUR PURPOSE
Centralized Facilities coordinates the maintenance, improvement, and expansion of city-owned facilities. This internal service fund supports a sustainable and strategic approach to investing in 48 city-owned properties (totaling over 1 million square feet), while planning for future needs.
OUR FOCUS
INVEST IN THE LONGEVITY, USEFULNESS, AND SAFETY OF EACH BUILDING
EFFICIENT AND EFFECTIVE USE OF EACH FACILITY TO DELIVER PUBLIC SERVICES
A COORDINATED AND COLLABORATIVE APPROACH TO USING, MAINTAINING, AND SHARING SPACE
SCALE FOR GROWTH BY EXPANDING FOOTPRINTS WHEN APPROPRIATE
CREATE A POSITIVE EMPLOYEE AND CUSTOMER EXPERIENCE
PAGE 84 INTERNAL SERVICE FUNDS
Personnel Operating Debt Service Capital $9.5M $ 2.6m $ 5.3m $ –$ 1.7M
CENTRALIZED FACILITIES FUND
31 FULLTIME POSITIONS
BUDGET BY CATEGORY MANAGE 48 CITY-OWNED PROPERTIES MAINTAINED BY FACILITIES MANAGEMENT TOTALING MORE THAN
3
OPERATING BUDGET IMPACTS
REVENUES
$798,500 increase in department chargebacks split between the Facilities, Fire, Parks & Rec, and Libraries Departments to fund upcoming projects and ongoing maintenance.
WAGES & BENEFITS
$484,726 increase for normal fulltime wages and benefits adjustments and the addition of 3 new positions to support the Public Safety Center.
RENTALS
$24,121 increase due to a City-wide adjustment in internal technology rental charges for cyclic replacement, security, and network enhancements.
1 MILLION SQ. FT.
$60,000 offset due to reclassification of rentals as lease payments per government accounting rules for multi-year operating expense contracts.
REPAIR & MAINTENANCE
$35,000 increase to begin care and maintenance of newly opened Public Safety Training Center. $9,000 decrease based on timings of projects and cyclical maintenance.
SUPPLIES & MATERIALS
$10,000 increase for custodial supplies at the Public Safety Training Center.
UTILITIES
$140,000 increase for new utilities at the Public Safety Training Center.
$29,203 increase based on utility usage and rate trends.
LEASE PAYMENTS
$79,661 being reclassified per government accounting rules as lease payments for multi-year operating expense contracts (printers, subscription software, rentals).
CAPITAL
$3,239,000 decrease based on timing of projects and purchases of equipment.
& CAPITAL PLAN*
2024 Cyclic Maintenance: Interior $319,000 Exterior $575,000 Concrete, Block & Pavement $190,000 Remodels $1,000,000
2024 Capital Program: Projects $1,425,000
Concrete, Block, & Pavement $325,000 HVAC $100,000 Generators $200,000
Fencing & Landscaping $800,000
Equipment $238,000
Total Capital Program $1,663,000
*Projects are subject to change based on priority needs.
PAGE 85 INTERNAL SERVICE
FUNDS
CYCLIC MAINTENANCE, REMODELS
2024 2025 2026 Core Facilities City Hall Windows, Sidewalks, and Curb City Hall Restrooms & Plumbing City Hall Restrooms & Plumbing Fire Fire Station #1 Second Floor Remodel; Fire Station #3/HQ Generator Replacement Fire Headquarters Remodel Fire Station #8 Remodel Police LEC Remodel LEC Security Fence & Landscape LEC Remodel; LEC Security Fence & Landscape LEC Remodel; LEC Security Fence & Landscape Streets Traffic Building HVAC Equipment Bay Siding Replacement Parks & Recreation Parks Main Campus Study Parks Main Campus Expansion & Improvements Parks Main Campus Expansion & Improvements Libraries Oak View Branch Entrance Updates; Downtown Renovations Caille Branch Remodel Downtown Renovations HVAC Replacements Downtown Renovations 2023 Budget 2024 Budget $ Change % Change Revenues County Support $105,000 $77,000 $(28,000) -26.7% Charges 5,790,100 6,588,600 798,500 13.8% Transfer from General Fund 1,000,000 1,000,000 - 0.0% Transfer from Sales Tax Fund 1,600,000 1,438,703 (161,297) -10.1% Total Revenues $8,495,100 $9,104,303 $609,203 7.2% Expenses Fulltime Wages & Benefits $1,997,597 $2,482,323 $484,726 24.3% Part-time 36,624 36,624 - 0.0% Overtime 41,910 41,910 - 0.0% Total Personnel 2,076,131 2,560,857 484,726 23.3% Professional Services 103,250 103,250 - 0.0% Rentals 290,196 253,515 (36,681) -12.6% Repair & Maintenance 3,181,959 3,207,931 25,972 0.8% Supplies & Materials 244,432 253,407 8,975 3.7% Training & Education 4,480 4,480 - 0.0% Utilities 1,234,135 1,403,338 169,203 13.7% Other 1,500 1,500 - 0.0% Lease Payments - 79,661 79,661Total Other Operating 5,059,952 5,307,083 247,131 4.9% Capital 4,902,000 1,663,000 (3,239,000) -66.1% Total Operating Expenses $12,038,084 $9,530,940 $(2,507,144) -20.8%
PENSION & HEALTHCARE TRUST FUNDS OPERATING BUDGET BY CATEGORY
In addition to participating in the South Dakota Retirement System, the City also manages its own pension fund for employees hired prior to July 2013. Both the City and State plans are 100% funded with moderate to conservative actuarial assumptions, making both plans some of the best in the nation.
PAGE 86 INTERNAL SERVICE FUNDS
Employees Retirement System Budget Overview 2023 Budget 2024 Budget $ Change % Change Revenues Contributions $11,844,723 $12,631,490 $786,767 6.6% Investment Income 42,650,000 38,550,000 (4,100,000) -9.6% Total Revenues $54,494,723 $51,181,490 $(3,313,233) -6.1% Expenses Fulltime Wages & Benefits $161,936 $193,500 $31,564 19.5% Part-time - - -Overtime - - -Total Personnel 161,936 193,500 31,564 19.5% Professional Services 1,536,781 1,876,135 339,354 22.1% Supplies & Materials 200 200 - 0.0% Training & Education 550 550 - 0.0% Total Other Operating 1,537,531 1,876,885 339,354 22.1% Total Benefit Payments 34,679,003 36,808,730 2,129,727 6.1% Total Operating Expenses $36,378,470 $38,879,115 $2,500,645 6.9% Firefighters’ Pension Budget Overview 2023 Budget 2024 Budget $ Change % Change Revenues Contributions $4,612,391 $5,121,926 $509,535 11.0% Investment Income 15,300,000 13,900,000 (1,400,000) -9.2% Total Revenues $19,912,391 $19,021,926 $(890,465) -4.5% Expenses Fulltime Wages & Benefits $103,740 $120,801 $17,061 16.4% Part-time - - -Overtime - - -Total Personnel 103,740 120,801 17,061 16.4% Professional Services 609,095 715,872 106,777 17.5% Supplies & Materials 250 250 - 0.0% Training & Education 1,725 1,725 - 0.0% Total Other Operating 611,070 717,847 106,777 17.5% Total Benefit Payments 11,418,867 12,044,102 625,235 5.5% Total Operating Expenses $12,133,677 $12,882,750 $749,073 6.2% 115 Healthcare Trust Budget Overview 2023 Budget 2024 Budget $ Change % Change Revenues Investment Income $ - $ - $ -Total Revenues $ - $ - $ -Expenses Total Benefit Payments $204,000 $204,000 $ - 0.0% Total Operating Expenses $204,000 $204,000 $ - 0.0%
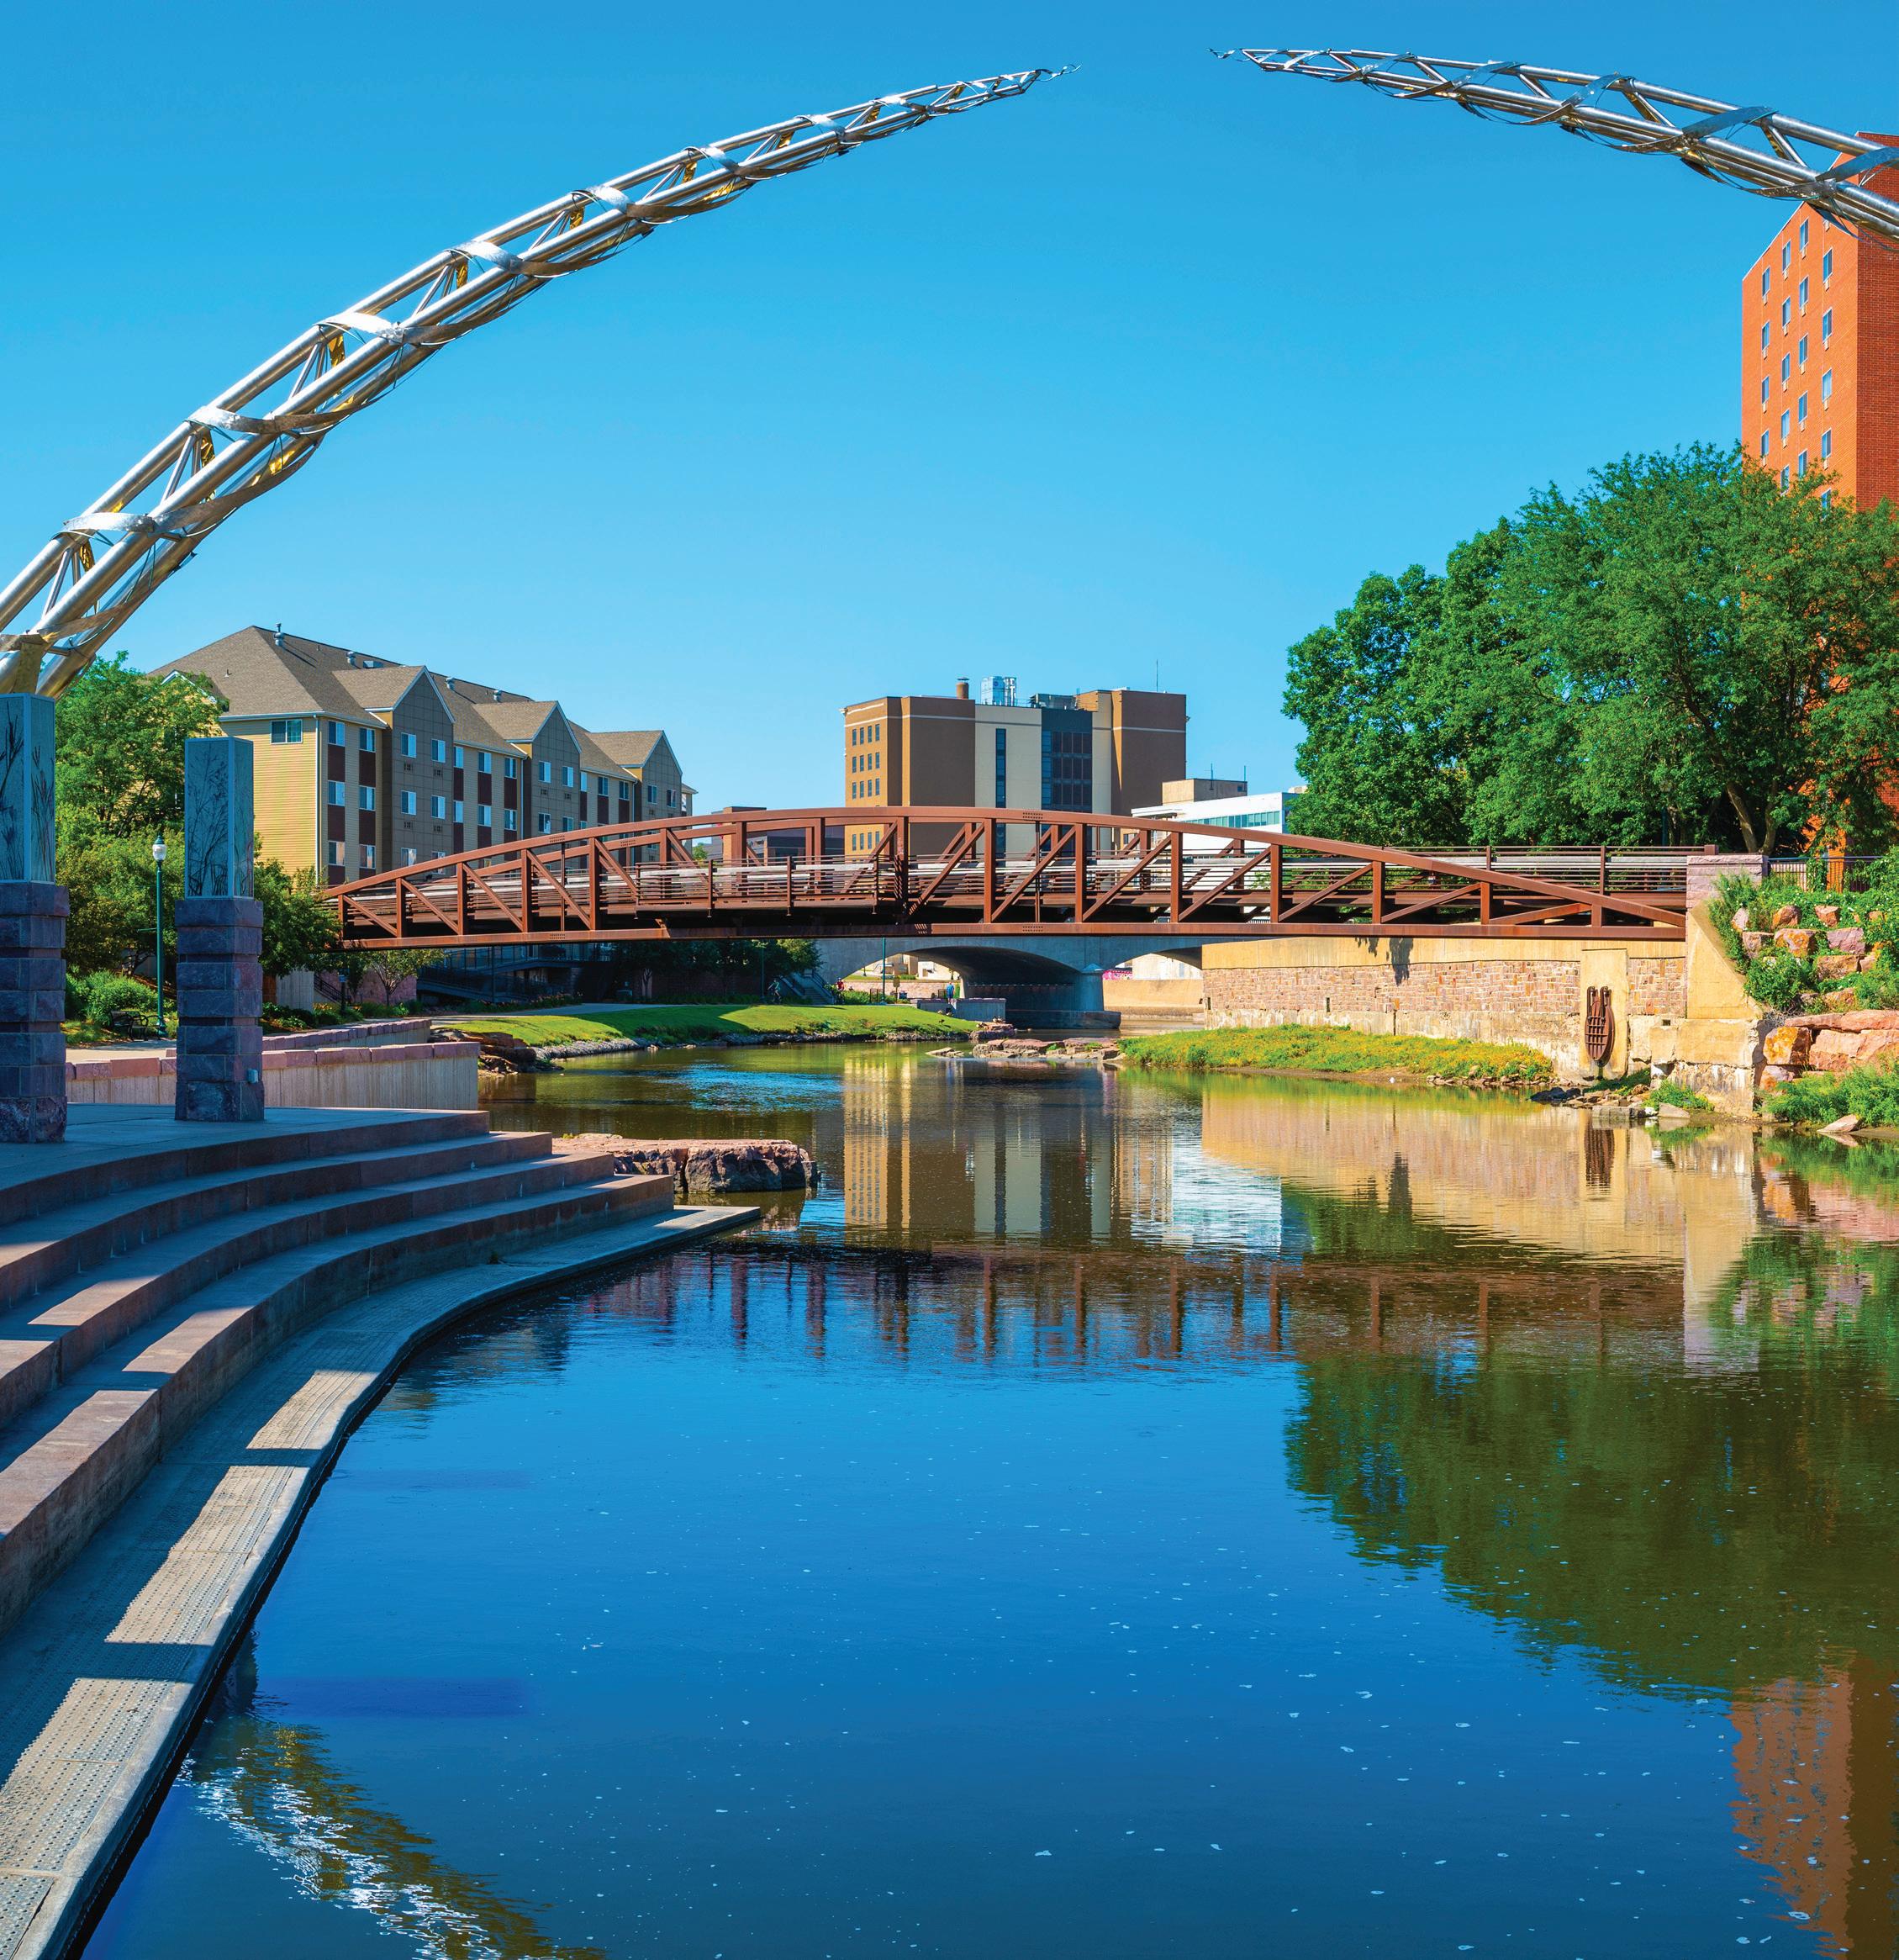
PAGE 87 2024 BUDGET EXHIBITS
City of Sioux Falls 2024 Mayor's Recommended Budget
The Mayor's Budget Message, the 2024 Budget, and the 2024–2028 Capital Program are available for inspection by the public during regular hours of operation at:
▪City of Sioux Falls Website (www.siouxfalls.org/finance)
▪Downtown Public Library–200 North Dakota Avenue

Expenditures Summary
PAGE 88 / BUDGET RESOLUTION AND ORDINANCE
Governmental Funds by Function General Capital Improvement Other Fund Sales/Use Tax Fund Funds Total ▪Mayor's Office–City Hall, 224 West Ninth Street General Government ▪City Council Office/City Clerk's Office–235 West Tenth Street Mayor 942,416 $ - $ - $ 942,416 $ ▪Finance Office–City Hall, 224 West Ninth Street City Council 1,981,895 - - 1,981,895 City Attorney's Office 2,814,141 - - 2,814,141 Summary of Tax Revenue Human Resources 2,386,556 - - 2,386,556 Property Tax 85,049,435 $ Finance 4,353,693 - - 4,353,693 Sales/Use Tax Facilities Management 2,309,598 560,000 - 2,869,598 General Tax 97,617,614 Innovation and Technology 6,854,125 - - 6,854,125 Capital Improvement Tax 98,551,436 Communications 3,163,708 160,000 - 3,323,708 Entertainment Tax 11,558,160 Total General Government 24,806,132 720,000 - 25,526,132 Lodging Tax 1,600,000 BID Tax 2,385,000 Public Safety Tax Increment Financing (T.I.F.) 8,285,000 Fire 37,267,511 3,127,000 - 40,394,511 Frontage Tax Police 52,438,485 1,444,100 2,000 53,884,585 Street Maintenance Tax 5,095,697 Total Public Safety 89,705,996 4,571,100 2,000 94,279,096 21st Street Boulevard Tax 3,650 Storm Drainage Tax 13,517,970 Highways and Streets Amusement Tax 13,500 Highways and Streets 36,345,849 109,502,845 17,332,994 163,181,688 Total Tax Revenue 323,677,462 $ Total Highway and Streets 36,345,849 109,502,845 17,332,994 163,181,688 Public Health Revenue Summary by Type Health Department 19,707,887 138,000 - 19,845,887 Taxes 323,677,462 $ Total Public Health 19,707,887 138,000 - 19,845,887 Licenses and Permits 6,164,935 Intergovernmental 72,062,368 Culture and Recreation Charges for Goods and Services 186,375,013 Parks and Recreation 27,058,597 15,673,500 - 42,732,097 Fines and Forfeitures 1,157,793 Siouxland Libraries 10,334,932 921,000 5,000 11,260,932 Investment and Interest Earnings 54,126,379 Entertainment Venues - - 12,941,103 12,941,103 Contributions 25,109,416 Total Culture and Recreation 37,393,529 16,594,500 12,946,103 66,934,132 Miscellaneous 11,424,563 Transfers 13,315,742 Urban and Economic Development Bond/Note Proceeds/Lease 93,824,000 Planning and Development Services 15,459,286 287,500 8,285,000 24,031,786 Total Budgeted Revenues 787,237,671 $ Housing - - 10,766,595 10,766,595 Total Urban and Economic Development 15,459,286 287,500 19,051,595 34,798,381 Revenue Summary by Fund Type Governmental Funds Transit - - 16,963,501 16,963,501 General Fund 229,064,797 $ Special Revenue Funds 199,883,257 Debt Service - 15,609,788 1,732,702 17,342,490 Tax Incremental Fund 8,285,000 Permanent Funds 350 Transfers 10,650,039 2,665,703 - 13,315,742 Total Governmental Funds 437,233,404 $ Total Governmental Funds 234,068,718 $ 150,089,436 $ 68,028,895 $ 452,187,049 $ Proprietary Funds Proprietary Funds Enterprise Funds Enterprise Funds Power and Distribution Fund 12,214,253 $ Power and Distribution Fund 16,011,440 $ Public Parking Fund 3,272,967 Public Parking Fund 3,365,746 Sanitary Landfill Fund 12,622,688 Sanitary Landfill Fund 17,167,272 Water Fund 45,067,897 Water Fund 44,858,798 Water Reclamation Fund 139,847,766 Water Reclamation Fund 143,577,402 Total Enterprise Funds 213,025,571 $ Total Enterprise Funds 224,980,657 $ Internal Service Funds Internal Service Funds Centralized Facilities Fund 9,104,303 $ Centralized Facilities Fund 9,530,940 $ Fleet Management Fund 18,075,990 Fleet Management Fund 15,209,780 Health Benefits Fund 28,989,234 Health Benefits Fund 25,063,480 Workers' Compensation Fund 1,572,884 Workers' Compensation Fund 1,658,635 Enterprise Network Technology Fund 6,862,869 Enterprise Network Technology Fund 6,816,880 Risk Management Fund 2,170,000 Risk Management Fund 2,724,472 Total Internal Service Funds 66,775,280 $ Total Internal Service Funds 61,004,187 $ Fiduciary Funds Fiduciary Funds Pension Trust Funds Pension Trust Funds Employee's Retirement Fund 51,181,490 $ Employee's Retirement Fund 38,879,115 $ Firefighters' Pension Fund 19,021,926 Firefighters' Pension Fund 12,882,750 115 Healthcare Trust Fund - 115 Healthcare Trust Fund 204,000 Total Fiduciary Funds 70,203,416 $ Total Fiduciary Funds 51,965,865 $ Total 2024 Budgeted Revenue 787,237,671 $ Total 2024 Budgeted Expenditures 790,137,758 $
2024–2028 Capital Program (CIP and OCEP)
BUDGET RESOLUTION AND ORDINANCE / PAGE 89 Funding Source 2024 2025 2026 2027 2028 Total Sales/Use Tax 80,675,945 $ 80,828,656 $ 86,649,669 $ 92,334,612 $ 97,515,500 $ 438,004,382 $ Platting Fees 4,230,000 4,340,000 4,450,000 4,530,000 4,610,000 22,160,000 User Fees 45,960,483 37,501,803 29,540,294 42,466,650 43,184,119 198,653,349 Internal Service Fees 7,493,500 12,778,000 15,524,000 11,589,000 7,823,000 55,207,500 State Contributions 48,270,600 30,000 30,000 30,000 - 48,360,600 Federal Funds - 225,000 225,000 225,000 - 675,000 State Loans 93,574,000 27,516,000 40,974,000 16,975,000 66,208,000 245,247,000 Other Contributions 2,000,000 - - - - 2,000,000 Storm Drainage Fees 8,905,000 8,057,000 10,759,000 8,591,000 10,598,000 46,910,000 Entertainment Tax 6,395,000 7,489,000 4,910,000 4,695,000 2,405,000 25,894,000 Transit Funds 2,200,000 100,000 153,500 2,350,000 500,000 5,303,500 Other Financing 1,928,000 1,120,000 1,620,000 1,620,000 5,590,000 11,878,000 Total Sources 301,632,528 $ 179,985,459 $ 194,835,463 $ 185,406,262 $ 238,433,619 $ 1,100,293,331 $ Uses by Function 2024 2025 2026 2027 2028 Total General Facilities 560,000 $ 548,000 $ 525,000 $ 747,000 $ 782,000 $ 3,162,000 $ Communications 160,000 195,000 17,500 90,000 325,000 787,500 General Government 720,000 743,000 542,500 837,000 1,107,000 3,949,500 Fire 3,127,000 3,426,500 7,067,500 5,079,000 5,939,000 24,639,000 Police 1,444,100 3,076,500 2,022,100 4,970,100 1,912,500 13,425,300 Public Safety 4,571,100 6,503,000 9,089,600 10,049,100 7,851,500 38,064,300 Highways and Streets 109,502,845 69,094,656 70,451,569 75,551,512 82,505,000 407,105,582 Highways and Streets - Storm Drainage 12,405,000 8,057,000 10,759,000 8,591,000 10,598,000 50,410,000 Highways & Streets 121,907,845 77,151,656 81,210,569 84,142,512 93,103,000 457,515,582 Public Health 138,000 284,000 198,500 - - 620,500 Entertainment Venues/Events Complex 3,139,000 5,000,000 2,665,000 2,895,000 1,455,000 15,154,000 Entertainment Venues/Sioux Falls Stadium 41,000 - - - - 41,000 Entertainment Venues/Washington Pavilion 2,415,000 1,664,000 1,895,000 1,740,000 950,000 8,664,000 Entertainment Venues/Orpheum 800,000 825,000 350,000 60,000 - 2,035,000 Parks and Recreation 15,673,500 7,884,000 10,447,500 10,187,000 14,082,000 58,274,000 Siouxland Libraries 921,000 855,000 1,045,000 895,000 930,000 4,646,000 Culture & Recreation 22,989,500 16,228,000 16,402,500 15,777,000 17,417,000 88,814,000 Planning & Development Services 287,500 140,000 140,000 140,000 140,000 847,500 Urban & Economic Development 287,500 140,000 140,000 140,000 140,000 847,500 Transit 2,200,000 100,000 153,500 2,350,000 500,000 5,303,500 Public Parking 65,000 130,000 218,000 125,000 80,000 618,000 Power and Distribution 7,102,000 3,370,000 3,367,610 2,345,100 1,888,500 18,073,210 Sanitary Landfill 6,355,000 1,880,000 1,508,000 4,275,000 5,675,000 19,693,000 Water 17,527,983 20,738,303 19,272,484 29,890,050 29,437,119 116,865,939 Water Reclamation 110,275,100 39,939,500 47,208,200 23,886,500 73,411,500 294,720,800 Enterprise Funds 141,325,083 66,057,803 71,574,294 60,521,650 110,492,119 449,970,949 Centralized Facilities 1,663,000 3,708,000 3,234,000 638,000 2,948,000 12,191,000 Fleet Management 4,430,500 7,670,000 10,890,000 9,551,000 3,475,000 36,016,500 Enterprise Network Technology 1,400,000 1,400,000 1,400,000 1,400,000 1,400,000 7,000,000 Internal Service 7,493,500 12,778,000 15,524,000 11,589,000 7,823,000 55,207,500 Total Uses 301,632,528 $ 179,985,459 $ 194,835,463 $ 185,406,262 $ 238,433,619 $ 1,100,293,331 $
PAGE 90 / BUDGET RESOLUTION AND ORDINANCE A. Appropriations for Governmental Funds General Fund Sales/Use Tax Fund Entertainment Tax Fund Housing Fund Transit Fund Storm Drainage Fund Tax Increment Financing Fund Library Memorial Fund Cottam Memorial Fund 2024 Appropriations GENERAL GOVERNMENT Mayor 942,416 $$$$$$$$$ 942,416 $ City Council 1,981,895---1,981,895 City Attorney's Office 2,814,141---2,814,141 Human Resources 2,386,556---2,386,556 Finance 4,353,693---4,353,693 General Facilities 2,309,598 560,000---2,869,598 Innovation and Technology 6,854,125---6,854,125 Communications 3,163,708 160,000---3,323,708 Total General Government 24,806,132 720,000---25,526,132 PUBLIC SAFETY Fire Rescue 37,267,511 3,127,000---40,394,511 Police 52,438,485 1,444,100--2,000 53,884,585 Total Public Safety 89,705,996 4,571,100--2,000 94,279,096 HIGHWAYS & STREETS Highways & Streets 36,345,849 109,502,845-17,332,994-163,181,688 Total Highways & Streets 36,345,849 109,502,845-17,332,994-163,181,688 PUBLIC HEALTH Health 19,707,887 138,000---19,845,887 Total Public Health 19,707,887 138,000---19,845,887 CULTURE & RECREATION Parks and Recreation 27,058,597 15,673,500---42,732,097 Siouxland Libraries 10,334,932 921,000--5,00011,260,932 Entertainment Venues12,941,103--12,941,103 Total Culture & Recreation 37,393,529 16,594,500 12,941,103-5,00066,934,132 URBAN & ECONOMIC DEVELOPMENT Planning and Development Services 15,459,286 287,500-8,285,00024,031,786 Housing-10,766,595--10,766,595 Total Urban & Economic Development 15,459,286 287,50010,766,5958,285,00034,798,381 Transit-16,963,501-16,963,501 Debt15,609,788-1,732,702-17,342,490 Transfers 10,650,039 2,665,703---13,315,742 Total Appropriations 234,068,718 $ 150,089,436 $ 12,941,103 $ 10,766,595 $ 16,963,501 $ 19,065,696 $ 8,285,000 $ 5,000 $ 2,000 $ 452,187,049 $ B. Means of Finance for Governmental Funds Unobligated Cash Balance Applied 5,003,921 $$ 1,332,943 $ 3,577,288 $ 4,800,036 $ 232,806 $$ 4,700 $ 1,950 $ 14,953,645 $ Taxes 191,764,896 98,551,436 11,558,16013,517,970 8,285,000323,677,462 Licenses and Permits 5,984,585 150,000-100-6,134,685 Intergovernmental 18,896,611 45,277,0004,105,099 3,706,658-71,985,368 Charges for Goods and Services 9,061,405---9,061,405 Fines and Forfeitures 619,000---619,000 Investment and Interest Earnings 550,000 250,000 50,000 55,03540,000300 50 945,385 Contributions 257,000 2,651,000---2,908,000 Miscellaneous Revenue 1,681,300 3,210,000858,9411,774,820-7,525,061 Transfers-in-2,170,232 8,456,807-10,627,039 Other Financing Sources (Loans/ Leases) 250,000-3,500,000-3,750,000 Total Means of Finance 234,068,718 $ 150,089,436 $ 12,941,103 $ 10,766,595 $ 16,963,501 $ 19,065,696 $ 8,285,000 $ 5,000 $ 2,000 $ 452,187,049 $ 2024 Mayor's Recommended BudgetAppropriation Exhibit A
BUDGET AND ACTUALS BY FUND

2024/2023 EXPENDITURES COMPARISON SUMMARY BY FUND 2024/2023 Expenditures Comparison Summary by Fund
BUDGET & ACTUALS BY FUND / PAGE 91
2021 2022 2023 2024 Actual ActualOriginal BudgetBudget $ % Appropriated Funds Governmental (Tax-Supported) Funds General Fund (Primary Operating) 197,685,822 $ 211,297,540 $ 215,442,029 $ 234,068,718 $ 18,626,690 $ 8.6% Sales/Use Tax Fund 75,130,801 89,018,861 106,978,887 150,089,436 43,110,549 40.3% Other Governmental Funds Entertainment Tax Fund 6,284,147 5,647,190 12,332,476 12,941,103 608,627 4.9% Housing Fund 5,126,399 6,088,723 10,429,652 10,766,595 336,943 3.2% Transit Fund 9,847,372 10,531,415 13,105,550 16,963,501 3,857,951 29.4% Storm Drainage Fund 14,258,389 14,699,115 17,198,590 19,065,696 1,867,106 10.9% T.I.F. Fund 3,111,217 3,346,430 7,735,000 8,285,000 550,000 7.1% Library Memorial Fund - - 5,000 5,000 - 0.0% Cottam Memorial Fund - - 2,000 2,000 - 0.0% Public Safety Bond Fund 4,738,426 23,069,398 - - -General Government Construction Fund - 79,356 - - -Total Appropriated 316,182,574 363,778,029 383,229,184 452,187,049 68,957,865 18.0% Non-Appropriated Funds Proprietary (Fee-Supported) Funds Enterprise Funds Power & Distribution Fund 9,195,667 9,450,467 9,590,807 16,011,440 6,420,633 66.9% Public Parking Fund 2,938,702 3,254,408 3,388,077 3,365,746 (22,331) -0.7% Sanitary Landfill Fund 10,483,640 16,473,742 16,996,320 17,167,272 170,952 1.0% Water Fund 40,820,325 54,735,238 51,199,158 44,858,798 (6,340,361) -12.4% Water Reclamation Fund 57,922,175 85,465,705 65,900,460 143,577,402 77,676,942 117.9% 121,360,509 169,379,560 147,074,822 224,980,657 77,905,836 53.0% Internal Service Funds Centralized Facilities Fund 4,842,864 7,114,865 12,038,084 9,530,940 (2,507,144) -20.8% Fleet Management Fund 10,947,465 14,670,938 18,266,174 15,209,780 (3,056,394) -16.7% Health Benefits Fund 20,484,052 21,200,880 24,950,407 25,063,480 113,073 0.5% Workers' Compensation Fund 1,641,176 1,711,105 1,619,460 1,658,635 39,175 2.4% Enterprise Network Technology Fund 5,677,063 7,242,978 6,876,750 6,816,880 (59,870) -0.9% Risk Management Fund 2,550,000 2,240,290 2,301,008 2,724,472 423,464 18.4% 46,142,620 54,181,056 66,051,883 61,004,187 (5,047,696) -7.6% Fiduciary Funds Employee's Retirement System Fund 28,495,244 30,438,804 36,378,470 38,879,115 2,500,645 6.9% Firefighters' Pension Fund 9,695,457 10,593,106 12,133,677 12,882,750 749,073 6.2% 115 Healthcare Trust Fund 314,545 240,357 204,000 204,000 - 0.0% 38,505,246 41,272,267 48,716,147 51,965,865 3,249,718 6.7% Total Non-Appropriated Funds 206,008,375 264,832,883 261,842,852 337,950,708 76,107,856 29.1% Total All Funds 522,190,949 $ 628,610,912 $ 645,072,036 $ 790,137,758 $ 145,065,723 $ 22.5% Difference General Fund Sales/Use Tax Fund Fiduciary Funds Internal Service Funds Enterprise Funds Other Govt Funds 2024 Expenditures by Fund 9% 30% 19% 8% 29% Total = $790,137,758 7%
2024 ALL FUNDS SUMMARY 2024 All Funds Summary
PAGE 92 / BUDGET & ACTUALS BY FUND
Appropriated Funds Revenues Expenditures Use of Fund Balance Governmental (Tax-Supported) Funds General Fund (General Operating) 229,064,797 $ 234,068,718 $ (5,003,921) $ Sales/Use Tax Fund (General Capital) 150,089,436 150,089,436Entertainment Tax Fund 11,608,160 12,941,103 (1,332,943) Other Governmental Funds Housing Fund 7,189,307 10,766,595 (3,577,288) Transit Fund 12,163,464 16,963,501 (4,800,036) Storm Drainage Fund 18,832,890 19,065,696 (232,806) Library Memorial Fund 300 5,000 (4,700) Cottam Memorial Fund 50 2,000 (1,950) T.I.F. Fund 8,285,000 8,285,000Total Appropriated 437,233,404 $ 452,187,049 $ (14,953,645) $ Non-Appropriated Funds Proprietary (Fee-Supported) Funds Enterprise Funds (Utility) Power & Distribution Fund 12,214,253 $ 16,011,440 $ (3,797,187) $ Public Parking Fund 3,272,967 3,365,746 (92,779) Sanitary Landfill Fund 12,622,688 17,167,272 (4,544,584) Water Fund 45,067,897 44,858,798 209,099 Water Reclamation Fund 139,847,766 143,577,402 (3,729,636) Total Enterprise 213,025,571 224,980,657 (11,955,087) Internal Service Funds Centralized Facilities Fund 9,104,303 9,530,940 (426,637) Fleet Management Fund 18,075,990 15,209,780 2,866,209 Health Benefits Fund 28,989,234 25,063,480 3,925,754 Workers' Compensation Fund 1,572,884 1,658,635 (85,751) Enterprise Network Technology Fund 6,862,869 6,816,880 45,989 Risk Management Fund 2,170,000 2,724,472 (554,472) Total Internal Service Funds 66,775,280 61,004,187 5,771,093 Pension/Trust Funds Employee's Retirement System Fund 51,181,490 38,879,115 12,302,375 Firefighters' Pension Fund 19,021,926 12,882,750 6,139,176 115 Healthcare Trust Fund - 204,000 (204,000) Total Pension/Trust Funds 70,203,416 51,965,865 18,237,551 Total Non-Appropriated 350,004,266 $ 337,950,708 $ 12,053,558 $ Total All Funds (including transfers) 787,237,671 $ 790,137,758 $ (2,900,088) $ General Fund Sales/Use Tax Fund Other Governmental Funds Enterprise Funds Internal Service Funds Fiduciary Funds 2024 Expenditures by Fund Total = $790,137,758 9% 7% 29% 30% 19% 8%
2024 All Funds Breakdown by Category
2024 ALL FUNDS BREAKDOWN BY CATEGORY

= $790,137,758

BUDGET & ACTUALS BY FUND / PAGE 93
Revenues General Sales/Use Tax Other Governmental Enterprise Fiduciary & Internal ServiceTotal Revenue Taxes 191,764,896 $ 98,551,436 $ 33,361,130 $ - $ - $ 323,677,462 $ Licenses and Permits 5,984,585 150,000 100 30,250 - 6,164,935 Intergovernmental 18,896,611 45,277,000 7,811,757 - 77,000 72,062,368 Charges for Goods & Services 9,061,405 - - 114,145,532 63,168,077 186,375,013 Fines and Forfeitures 619,000 - - 538,793 - 1,157,793 Investment & Interest Earnings 550,000 250,000 145,385 571,994 52,609,000 54,126,379 Contributions 257,000 2,651,000 - 4,270,000 17,931,416 25,109,416 Misc. (Assessments, Rentals, Other)1,681,300 3,210,000 2,633,761 3,395,002 504,500 11,424,563 Other Financing (Bond/SRF Notes/Lease 250,000 - 3,500,000 90,074,000 - 93,824,000 Transfers In - - 10,627,039 - 2,688,703 13,315,742 Total Revenue all Funds 229,064,797 $ 150,089,436 $ 58,079,171 $ 213,025,571 $ 136,978,696 $ 787,237,671 $ Expenditures General Sales/Use Tax Other Governmental Enterprise Fiduciary & Internal ServiceTotal Expenditures Personnel 149,609,023 $ - $ 4,184,082 $ 20,257,877 $ 6,848,722 $ 180,899,704 $ Other Operating 73,381,656 - 41,112,110 39,243,371 25,786,744 179,523,881 $ Capital - 131,813,945 21,000,000 141,325,083 7,493,500 301,632,528 $ Debt Service - 15,609,788 1,732,702 22,196,327 - 39,538,817 $ Benefit Payments 108,000 - - - 72,607,970 72,715,970 $ Transfers Out 10,650,039 2,665,703 - - - 13,315,742 $ Miscellaneous 320,000 - - 1,958,000 233,116 2,511,116 $ Total Expenditures all Funds 234,068,718 $ 150,089,436 $ 68,028,894 $ 224,980,657 $ 112,970,052 $ 790,137,758 $ Taxes Licenses & Permits Loan Proceeds Intergovt'l Charges for Goods & Services Investment/ Interest Contributions Transfers Other 2024 Revenue by
25% Total
9% 41% 2% 3% 7% 24% 12% Personnel Other Operating Capital Benefit Payments Debt Service Transfers Out Misc. 2024 Expenditures by Category Total
38% 23% 9% 5% 2% 23% 1% 2%
Category
= $787,237,671
GENERAL
FUND (Revenue by Category Comparison) General Fund (Revenue by Category Comparison)
General Fund 2024 Sources by Category

PAGE 94 / BUDGET & ACTUALS BY FUND
2021 2022 2023 2024 Actual ActualOriginal BudgetBudget $ % Revenues Taxes Property (Growth 4.0%, CPI 3.0%)71,238,553 $ 74,004,197 $ 78,572,716 $ 84,949,435 $ 6,376,719 $ 8.1% Sales/Use (5% - 2023, 4% - 2024)79,605,916 89,379,982 89,548,565 97,617,614 8,069,049 9.0% Frontage 4,950,632 4,895,785 5,099,347 5,099,347 - 0.0% Lodging 1,100,743 1,319,748 1,225,000 1,600,000 375,000 30.6% Business Improvement Districts 2,018,919 2,170,107 2,135,000 2,385,000 250,000 11.7% Amusement 228 - 13,500 13,500 - 0.0% Penalties and Interest 130,187 99,564 100,000 100,000 - 0.0% Total Taxes 159,045,178 171,869,383 176,694,128 191,764,896 15,070,768 $ 8.5% Licenses and Permits 7,186,778 16,135,111 6,652,959 5,984,585 (668,374) -10.0% Intergovernmental Federal and State Grants 6,393,902 8,769,058 10,852,042 9,785,852 (1,066,190) -9.8% State Shared Revenue Motor Vehicle Licenses 3,167,707 3,129,190 3,250,000 3,250,000 - 0.0% Bank Franchise Tax 2,635,699 2,507,527 2,000,000 2,000,000 - 0.0% Liquor Tax Reversion 1,553,821 1,338,101 1,000,046 1,100,000 99,954 10.0% Health License Reversion 327,114 171,579 159,000 159,000 - 0.0% Fire Insurance Premium Reversion744,252 857,655 780,000 900,000 120,000 15.4% Port of Entry Fees 84,267 104,573 85,000 85,000 - 0.0% Total State Shared Revenue 8,512,860 8,108,624 7,274,046 7,494,000 219,954 3.0% County Shared Revenues Wheel Tax 199,492 198,435 201,759 201,759 - 0.0% Contributions 1,275,433 1,280,000 1,345,000 1,415,000 70,000 5.2% Total County Shared Revenues1,474,925 1,478,435 1,546,759 1,616,759 70,000 4.5% Total Intergovernmental 16,381,686 18,356,117 19,672,847 18,896,611 (776,236) -3.9% Charges for Goods and Services 6,509,776 8,572,791 8,313,452 9,061,405 747,953 9.0% Fines and Forfeitures 617,246 698,003 619,000 619,000 - 0.0% Investment Revenue (13,202) (881,581) 550,000 550,000 - 0.0% Other (Contributions, Assessments, Misc.) 1,839,640 1,540,397 1,307,800 1,938,300 630,500 48.2% Total Revenues 191,567,102 216,290,220 213,810,186 228,814,797 15,004,611 7.0% Use of Reserves - 1,631,843 5,003,921 3,372,078 206.6% Lease Right-to-Use 781,230 - 250,000 250,000Total General Fund Sources 217,071,449 $ 215,442,029 $ 234,068,718 $ 18,626,689 $ 8.6% Difference Taxes Licenses & Permits Intergovernmental Charges for Goods & Services Use of Unreserved Fund Balance Other
82% 8% 2% 4% 3% 1% Total = $234,068,718
General Fund (Expenditures by Department Comparison)
GENERAL FUND (Expenditures by Department Comparison)

BUDGET & ACTUALS BY FUND / PAGE 95
2021 2022 2023 2024 Actual ActualOriginal BudgetBudget $ % Expenditures General Government: Mayor 780,093 $ 772,903 $ 876,903 $ 942,416 $ 65,513 $ 7.5% City Council 1,453,236 1,627,759 1,662,638 1,981,895 319,257 19.2% City Attorney's Office 1,974,899 2,295,526 2,583,624 2,814,141 230,518 8.9% Human Resources 1,767,622 1,959,754 2,358,446 2,386,556 28,111 1.2% Finance 3,203,263 3,558,814 3,771,449 4,353,693 582,244 15.4% General Facilities 1,978,474 1,946,395 2,653,635 2,309,598 (344,037) -13.0% Innovation and Technology 4,702,385 4,848,576 6,221,281 6,854,125 632,844 10.2% Communications 2,153,412 2,121,014 2,812,002 3,163,708 351,706 12.5% Total General Government 18,013,385 19,130,741 22,939,977 24,806,132 1,866,156 8.1% Public Safety: Fire 31,720,669 33,058,228 34,204,430 37,267,511 3,063,082 9.0% Police 41,896,117 45,038,392 49,722,315 52,438,485 2,716,170 5.5% Total Public Safety 73,616,786 78,096,621 83,926,745 89,705,996 5,779,252 6.9% Highways and Streets: Highways and Streets 25,433,789 30,260,842 32,659,137 36,345,849 3,686,711 11.3% Total Highways and Streets 25,433,789 30,260,842 32,659,137 36,345,849 3,686,711 11.3% Public Health (Health Department) 14,441,751 16,060,725 19,060,360 19,457,887 397,527 2.1% Culture and Recreation: Parks and Recreation 20,596,649 23,140,711 24,653,729 27,058,597 2,404,869 9.8% Siouxland Libraries 8,714,279 8,997,315 9,760,647 10,334,932 574,285 5.9% Total Culture and Recreation 29,310,929 32,138,025 34,414,376 37,393,529 2,979,153 8.7% Urban and Economic Development: Planning and Development Services 11,166,783 26,144,540 12,857,835 15,459,286 2,601,451 20.2% Total Urban and Economic Development11,166,783 26,144,540 12,857,835 15,459,286 2,601,451 20.2% Transfers Out Enterprise Network Technology - 500,000 - - -Sales Tax 13,662,500 - - - -Storm Drainage - 33,000 - - -Housing 4,035,000 1,648,000 1,710,000 2,170,232 460,232 26.9% Transit 6,004,900 6,285,047 6,873,599 7,479,807 606,208 8.8% Centralized Facilities 2,000,000 1,000,000 1,000,000 1,000,000 - 0.0% Total Transfers 25,702,400 9,466,047 9,583,599 10,650,039 1,066,440 11.1% Total Expenditures 197,685,822 $ 211,297,540 $ 215,442,029 $ 233,818,718 $ 18,376,690 $ 8.5% Lease Right-to-Use - 781,230 - 250,000 250,000Total General Fund Uses 197,685,822 $ 212,078,770 $ 215,442,029 $ 234,068,718 $ 18,626,690 $ 8.6% Difference General Government Fire Police Highways & Streets Planning & Development Services Health Libraries Parks & Recreation Transfers 2024 General Fund Uses Total =$234,068,718 22% 8% 15% 16% 4% 12% 5% 11% 7%
GENERAL FUND (Expenditures Comparative Budget by Program)
General Fund (Expenditures by Category Comparison)

PAGE 96 / BUDGET & ACTUALS BY FUND
2021 2022 2023 2024 Actual ActualOriginal BudgetBudget $ % Expenditures Fulltime Wages 73,789,807 $ 79,973,570 $ 87,717,404 $ 97,207,880 $ 9,490,476 $ 10.8% Part-time Wages 5,540,031 7,230,349 8,925,791 9,183,203 257,412 2.9% Overtime 5,243,683 5,469,926 3,584,638 3,613,138 28,500 0.8% OASI 3,654,909 4,054,886 4,237,213 4,630,800 393,587 9.3% Pension 15,001,789 15,124,042 15,278,872 15,894,665 615,793 4 0% Insurance 13,449,810 14,436,941 16,433,884 17,178,640 744,756 4 5% W orker's Compensation 1,623,149 1,381,605 1,381,605 1,375,605 (6,000) -0 4% Allowances 499,420 507,903 520,381 525,093 4,712 0 9% Total Personnel 118,802,598 128,179,222 138,079,788 149,609,023 11,529,236 8.3% Management Agreements 5,069,559 5,742,891 8,328,776 6,905,688 (1,423,088) -17.1% Pass Through Taxes 3,458,874 3,862,247 3,760,000 4,660,000 900,000 23.9% Non-Profit Service Contracts 1,931,146 17,029,911 3,760,000 4,120,176 360,176 9.6% Property Liability Insurance 1,310,247 1,579,183 1,175,114 1,309,740 134,626 11.5% Snow Removal 395,363 410,184 990,345 1,020,055 29,710 3.0% Health Providers and Interpreters 1,027,679 1,407,998 1,402,090 1,415,178 13,088 0.9% Other Professional Services 4,442,033 4,573,438 5,939,258 7,875,254 1,935,996 32.6% Total Professional Services 17,634,900 34,605,852 25,355,583 27,306,091 1,950,508 7.7% Enterprise Network Technology (Internal)3,472,101 3,737,477 4,016,702 5,368,482 1,351,780 33.7% Fleet Rentals (Internal) 2,465,920 2,699,923 2,755,192 3,277,619 522,427 19.0% Equipment 1,239,097 393,584 1,120,489 114,867 (1,005,622) -89.7% Centralized Facilities (Internal) 253,000 274,000 274,000 274,000Copiers 154,784 61,888 198,150 61,773 (136,377) -68.8% Other Rental Charges 377,269 371,940 616,503 624,846 8,343 1.4% Total Rentals 7,962,171 7,538,811 8,981,036 9,721,587 740,551 8.2% Building Repairs and Maintenance 3,743,754 4,449,193 6,180,802 4,062,162 (2,118,640) -34.3% Vehicle and Heavy Equipment 3,596,393 4,433,322 4,432,999 4,851,763 418,764 9.4% Grounds and ADA Maintenance 1,109,387 2,726,586 2,207,548 2,802,658 595,110 27.0% Roads, Street Lighs, Traffic Control 3,068,588 2,113,599 1,993,809 2,642,643 648,834 32.5% Other Equipment 623,993 945,626 893,914 954,875 60,961 6.8% Total Repair & Maintenance 12,142,115 14,668,326 15,709,072 15,314,101 (394,971) -2.5% Fuel 1,293,202 2,109,737 2,332,992 2,364,190 31,198 1.3% Road Salt, De-Icer, Aggregate 1,057,233 898,169 1,948,460 1,710,180 (238,280) -12.2% Small Tools, Protective Equip, FFE 3,432,574 2,476,797 1,945,401 2,479,307 533,907 27.4% Program, Clinic, and Office Supplies 1,677,727 1,646,420 1,771,296 1,914,843 143,547 8.1% Tech Software, Hardware, AV Equip 1,874,737 1,344,859 1,544,811 1,220,066 (324,745) -21.0% Janitorial and Shop Supplies 374,038 357,137 500,331 406,976 (93,355) -18.7% Other Chemicals and Adjustments (361,208) 313,300 438,580 494,370 55,790 12.7% Total Supplies & Materials 9,348,301 9,146,420 10,481,870 10,589,932 108,062 1.0% Training & Education 829,785 1,020,607 1,178,161 1,248,891 70,730 6.0% Utilities 5,220,112 5,272,778 5,814,921 6,145,512 330,591 5.7% Total Other Operating 53,137,386 72,252,795 67,520,642 70,326,113 2,805,471 4.2% Leases - 1,910,870 3,305,543 3,305,543Benefit Payments 5,584 84,318 108,000 108,000 - 0.0% Transfers Out 25,702,400 9,466,047 9,583,599 10,650,039 1,066,440 11.1% Miscellaneous 37,855 185,518 150,000 70,000 (80,000) -53.3% Total Expenditures 197,685,822 $ 212,078,770 $ 215,442,029 $ 234,068,718 $ 18,626,690 $ 8.6% Difference Personnel Professional Services Rentals Repair & Maintenance Supplies & Materials Training & Education Utilities Leases Transfers 64% 4% 1% 7% 5% 12% 3% 4%
General Fund (Expenditures Comparative Budget by Program)
GENERAL FUND (Expenditures Comparative Budget by Program)
BUDGET & ACTUALS BY FUND / PAGE 97
2021 2022 2023 2024 Actual ActualOriginal BudgetBudget $ % Expenditures General Government: Mayor 780,093 $ 772,903 $ 876,903 $ 942,416 $ 65,513 $ 7.5% City Council 1,453,236 1,627,759 1,662,638 1,981,895 319,257 19.2% City Attorney's Office 1,974,899 2,295,5262,583,6242,814,141 230,5188.9% Human Resources 1,767,622 1,959,754 2,358,446 2,386,556 28,111 1.2% Finance 3,203,263 3,558,814 3,771,449 4,353,693 582,244 15.4% General Facilities 1,978,474 1,946,395 2,653,635 2,309,598 (344,037) -13.0% Innovation and Technology 4,702,385 4,848,576 6,221,281 6,854,125 632,844 10.2% Communications 2,153,412 2,121,0142,812,0023,163,708 351,70612.5% Total General Government 18,013,385 19,130,741 22,939,977 24,806,132 1,866,156 8.1% Public Safety: Fire Fire Services 28,189,028 29,273,942 29,979,647 32,214,581 2,234,934 Fire Prevention 2,243,974 2,385,255 2,438,423 2,623,457 185,033 Emergency Preparedness 364,828 408,818 486,666 542,212 55,545 Facilities 922,838 990,213 1,299,693 1,887,262 587,569 Total 31,720,669 33,058,228 34,204,430 37,267,511 3,063,082 9.0% Police Uniformed Services 30,840,626 33,351,431 35,506,399 39,612,601 4,106,203 Investigation 5,272,545 5,450,005 5,500,806 5,823,976 323,170 Crime Lab 1,102,004 1,158,829 1,284,573 1,404,918 120,345 Metro Communications 1,685,841 1,938,717 4,238,815 2,261,320 (1,977,495) Facilities 1,063,747 1,073,882 917,110 917,361 251 Records 928,267 950,115 1,017,107 1,090,817 73,710 Animal Control 1,003,087 1,115,414 1,257,505 1,327,492 69,986 Total 41,896,117 45,038,392 49,722,315 52,438,485 2,716,170 5.5% Total Public Safety 73,616,786 78,096,621 83,926,745 89,705,996 5,779,252 6.9% Highways and Streets: Engineering 5,452,779 6,551,448 7,453,294 8,423,210 969,916 Street Winter 6,987,629 8,464,996 10,121,844 11,694,363 1,572,520 Street Maintenance 6,874,116 7,753,640 7,840,598 8,701,778 861,180 Street Light and Traffic 5,199,265 5,907,757 6,760,402 7,043,498 283,095 Facilities 920,000 1,583,000 483,000 483,000Total Highways and Streets 25,433,789 30,260,842 32,659,137 36,345,849 3,686,711 11.3% Public Health: Community Health Center 10,271,051 11,397,712 13,753,877 13,327,410 (426,467) Health Safety & Enforcement 2,594,729 2,724,668 2,888,524 3,383,332 494,808 Community Health & Wellness 786,228 851,971 1,460,458 1,589,645 129,186 Community Triage Center 789,744 1,086,374 957,500 1,157,500 200,000 Total Public Health 14,441,751 16,060,725 19,060,360 19,457,887 397,527 2.1% Culture and Recreation: Siouxland Libraries Collections 186,330 294,637 242,600 238,350 (4,250) Operations 6,051,166 6,134,858 6,763,139 7,084,363 321,224 Technology 624,678 622,158 688,504 815,082 126,578 Program Support 74,585 59,506 53,856 62,200 8,344 Facilities 1,079,680 1,148,750 1,150,925 1,228,318 77,393 Siouxland Museum 697,840 737,405 861,623 906,620 44,997 Total 8,714,279 8,997,315 9,760,647 10,334,932 574,285 5.9% Parks and Recreation Parks & Playgrounds 7,405,818 7,969,625 8,333,761 9,534,734 1,200,973 Aquatics 3,621,441 4,684,277 4,754,628 5,268,108 513,480 Outdoor Sports 2,534,897 2,762,727 3,307,187 3,571,842 264,655 Indoor Sports - - - 1,313,074 1,313,074 Community Centers 1,717,359 1,853,268 2,068,343 475,000 (1,593,343) Zoo 1,854,176 2,016,719 2,131,773 2,460,409 328,636 External Property Maintenance 863,415 1,083,512 969,820 1,141,080 171,260 Forestry 1,845,787 1,858,467 2,136,435 2,297,931 161,496 External Special Events 393,348 407,108 439,802 454,220 14,418 Music & Theater 240,409 255,008 254,479 280,198 25,719 Facilities (Shop Campus) 120,000 250,000 257,500 262,000 4,500 Total 20,596,649 23,140,711 24,653,729 27,058,597 2,404,869 9.8% Total Culture and Recreation 29,310,929 32,138,025 34,414,376 37,393,529 2,979,153 8.7% Difference
GENERAL FUND (Expenditures by Category Comparison) General Fund (Expenditures Comparative Budget by Program)
PAGE 98 / BUDGET & ACTUALS BY FUND
2021 2022 2023 2024 Actual ActualOriginal BudgetBudget $ % Difference Urban and Economic Development: Planning and Development Services Development Services 3,467,690 17,739,924 4,209,034 5,326,179 1,117,145 Building Services 3,645,392 3,756,312 4,063,922 4,619,922 556,001 Neighborhood Services 761,641 943,922 1,024,880 1,053,185 28,305 BID and Lodging Tax 3,292,060 3,704,382 3,560,000 4,460,000 900,000 Total Urban & Economic Development 11,166,783 26,144,540 12,857,835 15,459,286 2,601,451 20.2% Transfers Out Enterprise Network Technology - 500,000 - -Sales Tax 13,662,500 - - -Storm Drainage - 33,000 - -Housing 4,035,000 1,648,000 1,710,000 2,170,232 460,232 Transit 6,004,900 6,285,047 6,873,599 7,479,807 606,208 Centralized Facilities 2,000,000 1,000,000 1,000,000 1,000,000Total Transfers Out 25,702,400 9,466,047 9,583,599 10,650,039 1,066,440 11.1% Total Expenditures 197,685,822 $ 211,297,540 $ 215,442,029 $ 233,818,718 $ 18,376,689 $ 8.5%
MAYOR
Breakdown by Category
CITY COUNCIL
City Council
Breakdown by Category
BUDGET & ACTUALS BY DEPARTMENT / PAGE 99
GENERAL ADMINISTRATION BUDGET AND ACTUALS BY DEPARTMENT
Mayor 2021 2022 2023 2024 Actual ActualOriginal BudgetBudget $ % Expenditures Fulltime 577,627 $ 563,165 $ 600,509 $ 674,308 $ 73,799 $ 12.3% Part-time 7,250 - 7,259 9,932 2,673 36.8% OASI 39,072 39,019 40,798 46,476 5,678 13.9% Benefits 119,853 101,564 126,047 106,828 (19,219) -15.2% Total Personnel 743,803 703,748 774,613 837,544 62,931 8.1% Professional Services 4,051 33,400 53,598 54,758 1,160 2.2% Rentals 9,365 9,969 11,237 11,009 (228) -2.0% Supplies & Materials 19,593 19,747 22,100 22,100 - 0.0% Training & Education 1,720 3,100 13,735 13,735 - 0.0% Utilities 1,560 1,482 1,620 1,620 - 0.0% Leases - 1,457 - 1,650 1,650Total Other Operating 36,290 69,155 102,290 104,872 2,582 2.5% Total Expenditures 780,093 $ 772,903 $ 876,903 $ 942,416 $ 65,513 $ 7.5%
Difference
2021 2022 2023 2024 Actual ActualOriginal BudgetBudget $ % Revenues Charges for Goods/Services 1,350 $ 1,250 $ 1,500 1,500 $ - 0.0% Other - 1,100 - - -Total Revenues 1,350 $ 2,350 $ 1,500 $ 1,500 $ - $ 0.0% Expenditures Fulltime 652,166 $ 669,985 $ 720,851 $ 598,087 $ (122,764) $ -17.0% Part-time 157,446 166,233 175,096 190,720 15,624 8.9% Overtime 930 4,811 2,585 2,585 - 0.0% OASI 61,713 63,555 66,587 58,523 (8,064) -12.1% Benefits 197,533 202,141 220,344 195,055 (25,289) -11.5% Total Personnel 1,069,788 1,106,725 1,185,463 1,044,970 (140,493) -11.9% Professional Services 174,644 283,329 185,465 650,251 464,786 250.6% Rentals 31,358 37,672 44,403 53,775 9,372 21.1% Supplies & Materials 76,784 79,908 90,500 89,700 (800) -0.9% Training & Education 94,276 110,761 150,247 133,778 (16,469) -11.0% Utilities 6,386 6,504 6,560 6,560 - 0.0% Leases - 2,861 - 2,860 2,860Total Other Operating 383,448 521,034 477,175 936,925 459,750 96.3% Total Expenditures 1,453,236 $ 1,627,759 $ 1,662,638 $ 1,981,895 $ 319,257 $ 19.2% Difference
City Attorney's Office
CITY ATTORNEY’S OFFICE
Breakdown by Category
HUMAN RESOURCES OPERATIONS TEAM
Human Resources
Breakdown by Category
PAGE 100 / BUDGET & ACTUALS BY DEPARTMENT
2021 2022 2023 2024 Actual ActualOriginal BudgetBudget $ % Revenues Taxes (Vending Machine Tax) 10,724 $ 11,060 $ 13,500 $ 13,500 $ - $ 0.0% Licenses and Permits 721,680 5,374,964 977,894 539,450 (438,444) -44.8% Intergovernmental 1,552,022 1,353,751 1,012,646 1,112,600 99,954 9.9% Charges for Goods & Services 350 125,500 600 600 - 0.0% Total Revenues 2,284,776 $ 6,865,275 $ 2,004,640 $ 1,666,150 $ (338,490) $ -16.9% Expenditures Fulltime 1,216,226 $ 1,394,453 $ 1,504,378 $ 1,707,119 $ 202,742 $ 13.5% Part-time 10,814 26,630 54,100 54,100 - 0.0% Overtime 27 - - - -OASI 85,931 98,299 107,739 121,729 13,990 13.0% Benefits 315,520 365,213 415,812 442,310 26,498 6.4% Total Personnel 1,628,517 1,884,595 2,082,029 2,325,258 243,229 11.7% Professional Services 43,742 115,808 169,472 130,248 (39,224) -23.1% Multi-Cultural Center 137,678 128,808 146,062 146,062 - 0.0% Rentals 74,392 76,405 86,381 109,203 22,822 26.4% Supplies & Materials 22,118 13,257 17,900 16,950 (950) -5.3% Training & Education 10,677 17,641 19,255 20,890 1,635 8.5% Utilities 57,152 56,274 62,525 62,650 125 0.2% Lease - 2,738 - 2,880 2,880Total Other Operating 346,382 410,931 501,595 488,884 (12,711) -2.5% Total Expenditures 1,974,899 $ 2,295,526 $ 2,583,624 $ 2,814,141 $ 230,518 $ 8.9%
Difference
2021 2022 2023 2024 Actual ActualOriginal BudgetBudget $ % Expenditures Fulltime 831,953 $ 957,747 $ 1,105,966 $ 1,153,866 $ 47,900 $ 4.3% Part-time - 7,667 17,000 17,000 - 0.0% Overtime 6,335 1,366 - - -OASI 59,526 69,570 75,473 83,102 7,629 10.1% Benefits 264,894 287,454 328,502 341,351 12,849 3.9% Total Personnel 1,162,708 1,323,804 1,526,941 1,595,319 68,378 4.5% Professional Services 395,308 429,021 595,527 529,927 (65,600) -11.0% Rentals 38,290 46,282 50,548 60,528 9,980 19.7% Supplies & Materials 155,305 149,627 165,970 165,970 - 0.0% Training & Education 13,928 5,645 17,300 14,105 (3,195) -18.5% Utilities 2,083 1,928 2,160 2,160 - 0.0% Lease - 3,377 - 18,548 18,548Total Other Operating 604,914 635,949 831,505 791,238 (40,267) -4.8% Total Expenditures 1,767,622 $ 1,959,754 $ 2,358,446 $ 2,386,556 $ 28,110 $ 1.2% Difference
FINANCE
Breakdown by Category
GENERAL FACILITIES
Breakdown by Category
BUDGET & ACTUALS BY DEPARTMENT / PAGE 101
Finance 2021 2022 2023 2024 Actual ActualOriginal BudgetBudget $ % Revenues Intergovernmental 15,191 $ 498 $ - $ - $ - $Total Revenues 15,191 $ 498 $ - $ - $ - $Expenditures Fulltime 2,142,384 $ 2,374,892 $ 2,480,464 $ 2,879,746 $ 399,282 $ 16.1% Part-time 50,736 41,049 88,416 103,699 15,283 17.3% Overtime 1,162 2,898 5,000 5,000 - 0.0% OASI 153,186 168,942 175,174 198,828 23,654 13.5% Benefits 669,270 688,169 761,905 863,739 101,834 13.4% Total Personnel 3,016,738 3,275,950 3,510,959 4,051,012 540,053 15.4% Professional Services 54,471 69,667 98,644 89,936 (8,708) -8.8% Rentals 98,878 100,211 114,916 148,385 33,469 29.1% Supplies & Materials 14,197 40,622 11,000 26,000 15,000 136.4% Training & Education 12,959 21,348 30,530 30,530 - 0.0% Utilities 6,020 6,237 5,400 6,400 1,000 18.5% Lease - 1,430 - 1,430 1,430Total Other Operating 186,526 282,864 260,490 302,681 42,191 16.2% Total Expenditures 3,203,263 $ 3,558,814 $ 3,771,449 $ 4,353,693 $ 582,244 $ 15.4% Difference
General Facilities 2021 2022 2023 2024 Actual ActualOriginal BudgetBudget $ % Revenues Intergovernmental - $ 45,459 $ 700,000 $ 200,000 $ (500,000) $ -71.4% Miscellaneous - 220,000 - - -Total Revenues - $ 265,459 $ 700,000 $ 200,000 $ (500,000) $ -71.4% Expenditures Fulltime 855,000 $ 912,000 $ 912,000 $ 1,015,000 $ 103,000 $ 11.3% Total Personnel 855,000 912,000 912,000 1,015,000 103,000 11.3% Professional Services 76,006 72,395 79,635 87,598 7,963 10.0% Rentals 172,000 193,000 193,000 193,000 - 0.0% Repair & Maintenance 445,468 337,000 1,037,000 547,000 (490,000) -47.3% Supplies & Materials 115,000 112,000 112,000 112,000 - 0.0% Utilities 315,000 320,000 320,000 355,000 35,000 10.9% Total Other Operating 1,123,474 1,034,395 1,741,635 1,294,598 (447,037) -25.7% Total Operating Expenditures 1,978,474 1,946,395 2,653,635 2,309,598 (344,037) -13.0% Buildings 363,830 274,227 - - -Equipment - 10,879 - - -Land - - 325,000 560,000 235,000 72.3% General Gov't Bond Construction Fund 79,356 Total Capital Expenditures 363,830 364,462 325,000 560,000 235,000 72.3% Total Expenditures 2,342,304 $ 2,310,857 $ 2,978,635 $ 2,869,598 $ (109,037) $ -3.7% Difference
INNOVATION AND TECHNOLOGY
Breakdown by Category
PAGE 102 / BUDGET & ACTUALS BY DEPARTMENT
Innovation and Technology 2021 2022 2023 2024 Actual ActualOriginal BudgetBudget $ % Revenues Charges for Goods & Services 468 $ 398 $ - $ - $ -Total Revenues 468 $ 398 $ - $ - $ - $Expenditures Fulltime 2,652,156 $ 2,918,872 $ 3,434,372 $ 4,097,546 $ 663,174 $ 19.3% Part-time 17,852 44,886 180,248 160,240 (20,008) -11.1% Overtime 2,401 3,652 3,053 3,053 - 0.0% OASI 192,833 215,804 245,588 293,475 47,887 19.5% Benefits 782,535 774,373 914,259 1,024,452 110,193 12.1% Total Personnel 3,647,778 3,957,587 4,777,520 5,578,766 801,246 16.8% Professional Services 204,084 289,668 572,654 427,185 (145,469) -25.4% Rentals 219,983 290,891 318,488 420,043 101,555 31.9% Repair & Maintenance 18,166 36,844 72,500 72,500 - 0.0% Supplies & Materials 441,133 134,846 285,481 171,957 (113,524) -39.8% Training & Education 117,970 77,504 90,094 100,094 10,000 11.1% Utilities 53,271 57,704 104,544 81,580 (22,964) -22.0% Lease - 3,532 - 2,000 2,000Total Other Operating 1,054,608 890,989 1,443,761 1,275,359 (168,402) -11.7% Total Expenditures 4,702,385 $ 4,848,576 $ 6,221,281 $ 6,854,125 $ 632,844 $ 10.2% Difference
COMMUNICATIONS Communications
Breakdown by Category
BUDGET & ACTUALS BY DEPARTMENT / PAGE 103
2021 2022 2023 2024 Actual ActualOriginal BudgetBudget $ % Revenues Cable Franchise Fee 327,214 $ 309,880 $ 350,000 $ 350,000 $ - $ 0.0% Charges for Goods/Services - 267 - - -Total Revenues 327,214 $ 310,147 $ 350,000 $ 350,000 $ - $ 0.0% Expenditures Fulltime 1,172,004 $ 1,195,799 $ 1,557,031 $ 1,691,415 $ 134,384 $ 8.6% Part-time 10,304 28,289 88,216 88,216 - 0.0% Overtime 3,032 1,059 6,500 6,500 - 0.0% OASI 84,494 86,564 114,893 125,405 10,512 9.1% Benefits 371,097 330,681 474,952 455,775 (19,177) -4.0% Total Personnel 1,640,931 1,642,392 2,241,592 2,367,311 125,719 5.6% Professional Services 285,574 294,112 400,553 575,553 175,000 43.7% Rentals 57,660 73,904 80,556 96,608 16,052 19.9% Repair & Maintenance 7,180 11,810 23,301 23,301 - 0.0% Supplies & Materials 147,423 89,852 49,421 74,456 25,035 50.7% Training & Education 9,200 65 11,044 15,044 4,000 36.2% Utilities 5,445 4,875 5,535 5,535 - 0.0% Lease - 4,004 - 5,900 5,900Total Other Operating 512,481 478,622 570,410 796,397 225,987 39.6% Total Operating Expenditures 2,153,412 2,121,014 2,812,002 3,163,708 351,706 12.5% Capital Equipment 50,600 14,332 402,500 160,000 (242,500) -60.2% Total Expenditures 2,204,012 $ 2,135,346 $ 3,214,502 $ 3,323,708 $ 109,206 $ 3.4% Difference
FIRE PUBLIC SAFETY Fire
Breakdown by Category Breakdown by Program
PAGE 104 / BUDGET & ACTUALS BY DEPARTMENT
2021 2022 2023 2024 Actual ActualOriginal BudgetBudget $ % Revenues Intergovernmental 818,541 $ 1,009,744 $ 1,087,000 $ 1,087,000 $ - $ 0.0% Charges for Goods & Services 380,520 423,496 790,600 820,600 30,000 3.8% Miscellaneous 1,588 10,000 - 25,000 25,000Total Revenues 1,200,649 $ 1,443,240 $ 1,877,600 $ 1,932,600 $ 55,000 $ 2.9% Expenditures Fulltime 15,676,178 $ 16,962,869 $ 18,111,947 $ 19,990,980 $ 1,879,033 $ 10.4% Part-time 14,988 36,636 123,760 123,760 - 0.0% Overtime 2,856,971 2,474,532 1,690,000 1,690,000 - 0.0% OASI 320,411 342,574 332,628 368,437 35,809 10.8% Benefits 9,004,398 9,104,374 9,378,895 9,640,760 261,865 2.8% Total Personnel 27,872,946 28,920,985 29,637,230 31,813,937 2,176,707 7.3% Professional Services 422,131 551,697 512,747 564,262 51,515 10.0% Rentals 480,230 507,683 561,725 720,280 158,556 28.2% Repair & Maintenance 935,158 1,246,764 1,591,014 1,769,100 178,086 11.2% Supplies & Materials 1,536,741 1,330,050 1,334,594 1,546,631 212,037 15.9% Training & Education 192,265 212,672 266,300 311,890 45,590 17.1% Utilities 281,198 278,037 300,820 530,820 230,000 76.5% Lease - 10,340 - 10,591 10,591Total Other Operating 3,847,723 4,137,243 4,567,200 5,453,574 886,375 19.4% Total Operating Expenditures 31,720,669 33,058,228 34,204,430 37,267,511 3,063,082 9.0% Public Safety Bond 4,738,426 23,069,398 - - -Land - 293 - - -Buildings 194,137 2,091,364 - - -Equipment & Non-Capital Supplies 1,264,498 2,251,855 2,489,000 3,127,000 638,000 25.6% Total Capital Expenditures 6,197,061 27,412,910 2,489,000 3,127,000 638,000 25.6% Total Expenditures 37,917,730 $ 60,471,138 $ 36,693,430 $ 40,394,511 $ 3,701,082 $ 10.1% Fire Services 28,189,028 $ 29,273,942 $ 29,979,647 $ 32,214,581 $ 2,234,934 $ 7.5% Fire Prevention 2,243,974 2,385,255 2,438,423 2,623,457 185,033 7.6% Emergency Preparedness 364,828 408,818 486,666 542,212 55,545 11.4% Facilities 922,838 990,213 1,299,693 1,887,262 587,569 45.2% Capital 1,458,635 4,343,512 2,489,000 3,127,000 638,000 25.6% Public Safety Bond 4,738,426 23,069,398 - - -Total Expenditures by Program37,917,730 $ 60,471,138 $ 36,693,430 $ 40,394,511 $ 3,701,082 $ 10.1% Difference
POLICE Police
Breakdown by Category
Breakdown by Program
BUDGET & ACTUALS BY DEPARTMENT / PAGE 105
2021 2022 2023 2024 Actual ActualOriginal Budget Budget $ % Revenues Licenses & Permits 44,933 $ 38,677 $ 50,000 $ 50,000 $ - $ 0.0% Intergovernmental (Grants) 956,634 1,340,820 1,721,650 1,690,500 (31,150) -1.8% Charges for Goods & Services 134,880 139,669 150,500 150,500 - 0.0% Contributions & Fines 59,347 53,672 35,000 35,000 - 0.0% Miscellaneous Revenue 7,367 11,150 5,000 5,000 - 0.0% Total Revenues 1,203,161 $ 1,583,988 $ 1,962,150 $ 1,931,000 $ (31,150) $ -1.6% Expenditures Fulltime $ 22,187,312 $ 24,485,089 $ 26,729,335 $ 29,981,191 $ 3,251,856 12.2% Part-time 186,428 149,974 259,004 259,004 - 0.0% Overtime 1,838,070 2,105,015 1,230,500 1,253,000 22,500 1.8% OASI 447,906 490,824 508,861 560,463 51,602 10.1% Benefits 9,665,296 10,144,212 10,560,999 11,198,536 637,537 6.0% Total Personnel 34,325,012 37,375,113 39,288,699 43,252,194 3,963,495 10.1% Professional Services 937,163 1,208,135 1,418,823 1,520,486 101,663 7.2% Metro Communications 1,685,841 1,938,717 4,238,815 2,261,320 (1,977,495) -46.7% Rentals 1,046,321 1,074,464 1,364,760 1,710,068 345,308 25.3% Repair & Maintenance 957,792 1,143,885 979,125 990,675 11,550 1.2% Supplies & Materials 2,384,172 1,649,915 1,799,063 2,038,338 239,275 13.3% Training & Education 196,341 253,300 250,500 260,000 9,500 3.8% Utilities 363,475 379,726 382,530 389,500 6,970 1.8% Leases - 15,137 - 15,904 15,904Total Other Operating 7,571,105 7,663,279 10,433,616 9,186,291 (1,247,325) -12.0% Total Operating Expenditures 41,896,117 45,038,392 49,722,315 52,438,485 2,716,170 5.5% Capital Equipment 1,049,056 1,564,590 2,289,600 1,444,100 (845,500) -36.9% Total Expenditures 42,945,173 $ 46,602,982 $ 52,011,915 $ 53,882,585 $ 1,870,670 $ 3.6% Uniformed Services 30,840,626 $ 33,351,431 $ 35,506,399 $ 39,612,601 $ 4,106,203 $ 11.6% Investigation 5,272,545 5,450,005 5,500,806 5,823,976 323,170 5.9% Crime Lab 1,102,004 1,158,829 1,284,573 1,404,918 120,345 9.4% Records 928,267 950,115 1,017,107 1,090,817 73,710 7.2% Animal Control 1,003,087 1,115,414 1,257,505 1,327,492 69,986 5.6% Facilities 1,063,747 1,073,882 917,110 917,361 251 0.0% Metro Communications 1,685,841 1,938,717 4,238,815 2,261,320 (1,977,495) -46.7% Capital 1,049,056 1,564,590 2,289,600 1,444,100 (845,500) -36.9% Total Expenditures by Program42,945,173 $ 46,602,982 $ 52,011,915 $ 53,882,585 $ 1,870,670 $ 3.6% Difference
Highways and Streets
HIGHWAYS AND STREETS
Breakdown by Category
PAGE 106 / BUDGET & ACTUALS BY DEPARTMENT
HIGHWAYS & STREETS
2021 2022 2023 2024 Actual ActualOriginal BudgetBudget $ % Revenues Taxes - Frontage 4,947,278 $ 4,892,480 $ 5,095,697 $ 5,095,697 $ - $ 0.0% Licenses & Permits 272,910 278,346 179,030 214,100 35,070 19.6% Intergovernmental 4,635,289 4,552,279 5,255,759 49,255,759 44,000,000 837.2% Contributions 3,586,777 1,181,141 9,150,000 2,000,000 (7,150,000) -78.1% Charges for Goods & Services 744,346 1,375,470 1,064,140 1,741,580 677,440 63.7% Miscellaneous 285,557 162,558 100,000 3,310,000 3,210,000 3210.0% Total Revenues 14,472,157 $ 12,442,274 $ 20,844,626 $ 61,617,136 $ 40,772,510 $ 195.6% Lease Right-to-Use Revenue - 781,230 - - -Total Sources 14,472,157 $ 13,223,503 $ 20,844,626 $ 61,617,136 $ 48,393,633 $ 366.0% Expenditures Fulltime 7,027,414 $ 7,997,601 $ 8,998,014 $ 9,866,784 $ 868,770 $ 9.7% Wages Other Department 224,879 277,346 310,000 310,000 - 0.0% Part-time 433,795 610,151 893,883 893,883 - 0.0% Overtime 343,874 633,371 497,000 497,000 - 0.0% OASI 571,969 673,953 591,783 648,682 56,899 9.6% Benefits 2,812,421 3,109,874 3,301,962 3,326,111 24,149 0.7% Total Personnel 11,414,352 13,302,296 14,592,642 15,542,460 949,818 6.5% Professional Services 939,980 1,214,296 1,936,075 1,843,725 (92,349) -4.8% Rentals 4,160,807 3,520,827 4,348,937 4,020,579 (328,358) -7.6% Repair & Maintenance 5,777,565 7,222,008 5,859,071 7,025,341 1,166,270 19.9% Supplies & Materials 1,278,770 2,247,310 3,604,335 3,400,773 (203,561) -5.6% Training & Education 27,187 64,914 67,994 69,129 1,135 1.7% Utilities 1,835,128 1,695,235 2,250,085 2,018,434 (231,651) -10.3% Leases - 993,956 - 2,425,408 2,425,408Total Other Operating 14,019,437 16,958,546 18,066,495 20,803,389 2,736,894 15.1% Total Operating Expenditures 25,433,789 30,260,842 32,659,137 36,345,849 3,686,711 11.3% Land 4,891,513 4,344,226 2,000,000 3,700,000 1,700,000 85.0% Buildings - 32,504 100,000 1,000,000 900,000 900.0% Equipment & Non-Capital Supplies 101,122 777,226 790,000 330,000 (460,000) -58.2% Improvements Other Than Buildings 823,369 (1,968) - - -Infrastructure 38,922,059 50,474,226 64,683,159 104,472,845 39,789,686 61.5% Total Capital Expenditures 44,738,063 55,626,214 67,573,159 109,502,845 41,929,686 62.1% Total Expenditures 70,171,852 $ 85,887,056 $ 100,232,296 $ 145,848,694 $ 45,616,398 $ 45.5% Lease Right-to-Use Expense - 781,230 - - -Total Uses 70,171,852 $ 86,668,286 $ 100,232,296 $ 145,848,694 $ 45,616,398 $ 45.5% Street Maintenance* 6,874,116 $ 8,328,727 $ 7,840,598 $ 8,701,778 $ 861,180 11.0% Street Winter 6,987,629 7,894,220 10,121,844 11,694,363 1,572,520 15.5% Engineering 5,452,779 6,548,399 7,453,294 8,423,210 969,916 13.0% Lights, Signals & Signs 5,199,265 5,906,496 6,760,402 7,043,498 283,096 4.2% Centralized Facilities 920,000 1,583,000 483,000 483,000 - 0.0% Capital 44,738,063 55,626,214 67,573,159 109,502,845 41,929,686 62.1% Total Expenditures by Program70,171,852 $ 85,887,056 $ 100,232,296 $ 145,848,694 $ 45,616,397 $ 45.5% *added Lease Principal/Interest to Street Maintenance
Difference Breakdown by Program
STORM DRAINAGE Storm Drainage
Breakdown by Category
BUDGET & ACTUALS BY DEPARTMENT / PAGE 107
2021 2022 2023 2024 Actual ActualOriginal BudgetBudget $ % Revenues Taxes 11,376,491 $ 12,050,967 $ 12,060,124 $ 13,517,970 $ 1,457,846 $ 12.1% Special Assessments 3,309,400 2,262,761 1,774,920 1,774,920 - 0.0% Miscellaneous (Interest, Contributions) (12,467) (155,667) 40,000 40,000 - 0.0% Other (SRF Notes, Transfer-In) 2,474,636 2,094,039 - 3,500,000 3,500,000Total Revenues 17,148,060 $ 16,252,100 $ 13,875,044 $ 18,832,890 $ 4,957,846 $ 35.7% Expenditures Fulltime 1,229,849 $ 1,483,260 $ 1,810,753 $ 1,965,101 $ 154,348 $ 8.5% Wages Other Departments 151,839 173,007 295,000 295,000 - 0.0% Part-time 12,949 37,484 44,000 44,000 - 0.0% Overtime 34,070 61,634 26,050 50,000 23,950 91.9% OASI 91,482 116,785 125,835 138,313 12,478 9.9% Benefits 422,934 493,767 552,668 524,438 (28,230) -5.1% Total Personnel 1,943,123 2,365,938 2,854,306 3,016,852 162,546 5.7% Professional Services 130,798 106,424 326,470 168,845 (157,625) -48.3% Rentals 180,691 204,391 207,120 311,879 104,759 50.6% Repair & Maintenance 770,553 958,920 1,229,669 1,291,999 62,330 5.1% Supplies & Materials 56,829 124,667 95,238 112,225 16,987 17.8% Training & Education 6,613 9,250 16,110 16,110 - 0.0% Utilities 4,231 4,864 10,085 10,085 - 0.0% Total Other Operating 1,149,715 1,408,516 1,884,692 1,911,143 26,451 1.4% Total Operating Expenditures 3,092,838 3,774,454 4,738,997 4,927,994 188,997 4.0% Land 933,003 1,706,695 490,000 1,180,000 690,000 140.8% Equipment - 672,119 105,000 275,000 170,000 161.9% Infrastructure 9,100,218 7,590,539 10,645,000 10,950,000 305,000 2.9% Total Capital Expenditures 10,033,222 9,969,353 11,240,000 12,405,000 1,165,000 10.4% Debt 1,132,329 955,308 1,219,593 1,732,702 513,109 42.1% Total Expenditures 14,258,389 $ 14,699,115 $ 17,198,590 $ 19,065,696 $ 1,867,106 $ 10.9% Difference
PUBLIC HEALTH
Breakdown by Category
Breakdown by Program
PAGE 108 / BUDGET & ACTUALS BY DEPARTMENT
PUBLIC
Public Health 2021 2022 2023 2024 Actual Actual Original Budget Budget $ % Revenues Charges (Net) 2,578,897 $ 3,341,080 $ 3,558,942 $ 3,694,455 $ 135,513 $ 3.8% Intergovernmental 4,838,418 6,545,238 7,404,552 6,208,159 (1,196,393) -16.2% Licenses & Permits 329,169 731,343 333,610 333,610 - 0.0% Fines, Contributions, Interest 210,411 208,959 158,000 178,000 20,000 12.7% Miscellaneous 395,159 350,602 582,000 884,500 302,500 52.0% Total Revenues 8,352,053 $ 11,177,223 $ 12,037,104 $ 11,298,724 $ (738,380) $ -6.1% Lease Right-to-Use Revenue - - - 250,000 250,000Total Sources 8,352,053 $ 11,177,223 $ 12,037,104 $ 11,548,724 $ 371,501 $ 3.1% Expenditures Fulltime 5,749,399 $ 5,956,620 $ 6,826,992 $ 7,389,217 $ 562,225 $ 8.2% Part-time 987,055 1,276,874 1,566,746 1,536,310 (30,436) -1.9% Overtime 51,133 57,080 57,000 63,000 6,000 10.5% OASI 469,902 506,877 567,460 612,608 45,148 8.0% Benefits 1,916,324 1,903,207 2,246,125 2,304,160 58,035 2.6% Total Personnel 9,173,813 9,700,658 11,264,323 11,905,295 640,972 5.7% Professional Services 3,125,833 3,812,253 3,981,748 4,722,599 740,851 18.6% Rentals 310,718 339,788 418,868 475,303 56,435 13.5% Repair & Maintenance 117,699 144,926 1,691,923 343,955 (1,347,968) -79.7% Supplies & Materials 1,522,344 1,652,223 1,428,437 1,391,369 (37,068) -2.6% Training & Education 62,814 132,993 128,117 132,117 4,000 3.1% Utilities 128,530 136,438 146,944 146,944 - 0.0% Leases - 59,324 - 340,304 340,304Other Current - 82,122 - - -Total Other Operating 5,267,938 6,360,067 7,796,037 7,552,591 (243,445) -3.1% Total Operating Expenditures 14,441,751 16,060,725 19,060,360 19,457,887 397,527 2.1% Capital Equipment 215,354 77,228 141,400 138,000 (3,400) -2.4% Total Expenditures 14,657,105 $ 16,137,953 $ 19,201,760 $ 19,595,887 $ 394,127 $ 2.1% Lease Right-to-Use Expense - - - 250,000 250,000Total Uses 14,657,105 $ 16,137,953 $ 19,201,760 $ 19,845,887 $ 3,707,934 $ 19.3% 2021 2022 2023 2024 Actual Actual Original Budget Budget $ % Intergovernmental - Grants 3,977,654 $ 4,604,806 $ 5,100,552 $ 3,879,159 $ (1,221,393) $ -23.9% Charges (Net) 2,249,501 3,000,875 3,219,291 3,349,055 129,764 4.0% Miscellaneous 437,003 395,868 602,000 447,000 (155,000) -25.7% Total Revenues 6,664,158 $ 8,001,549 $ 8,921,843 $ 7,675,214 $ (1,246,629) $ -14.0% Community Clinics (Medical & Dental) 10,271,051 $ 11,397,712 $ 13,753,877 $ 13,327,410 $ (426,467) $ -3.1% Total Expenditures 10,271,051 $ 11,397,712 $ 13,753,877 $ 13,327,410 $ (426,467) $ -3.1% Licenses and Permits 329,169 $ 731,343 $ 333,610 $ 333,610 $ - $ 0.0% Intergovernmental - Grants 860,764 1,896,026 2,304,000 2,329,000 25,000 1.1% Charges 329,396 340,205 339,651 345,400 5,749 1.7% Contributions/Settlements 58,067 29,276 49,000 506,500 457,500 933.7% Miscellaneous (Fines) 110,500 132,150 89,000 109,000 20,000 22.5% Total Revenues 1,687,896 $ 3,129,000 $ 3,115,261 $ 3,623,510 $ 508,249 $ 16.3% Community Safety & Enforcement 2,594,729 $ 2,724,668 $ 2,888,524 $ 3,383,332 $ 494,808 $ 17.1% Community Health & Wellness 786,228 851,971 1,460,458 1,589,645 129,187 8.8% LINK Triage Center 789,744 1,086,374 957,500 1,157,500 200,000 20.9% 0.0% Total Expenditures 4,170,700 $ 4,663,013 $ 5,306,483 $ 6,130,477 $ 823,994 $ 15.5%
HEALTH
Difference
Community Health, Safety and Enforcement Falls Community Health Clinic Difference
LIBRARY Library
CULTURE & RECREATION
Breakdown by Category
Breakdown by Program
BUDGET & ACTUALS BY DEPARTMENT / PAGE 109
2021 2022 2023 2024 Actual ActualOriginal BudgetBudget $ % Revenues Intergovernmental 1,290,000 $ 1,331,002 $ 1,410,000 $ 1,485,000 $ 75,000 $ 5.3% Charges 28,667 51,411 48,000 53,000 5,000 10.4% Fines & Forfeitures 41,839 34,682 50,000 30,000 (20,000) -40.0% Contributions 8,023 84,975 10,000 21,000 11,000 110.0% Miscellaneous 43,515 25,028 15,000 15,000 - 0.0% Total Revenues 1,412,044 $ 1,527,098 $ 1,533,000 $ 1,604,000 $ 71,000 $ 4.6% Expenditures Fulltime 4,205,418 $ 4,239,030 $ 4,661,690 $ 4,958,080 $ 296,390 $ 6.4% Part-time 188,668 282,403 278,697 310,000 31,303 11.2% Overtime 242 388 500 500 - 0.0% OASI 290,589 300,000 328,701 347,110 18,409 5.6% Benefits 1,339,653 1,283,134 1,465,414 1,464,849 (565) 0.0% Total Personnel 6,024,571 6,104,954 6,735,002 7,080,539 345,537 5.1% Professional Services 392,159 466,801 432,840 443,186 10,346 2.4% Siouxland Museum Support 697,840 737,405 861,623 906,620 44,997 5.2% Rentals 296,616 349,046 395,427 491,509 96,082 24.3% Repair & Maintenance 564,596 546,135 626,300 593,300 (33,000) -5.3% Supplies & Materials 441,068 451,825 391,122 271,590 (119,532) -30.6% Training & Education 12,824 26,663 18,025 20,070 2,045 11.3% Utilities 284,604 295,246 300,308 314,406 14,098 4.7% Leases - 19,240 - 213,712 213,712Total Other Operating 2,689,708 2,892,361 3,025,645 3,254,393 228,748 7.6% Total Operating Expenditures 8,714,279 8,997,315 9,760,647 10,334,932 574,285 5.9% Equipment 1,295 142,987 116,400 75,000 (41,400) -35.6% Books & Audio-Visual Items 966,345 824,576 869,000 846,000 (23,000) -2.6% Total Capital Expenditures 967,640 967,563 985,400 921,000 (64,400) -6.5% Total Expenditures 9,681,919 $ 9,964,878 $ 10,746,047 $ 11,255,932 $ 509,885 $ 4.7% Collections 186,330 $ 294,637 $ 242,600 $ 238,350 $ (4,250) $ -1.8% Operations 6,051,166 6,134,858 6,763,139 7,084,363 321,224 4.7% Technology 624,678 622,158 688,504 815,082 126,578 18.4% Program Support 74,585 59,506 53,856 62,200 8,344 15.5% Facilities 1,079,680 1,148,750 1,150,925 1,228,318 77,393 6.7% Siouxland Museum 697,840 737,405 861,623 906,620 44,997 5.2% Capital 967,640 967,563 985,400 921,000 (64,400) -6.5% Total Expenditures by Program9,681,919 $ 9,964,878 $ 10,746,047 $ 11,255,932 $ 509,885 $ 4.7%
Difference
PARKS AND RECREATION Parks and Recreation
Breakdown by Category
Breakdown by Program
PAGE 110 / BUDGET & ACTUALS BY DEPARTMENT
2021 2022 2023 2024 Actual ActualOriginal BudgetBudget $ % Revenues Taxes (frontage) 3,354 $ 3,305 $ 3,650 $ 3,650 $ - $ 0.0% Charges 2,048,677 2,096,305 2,193,000 2,193,000 - 0.0% Licenses & Permits 32,900 38,150 35,000 35,000 - 0.0% Intergovernmental 534,630 182,617 555,000 - (555,000) -100.0% Contributions 268,838 778,105 1,678,000 788,000 (890,000) -53.0% Miscellaneous 676,993 473,455 26,800 26,800 - 0.0% Total Revenues 3,565,392 $ 3,571,937 $ 4,491,450 $ 3,046,450 $ (1,445,000) $ -32.2% Expenditures Fulltime 4,713,069 $ 4,962,920 $ 5,277,938 $ 5,922,316 $ 644,378 $ 12.2% Part-time 3,448,905 4,525,406 5,149,366 5,389,659 240,293 4.7% Overtime 131,794 164,019 70,000 70,000 - 0.0% OASI 602,254 702,573 765,647 810,152 44,505 5.8% Benefits 1,973,382 2,073,977 2,244,960 2,314,179 69,219 3.1% Total Personnel 10,869,405 12,428,896 13,507,911 14,506,305 998,394 7.4% Professional Services 3,101,620 3,254,826 3,909,147 4,765,861 856,714 21.9% Rentals 500,237 420,907 455,258 546,915 91,657 20.1% Repair & Maintenance 3,235,669 3,866,527 3,661,938 3,790,100 128,162 3.5% Supplies & Materials 1,037,315 1,133,550 1,163,685 1,188,674 24,989 2.1% Training & Education 48,846 42,069 60,000 60,000 - 0.0% Utilities 1,794,581 1,984,020 1,895,790 2,189,460 293,670 15.5% Leases - 9,316 - 11,282 11,282Other Current 8,976 600 - - -Total Other Operating 9,727,244 10,711,815 11,145,818 12,552,291 1,406,473 12.6% Total Operating Expenditures 20,596,649 23,140,711 24,653,729 27,058,597 2,404,868 9.8% Land 1,095,108 265,652 1,280,000 1,830,000 550,000 43.0% Buildings 4,549 52,640 400,000 300,000 (100,000) -25.0% Improvements Other Than Buildings 5,588,967 6,434,195 8,690,600 11,674,500 2,983,900 34.3% Equipment 1,271,396 607,080 2,175,400 1,869,000 (306,400) -14.1% Total Capital Expenditures 7,960,020 7,359,566 12,546,000 15,673,500 3,127,500 24.9% Total Expenditures 28,556,669 $ 30,500,277 $ 37,199,729 $ 42,732,097 $ 5,532,368 $ 14.9% Parks & Playgrounds 7,405,818 $ 7,969,625 $ 8,333,761 $ 9,534,734 $ 1,200,973 $ 14.4% Aquatics 3,621,441 4,684,277 4,754,628 5,268,108 513,480 10.8% Outdoor Sports 2,534,897 2,762,727 3,307,187 3,571,842 264,655 8.0% Great Plains Zoo 1,854,176 2,016,719 2,131,773 2,460,409 328,636 15.4% Indoor Recreation - - - 1,313,074 1,313,074Community Centers 1,717,359 1,853,268 2,068,343 475,000 (1,593,343) -77.0% External Property Maintenance 863,415 1,083,512 969,820 1,141,080 171,260 17.7% Forestry 1,845,787 1,858,467 2,136,435 2,297,931 161,496 7.6% External Special Events 393,348 407,108 439,802 454,220 14,418 3.3% Music & Theater 240,409 255,008 254,479 280,198 25,719 10.1% Centralized Facilities (Park Shop) 120,000 250,000 257,500 262,000 4,500 1.7% Capital 7,960,020 7,359,566 12,546,000 15,673,500 3,127,500 24.9% 0.0% Total Expenditures by Program28,556,669 $ 30,500,277 $ 37,199,729 $ 42,732,097 $ 5,532,368 $ 14.9% Difference
ENTERTAINMENT VENUES
Breakdown by Category
BUDGET & ACTUALS BY DEPARTMENT / PAGE 111
2021 2022 2023 2024 Actual ActualOriginal BudgetBudget $ % Revenues Entertainment Tax 9,368,174 $ 10,584,396 $ 10,717,191 $ 11,558,160 $ 840,969 $ 7.8% Other Revenue 885,175 2,418,598 50,000 50,000 - 0.0% Total Revenues 10,253,349 $ 13,002,994 $ 10,767,191 $ 11,608,160 $ 840,969 $ 7.8% Expenditures Events Complex Property Insurance 137,312 $ 132,024 $ 145,227 $ 159,750 $ 14,523 $ 10.0% Professional Services - - 200,000 500,000 300,000 150.0% Repair & Maintenance 356,194 497,412 1,478,430 1,377,567 (100,863) -6.8% Supplies & Materials 138,570 109,648 143,520 149,261 5,741 4.0% Total Operating Expenditures 632,076 739,084 1,967,177 2,186,578 219,401 11.2% Buildings 1,295,246 418,850 875,000 1,480,000 605,000 69.1% Equipment 371,693 462,486 1,990,000 1,659,000 (331,000) -16.6% Total Capital Expenditures 1,666,939 881,336 2,865,000 3,139,000 274,000 9.6% Total Events Complex Expenditures 2,299,015 $ 1,620,420 $ 4,832,177 $ 5,325,578 $ 493,401 $ 10.2% Sioux Falls Stadium Property Insurance 8,710 $ 8,389 $ 9,228 $ 10,151 $ 923 $ 10.0% Operating Contract - - 196,350 200,000 3,650 1.9% Professional Services - - 200,000 200,000 - 0.0% Repair & Maintenance 125,489 56,693 200,000 408,000 208,000 104.0% Supplies & Materials 103,010 30,061 30,000 31,200 1,200 4.0% Total Operating Expenditures 237,209 95,143 635,578 849,351 213,773 33.6% Capital Expenditures - - 269,000 41,000 (228,000) -84.8% 0.0% Total Sioux Falls Stadium Expenditures237,209 $ 95,143 $ 904,578 $ 890,351 $ (14,227) $ -1.6% Washington Pavilion Property Insurance 91,535 $ 88,168 $ 96,985 $ 106,684 $ 9,699 $ 10.0% Operating Contract 1,750,000 1,750,000 1,750,000 1,750,000 - 0.0% Professional Services - 1,340 - - -Rentals 56,245 234,300 300,000 300,000 - 0.0% Repair & Maintenance 303,431 533,457 600,000 635,000 35,000 5.8% Supplies & Materials 275,961 23,445 100,000 104,000 4,000 4.0% Total Operating Expenditures 2,477,172 2,630,710 2,846,985 2,895,684 48,699 1.7% Buildings 565,294 384,653 775,000 1,730,000 955,000 123.2% Equipment 231,162 91,577 1,647,000 685,000 (962,000) -58.4% Total Capital Expenditures 796,456 476,230 2,422,000 2,415,000 (7,000) -0.3% Total Washington Pavilion Expenditures3,273,628 $ 3,106,940 $ 5,268,985 $ 5,310,684 $ 41,699 $ 0.8% Orpheum Theater Property Insurance 6,358 $ 6,124 $ 6,736 $ 7,410 $ 674 $ 10.0% Operating Contract 345,000 345,000 345,000 345,000 - 0.0% Repair & Maintenance 74,000 304,663 208,000 208,000 - 0.0% Supplies & Materials - - 52,000 54,080 2,080 4.0% Total Operating Expenditures 425,358 655,787 611,736 614,490 2,754 0.5% Buildings 18,082 168,900 650,000 500,000 (150,000) -23.1% Equipment 30,855 - 65,000 300,000 235,000 361.5% Total Capital Expenditures 48,937 168,900 715,000 800,000 85,000 11.9% 0.0% Total Orpheum Theater Expenditures 474,295 $ 824,687 $ 1,326,736 $ 1,414,490 $ 87,754 $ 6.6% Difference
Entertainment Venues
ENTERTAINMENT VENUES (CONT.)
Breakdown by Program
PAGE 112 / BUDGET & ACTUALS BY DEPARTMENT
2021 2022 2023 2024 Actual ActualOriginal BudgetBudget $ % Events Complex 2,299,015 $ 1,620,420 $ 4,832,177 $ 5,325,578 $ 493,401 $ 10.2% Orpheum Theater 474,295 824,687 1,326,736 1,414,490 87,754 6.6% Washington Pavilion 3,273,628 3,106,940 5,268,985 5,310,684 41,699 0.8% Sioux Falls Stadium 237,209 95,143 904,578 890,351 (14,227) -1.6% Total Expenditures by Program 6,284,147 $ 5,647,190 $ 12,332,476 $ 12,941,103 $ 608,627 $ 4.9%
Difference
URBAN & ECONOMIC DEVELOPMENT
PLANNING AND DEVELOPMENT SERVICES Planning and Development Services
Breakdown by Category
Breakdown by Program
BUDGET & ACTUALS BY DEPARTMENT / PAGE 113
2021 2022 2023 2024 Actual ActualOriginal BudgetBudget $ % Revenues Lodging Tax (Experience SF) 1,100,743 $ 1,319,748 $ 1,225,000 $ 1,600,000 $ 375,000 $ 30.6% Occupational BID Tax (Experience SF)1,944,815 2,088,417 2,050,000 2,295,000 245,000 12.0% Main Street BID & Hilton BID 268,950 290,052 285,000 565,000 280,000 98.2% Licenses & Permits 4,904,045 8,837,621 4,177,425 3,912,425 (265,000) -6.3% Intergovernmental 157,395 182,166 300,240 1,049,593 749,353 249.6% Charges for Goods & Services 653,580 1,017,944 506,170 406,170 (100,000) -19.8% Fines & Forfeitures 94,735 188,918 120,000 120,000 - 0.0% Miscellaneous Revenue - 26,740 22,000 - (22,000) -100.0% Total Revenues 9,124,263 $ 13,951,606 $ 8,685,835 $ 9,948,188 $ 1,262,353 $ 14.5% Expenditures Fulltime 3,906,620 $ 4,105,188 $ 4,485,917 $ 4,972,225 $ 486,308 $ 10.8% Part-time 25,790 34,148 44,000 46,680 2,680 6.1% Overtime 7,710 21,737 22,500 22,500 - 0.0% OASI 275,122 296,333 315,882 355,811 39,929 12.6% Benefits 1,147,581 1,166,431 1,282,566 1,403,898 121,332 9.5% Total Personnel 5,362,823 5,623,837 6,150,865 6,801,114 650,249 10.6% Professional Services 414,385 10,513,671 781,129 1,674,409 893,280 114.4% Rentals 465,315 497,760 536,533 664,381 127,848 23.8% Repair & Maintenance 82,107 112,359 166,901 158,830 (8,071) -4.8% Supplies & Materials 185,214 101,135 156,262 143,423 (12,839) -8.2% Training & Education 28,779 51,930 55,020 67,509 12,489 22.7% Utilities 85,679 49,075 30,100 34,443 4,343 14.4% Leases - 2,928 - 3,075 3,075Neighborhood Programs 110,421 154,702 50,000 50,000 - 0.0% Experience Sioux Falls 3,037,046 3,404,621 3,275,000 3,895,000 620,000 18.9% Downtown Sioux Falls 347,762 419,852 423,353 698,353 275,000 65.0% Forward Sioux Falls 400,000 500,000 500,000 500,000 - 0.0% Hilton Hotel Occupancy Fee Program 72,251 87,670 85,000 90,000 5,000 5.9% SF Development Foundation 275,000 275,000 288,922 320,000 31,078 10.8% Southeast Tech 150,000 200,000 205,000 205,000 - 0.0% USD Discovery District 150,000 4,150,000 153,750 153,750 - 0.0% Total Other Operating 5,803,959 20,520,703 6,706,970 8,658,173 1,951,203 29.1% Total Operating Expenditures 11,166,783 26,144,540 12,857,835 15,459,286 2,601,451 20.2% Improvements Other Than Buildings 12,000 $ 48,000 $ 35,000 $ 35,000 $ - $ 0.0% Equipment - - - 152,500 152,500Intangibles (Façade Revitalization) - - 100,000 100,000 - 0.0% Total Capital Expenditures 12,000 $ 48,000 $ 135,000 $ 287,500 $ 152,500 $ 113.0% Total Expenditures 11,178,783 $ 26,192,540 $ 12,992,835 $ 15,746,786 $ 2,753,951 $ 21.2% Development Services 3,467,690 $ 17,739,924 $ 4,209,034 $ 5,326,179 $ 1,117,145 $ 26.5% Building Services 3,645,392 3,756,312 4,063,922 4,619,922 556,001 13.7% Neighborhood Services 761,641 943,922 1,024,880 1,053,185 28,305 2.8% BID and Lodging Tax 3,292,060 3,704,382 3,560,000 4,460,000 900,000 25.3% Capital 12,000 48,000 135,000 287,500 152,500 113.0% Total Expenditures by Program11,178,783 $ 26,192,540 $ 12,992,835 $ 15,746,786 $ 2,753,951 $ 21.2%
Difference
HOUSING Housing
Breakdown by Category
Breakdown by Program
PAGE 114 / BUDGET & ACTUALS BY DEPARTMENT
2021 2022 2023 2024 Actual ActualOriginal BudgetBudget $ % Revenues Intergovernmental 1,597,588 $ 3,103,334 $ 3,988,452 $ 4,105,099 $ 116,647 $ 2.9% Charges for Goods & Services 41,085 31,310 - - -Program Income 1,232,026 914,606 713,380 727,966 14,586 2.0% Revitalization Revolving Income 1,258,400 219,900 400,000 - (400,000) -100.0% State Loan Proceeds 142,507 187,047 110,557 164,010 53,453 48.3% Interest Income and Other (4,183) (43,938) 22,000 22,000 - 0.0% Transfer from General Fund 4,035,000 1,648,000 1,710,000 2,170,232 460,232 26.9% Total Revenues 8,302,423 $ 6,060,259 $ 6,944,389 $ 7,189,307 $ 244,918 $ 3.5% Expenditures Fulltime 497,539 $ 487,475 $ 601,390 $ 663,185 $ 61,795 $ 10.3% Part-time - 10,676 40,000 105,700 65,700 164.3% Overtime - 1,923 1,504 1,504 - 0.0% OASI 34,455 34,956 37,844 46,308 8,464 22.4% Benefits 166,091 134,778 188,649 230,889 42,240 22.4% Total Personnel Service 698,086 669,808 869,387 1,047,586 178,199 20.5% Professional Services 3,705,139 5,268,142 9,507,355 9,634,610 127,255 1.3% Rentals 6,024 8,825 12,806 13,944 1,138 8.9% Repair and Maintenance - - 1,400 600 (800) -57.1% Supplies & Materials 11,639 10,703 25,404 56,555 31,151 122.6% Training & Education 7,466 3,996 12,800 12,600 (200) -1.6% Utilities 131 1,518 500 500 - 0.0% Lease Payments - 166 - 200 200Miscellaneous Uncollectibles 697,914 125,565 - - -Total Other Operating 4,428,313 5,418,915 9,560,265 9,719,009 158,744 1.7% Total Expenditures 5,126,398 $ 6,088,723 $ 10,429,652 $ 10,766,595 $ 336,943 $ 3.2% Revitalization 566,099 $ 548,003 $ 1,041,892 $ 800,000 $ (241,892) $ -23.2% Rehabilitation 987,480 1,986,805 2,305,525 2,375,131 69,606 3.0% Housing Fund (Housing Development)1,884,921 1,236,818 4,900,000 3,577,050 (1,322,950) -27.0% Rental Assistance 363,054 331,210 390,000 390,000 - 0.0% Homebuyers Assistance 14,977 69,000 - - -Community Outreach 699,461 1,402,667 1,093,099 2,686,043 1,592,944 145.7% Administration 610,406 514,220 699,136 938,372 239,236 34.2% Total Expenditures by Program5,126,398 $ 6,088,723 $ 10,429,652 $ 10,766,595 $ 336,943 $ 3 2%
Difference
TAX INCREMENT FINANCING FUND
Tax Increment Financing Fund
TRANSIT
Breakdown by Category
BUDGET & ACTUALS BY DEPARTMENT / PAGE 115
2021 2022 2023 2024 Actual ActualOriginal Budget Budget $ % Revenues Property Taxes (TIF) 3,111,217 $ 3,346,430 $ 7,735,000 $ 8,285,000 $ 550,000 $ 7.1% Total Revenues 3,111,217 $ 3,346,430 $ 7,735,000 $ 8,285,000 $ 550,000 $ 7.1% Expenses TIF 7 Minnesota Center 3,428 $ - $ - $ - $ - $TIF 10 CNA Surety 415,928 434,702 490,000 500,000 10,000 2.0% TIF 11 Bancroft 54,777 64,395 80,000 80,000 - 0.0% TIF 12 Uptown-Dekalb 294,521 261,053 300,000 340,000 40,000 13.3% TIF 13 Raven Corporate 193,094 190,198 245,000 250,000 5,000 2.0% TIF 14 Hilton Hotel 230,267 202,210 270,000 285,000 15,000 5.6% TIF 15 Sports Complex 921,339 911,757 1,000,000 1,200,000 200,000 20.0% TIF 16 Whittier Heights 166,533 336,872 420,000 460,000 40,000 9.5% TIF 18 Phillips Ave Lofts 129,492 145,707 210,000 205,000 (5,000) -2.4% TIF 20 Washington Square 337,342 320,336 450,000 470,000 20,000 4.4% TIF 21 Cascade 364,496 384,397 530,000 605,000 75,000 14.2% TIF 23 Foundation Park - 94,803 3,640,000 3,250,000 (390,000) -10.7% TIF 23 Steel District - - 50,000 275,000 225,000 450.0% TIF 23 Cherapa Place - - 50,000 365,000 315,000 630.0% Total Expenses 3,111,217 $ 3,346,430 $ 7,735,000 $ 8,285,000 $ 550,000 $ 7.1% Difference Transit 2021 2022 2023 2024 Actual ActualOriginal BudgetBudget $ % Revenues General Fund Transfer-in 6,004,900 $ 6,285,047 $ 6,873,599 $ 7,479,807 $ 606,208 $ 8.8% Sales Tax Fund Transfer-in 750,000 750,000 850,000 977,000 127,000 14.9% Miscellaneous 59,800 - - - -Intergovernmental 5,202,322 6,929,676 14,594,508 3,706,658 (10,887,850) -74.6% 0.0% Total Revenues 12,017,022 $ 13,964,723 $ 22,318,107 $ 12,163,464 $ (10,154,643) $ -45.5% Expenditures Fulltime - $ 80,570 $ 85,027 $ 95,008 $ 9,981 $ 11.7% OASI - 5,955 6,266 7,416 1,150 18.4% Benefits - 10,599 12,126 13,420 1,294 10.7% Total Personnel Service - 97,124 103,419 119,645 16,226 15.7% Professional Services 675,250 904,464 1,583,583 1,478,418 (105,165) -6.6% Operating Agreement 8,471,381 8,931,138 9,671,771 11,696,918 2,025,147 20.9% Rentals 47,204 43,525 46,777 62,519 15,742 33.7% Repair and Maintenance - 760 300,000 300,000 - 0.0% Supplies and Materials - 5,762 - - -Utilities - 2,044 - - -Leases - - - 106,000 106,000Transit HQ Remodel/Expansion - - 1,000,000 1,000,000 - 0.0% Other Operating 5,142 - - - -Total Operating Expenditures 9,198,977 9,887,693 12,602,131 14,643,856 2,041,725 16.2% Buildings - 12,298 - 900,000 900,000Equipment 648,395 534,300 400,000 1,300,000 900,000 225.0% Total Capital Expenditures 648,395 546,598 400,000 2,200,000 1,800,000 450.0% Total Expenditures 9,847,372 $ 10,531,415 $ 13,105,550 $ 16,963,501 $ 3,857,951 $ 29.4%
Difference
POWER AND DISTRIBUTION FUND
Power and Distribution Fund
Budget by Category
PAGE 116 / BUDGET & ACTUALS BY DEPARTMENT
ENTERPRISE FUNDS
2021 2022 2023 2024 Actual Actual Original BudgetBudget $ % Revenues Charges for Services 9,891,110 $ 9,555,088 $ 10,699,758 $ 12,149,843 $ 1,450,085 $ 13.6% Other (148,585) (35,270) 64,410 64,410 - 0.0% Total Revenues 9,742,525 $ 9,519,818 $ 10,764,168 $ 12,214,253 $ 1,450,085 $ 13.5% Expenditures Fulltime $ 1,083,814 $ 545,251 $ 633,330 $ 705,360 72,030 $ 11.4% Part-time 57,578 59,087 61,517 61,517 - 0.0% Overtime 57,038 20,614 21,000 21,000 - 0.0% OASI 85,319 44,741 39,380 44,545 5,165 13.1% Benefits 401,227 196,140 213,481 232,486 19,005 8.9% Total Personnel 1,684,976 865,833 968,708 1,064,908 96,200 9.9% Professional Services 152,441 31,441 120,084 118,051 (2,033) -1.7% Rentals 189,561 154,017 132,912 195,195 62,283 46.9% Repair & Maintenance 486,886 379,779 249,026 224,714 (24,312) -9.8% Supplies & Materials 6,240,993 5,864,978 6,605,499 7,258,131 652,632 9.9% Training & Education 23,247 18,160 20,015 20,015 - 0.0% Utilities (cost of energy) 21,388 24,155 23,563 24,926 1,363 5.8% Uncollectible Receivables 70,539 24,242 - - -Total Other Operating 7,185,055 6,496,772 7,151,099 7,841,032 689,933 9.6% Total Operating Expenditures 8,870,031 7,362,605 8,119,807 8,905,940 786,133 9.7% Equipment 244,119 66,613 191,000 220,000 29,000 15% Building - 51,259 - - -Infrastructure 81,517 1,968,526 1,280,000 6,882,000 5,602,000 437.7% Total Capital Expenditures 325,636 2,086,398 1,471,000 7,102,000 5,631,000 382.8% Debt and Lease Payments - 1,464 - 3,500 3,500Total Expenditures 9,195,667 $ 9,450,467 $ 9,590,807 $ 16,011,440 $ 6,420,633 $ 66.9% Revenues Net Expenditures 546,858 $ 69,351 $ 1,173,361 $ (3,797,187) $ (4,970,548) $ Adjustment for Net Income Capital 325,636 2,086,399 1,471,000 7,102,000 Debt and Lease Principal Payments - 1,437 3,500 3,500 Depreciation (1,704,348) (1,820,206) (1,900,000) (1,900,000) Amortization - (1,443) (3,500) (3,500) Other Adjustments 2,802,890 (297,125) -Net Income 1,971,036 $ 38,413 $ 744,361 $ 1,404,813 $ Difference
PUBLIC PARKING FUND
Public Parking Fund
Budget by Category
BUDGET & ACTUALS BY DEPARTMENT / PAGE 117
2021 2022 2023 2024 Actual ActualOriginal BudgetBudget $ % Revenues Charges for Goods & Services $ 2,167,525 $ 2,354,913 $ 2,664,496 $ 2,730,132 $ 65,636 2.5% Fines & Forfeitures 524,968 450,377 534,335 534,335 - 0.0% Other Financing - 311,380 - - -Miscellaneous 10,089 49,126 8,500 8,500 - 0.0% Total Revenues 2,702,582 $ 3,165,796 $ 3,207,331 $ 3,272,967 $ 65,636 $ 2.0% Expenditures Fulltime $ 492,848 $ 449,286 $ 553,313 $ 503,508 $ (49,805) -9.0% Part-time 3,840 - 7,000 7,000 - 0.0% Overtime 3,010 2,624 3,000 3,000 - 0.0% OASI 35,807 32,355 39,843 36,000 (3,843) -9.6% Benefits 199,785 183,161 245,199 231,836 (13,363) -5.4% Total Personnel 735,290 667,426 848,355 781,344 (67,011) -7.9% Professional Services 332,998 343,880 281,814 331,201 49,387 17.5% Rentals 19,538 33,607 38,144 47,750 9,606 25.2% Repair & Maintenance 81,011 380,866 245,225 245,225 - 0.0% Supplies & Materials 83,459 84,726 104,626 104,926 300 0.3% Training & Education 695 695 3,500 3,500 - 0.0% Utilities 107,229 115,114 118,181 124,832 6,651 5.6% Other Current 4,891 10,715 8,000 8,000 - 0.0% Uncollectible Receivables 4,894 (1,186) - - -Total Other Operating 634,715 968,417 799,490 865,433 65,943 8.2% Total Operating Expenditures 1,370,005 1,635,843 1,647,845 1,646,777 (1,068) -0.1% Improvements Other Than Buildings 38,938 65,479 65,000 65,000 - 0.0% Equipment - - 100,000 - (100,000) -100.0% Total Capital Expenditures 38,938 65,479 165,000 65,000 (100,000) -60.6% 0.0% Debt and Lease Payments 1,529,759 1,553,086 1,575,232 1,653,969 78,737 5.0% Total Expenditures 2,938,702 $ 3,254,408 $ 3,388,077 $ 3,365,746 $ (22,331) $ -0.7% Revenues Net Expenditures (236,120) $ (88,612) $ (180,746) $ (92,779) $ 87,967 $ Adjustment for Net Income Capital 38,938 65,453 165,000 65,000 Debt and Lease Principal Payments 985,000 1,036,410 1,086,500 1,196,504 Depreciation (1,252,374) (1,247,539) (1,400,000) (1,400,000) Amortization (1,416) (1,500) (1,500) Other Adjustments 201,024 (758) -Net Income (263,532) $ (236,462) $ (330,746) $ (232,775) $
Difference
LANDFILL FUND Landfill Fund
Budget by Category
PAGE 118 / BUDGET & ACTUALS BY DEPARTMENT
2021 2022 2023 2024 Actual ActualOriginal BudgetBudget $ % Reveneus Charges for Goods and Services 12,063,697 $ 13,851,937 $ 11,097,678 $ 12,355,438 $ 1,257,760 $ 11.3% Intergovernmental 40,408 260,000 - - -Licenses & Permits 39,525 31,225 30,250 30,250 - 0.0% Investment Income (35,590) (391,929) 80,000 80,000 - 0.0% Misc. (Assessments, Rentals, Other) 450,596 118,511 138,086 157,000 18,914 13.7% Total Revenues 12,558,636 $ 13,869,744 $ 11,346,014 $ 12,622,688 $ 1,276,674 $ 11.3% Expenditures Fulltime $ 1,381,496 $ 1,463,327 $ 1,643,664 $ 1,721,203 $ 77,539 4.7% Part-time 157,114 191,465 260,000 260,000 - 0.0% Overtime 100,955 138,606 99,917 102,915 2,998 3.0% OASI 116,273 129,292 111,343 120,345 9,002 8.1% Benefits 622,141 637,969 698,918 673,867 (25,051) -3.6% Total Personnel 2,377,979 2,560,659 2,813,842 2,878,330 64,488 2.3% Professional Services 1,826,771 2,076,633 2,095,991 2,374,191 278,200 13.3% Rentals 1,763,410 1,941,901 2,029,764 2,504,871 475,107 23.4% Repair & Maintenance 1,043,336 986,603 1,187,310 1,218,407 31,097 2.6% Supplies & Materials 709,213 997,561 904,532 977,432 72,900 8.1% Training & Education 21,260 22,322 26,228 26,228 - 0.0% Utilities 326,371 355,130 355,653 371,840 16,187 4.6% Other Current - - 450,000 450,000 - 0.0% Uncollectible Receivables 7,273 (6,055) - - -Total Other Operating 5,697,634 6,374,095 7,049,478 7,922,969 873,491 12.4% Total Operating Expenditures 8,075,613 8,934,754 9,863,320 10,801,299 937,979 9.5% Land - 45,076 200,000 200,000 - 0.0% Buildings 843,311 798,394 4,100,000 1,400,000 (2,700,000) -65.9% Improvements Other Than Buildings 1,384,134 5,728,424 1,590,000 1,685,000 95,000 6.0% Infrastructure - - 825,000 2,720,000 1,895,000 229.7% Equipment 180,582 962,330 418,000 350,000 (68,000) -16.3% Total Capital Expenditures 2,408,027 7,534,224 7,133,000 6,355,000 (778,000) -10.9% Debt and Lease Payments - 4,764 - 10,973 10,973Total Expenditures 10,483,640 $ 16,473,742 $ 16,996,320 $ 17,167,272 $ 170,952 $ 1.0% Revenues Net Expenditures 2,074,996 $ (2,603,998) $ (5,650,307) $ (4,544,584) $ 1,105,723 $ Adjustment for Net Income Capital 2,408,027 7,534,224 7,133,000 6,355,000 Debt and Lease Principal Payments - 4,677 11,000 11,000 Depreciation (2,768,612) (2,918,685) (2,800,000) (2,800,000) Amortization - (4,696) (11,000) (11,000) Other Adjustments 198,740 (538,798) -Net Income 1,913,151 $ 1,472,724 $ (1,317,307) $ (989,584) $ Difference
WATER FUND Water Fund
Budget by Category
BUDGET & ACTUALS BY DEPARTMENT / PAGE 119
2021 2022 2023 2024 Actual ActualOriginal BudgetBudget $ % Reveneus Charges for Services $ 40,731,370 $ 41,081,863 $ 39,091,189 $ 43,758,897 $ 4,667,708 11.9% Misc. (Assessments, Platting Fees, Other) 2,576,544 1,864,216 1,309,000 1,309,000 - 0.0% Bond/SRF Proceeds - - 7,500,000 - (7,500,000) -100.0% Total Revenues 43,307,914 $ 42,946,079 $ 47,900,189 $ 45,067,897 $ (2,832,292) $ -5.9% Expenditures Fulltime $ 4,287,713 $ 4,373,603 $ 5,141,665 $ 5,657,772 $ 516,107 10.0% Part-time 137,218 170,750 205,544 205,544 - 0.0% Overtime 246,161 302,195 158,687 158,687 - 0.0% OASI 292,027 346,255 349,976 389,218 39,242 11.2% Benefits 1,521,352 1,437,903 1,712,703 1,753,818 41,115 2.4% Total Personnel 6,484,471 6,630,706 7,568,575 8,165,039 596,464 7.9% Professional Services 1,587,380 1,216,369 1,552,721 1,624,291 71,570 4.6% Rentals 476,979 535,560 588,185 719,086 130,901 22.3% Repair & Maintenance 1,756,394 1,549,993 2,558,208 2,069,841 (488,367) -19.1% Supplies & Materials 7,143,132 8,647,458 8,066,141 8,239,938 173,797 2.2% Training & Education 40,036 38,633 84,864 84,864 - 0.0% Utilities 1,057,602 1,119,922 1,040,465 1,696,856 656,391 63.1% Other Current 137 542 - - -Uncollectible Receivables 93,647 32,500 - - -Total Other Operating 12,155,307 13,140,977 13,890,584 14,434,876 544,292 3.9% Total Operating Expenditures 18,639,778 19,771,683 21,459,158 22,599,915 1,140,756 5.3% Land 78,975 17,885 320,000 50,000 (270,000) -84.4% Buildings 2,234,969 1,724,241 1,290,000 269,000 (1,021,000) -79.1% Equipment 1,551,101 1,756,364 2,182,500 2,914,750 732,250 33.6% Infrastructure 13,799,255 28,070,322 21,920,000 14,294,233 (7,625,767) -34.8% Intangibles (Water Rights) 19,798 - - - -Total Capital Expenditures 17,684,098 31,568,812 25,712,500 17,527,983 (8,184,517) -31.8% Debt and Lease Payments 4,496,449 3,394,743 4,027,500 4,730,900 703,400 17.5% Total Expenditures 40,820,325 $ 54,735,238 $ 51,199,158 $ 44,858,798 $ (6,340,361) $ -12.4% Revenues Net Expenditures 2,487,589 $ (11,789,159) $ (3,298,969) $ 209,099 $ 3,508,069 $ Adjustment for Net Income Capital 17,684,098 31,568,813 25,712,500 17,527,983 Debt and Lease Principal Payments 3,679,799 2,805,830 3,108,400 3,803,400 Depreciation (8,763,257) (9,314,485) (9,500,000) (9,500,000) Amortization - (5,854) (8,400) (8,400) Other Adjustments 8,785,622 8,706,133 -Net Income 23,873,851 $ 21,971,278 $ 16,013,531 $ 12,032,082 $
Difference
WATER RECLAMATION FUND Water Reclamation Fund
Budget by Category
PAGE 120 / BUDGET & ACTUALS BY DEPARTMENT
2021 2022 2023 2024 Actual ActualOriginal BudgetBudget $ Reveneus Charges for Services $ 36,374,385 $ 38,501,561 $ 38,894,629 $ 43,151,222 $ 4,256,593 Intergovernmental - 19,078,065 - -Investment/Interest Earnings (18,602) (691,018) 255,194 255,194Misc. (Assessments, Rentals, Other)4,336,528 2,951,352 2,097,350 2,097,350Bond/SRF Proceeds 19,058,479 10,955,720 24,499,000 94,344,000 69,845,000 Total Revenues 59,750,790 $ 70,795,680 $ 65,746,173 $ 139,847,766 $ 74,101,593 $ Expenditures Fulltime $ 3,764,393 $ 4,217,793 $ 4,526,750 $ 5,021,190 $ 494,440 Part-time 113,234 99,288 123,100 133,100 10,000 Overtime 225,281 196,894 215,178 260,000 44,822 OASI 290,188 324,709 319,300 356,080 36,780 Benefits 1,324,200 1,341,482 1,502,926 1,597,887 94,961 Total Personnel 5,717,296 6,180,166 6,687,253 7,368,256 681,003 Professional Services 739,682 918,178 966,063 988,086 22,023 Rentals 927,191 1,023,952 1,006,133 1,167,199 161,066 Repair & Maintenance 1,170,057 1,325,493 1,755,201 1,589,892 (165,309) Supplies & Materials 1,422,234 1,856,498 1,850,953 2,262,714 411,761 Training & Education 46,771 51,900 59,670 60,863 1,193 Utilities 1,776,329 1,669,405 2,377,902 2,568,308 190,405 Other Current 532,831 117,044 1,500,000 1,500,000Uncollectible Receivables 4,317 2,705 - -Total Other Operating 6,619,412 6,965,175 9,515,922 10,137,061 621,139 Total Operating Expenditures 12,336,708 13,145,341 16,203,175 17,505,317 1,302,142 Land 612,538 301,002 100,000 103,000 3,000 Buildings 9,378,765 1,938,041 - 7,751,000 7,751,000 Equipment 1,208,601 553,387 1,916,500 1,370,000 (546,500) Infrastructure 21,157,704 54,357,910 31,900,000 101,051,100 69,151,100 Total Capital Expenditures 32,357,608 57,150,340 33,916,500 110,275,100 76,358,600 Debt and Lease Payments 12,863,576 14,231,446 15,780,785 15,796,985 16,200 Transfers 364,283 938,578 - -Total Expenditures 57,922,175 $ 85,465,705 $ $ 65,900,460 $ 143,577,402 77,676,942 $ Revenues Net Expenditures 1,828,615 $ (14,670,025) $ (154,287) $ (3,729,636) $ (3,575,349) $ Adjustment for Net Income SRF/Bond Proceeds (19,058,479) (10,955,720) (24,499,000) (94,344,000) Capital 32,357,608 57,150,340 33,916,500 110,275,100 Debt and Lease Principal Payments 11,596,952 12,728,540 13,387,443 13,387,443 Depreciation (14,620,270) (15,320,623) (16,500,000) (16,500,000) Amortization - (5,579) (16,200) (16,200) Other Adjustments 5,181,188 4,138,038 -Net Income 17,285,614 $ 33,064,971 $ 6,134,456 $ 9,072,707 $ Difference
FLEET MANAGEMENT FUND
Fleet Management Fund
Budget by Category
BUDGET & ACTUALS BY DEPARTMENT / PAGE 121
INTERNAL SERVICE FUNDS
2021 2022 2023 2024 Actual ActualOriginal BudgetBudget $ % Revenues Charges for Services 12,482,180 $ 15,384,448 $ 15,180,346 $ 17,281,490 $ 2,101,144 $ 13.8% Other 447,524 564,035 544,500 544,500 - 0.0% Transfers-in - - 250,000 250,000 - 0.0% Total Revenues 12,929,704 $ 15,948,483 $ 15,974,846 $ 18,075,990 $ 2,101,144 $ 13.2% Expenditures Fulltime $ 1,655,933 $ 1,743,524 $ 1,875,356 $ 2,045,145 $ 169,789 9.1% Standby 17,979 20,919 20,000 20,000 - 0.0% Eligible Leave Payout 1,627 55,974 32,904 32,904 - 0.0% Deferred Compensation 10,994 11,441 11,915 13,031 1,116 9.4% Overtime 56,702 100,754 160,000 160,000 - 0.0% Part-time 179,947 200,682 286,566 286,566 - 0.0% OASI 135,132 146,899 138,584 151,905 13,321 9.6% Benefits 628,587 635,644 693,218 693,845 627 0.1% Pension 252,109 262,962 286,411 286,917 506 0.2% Insurance 360,123 358,673 391,038 391,159 121 0.0% Workers' Compensation and Unemploym 14,455 12,109 12,109 12,109 - 0.0% Allowances 1,900 1,900 3,660 3,660 - 0.0% Total Personnel 2,656,301 2,827,503 3,153,724 3,337,461 183,737 5.8% Professional Services 157,204 140,255 141,785 154,414 12,629 8.9% Rentals 124,231 90,735 120,875 163,751 42,876 35.5% Repair & Maintenance 1,328,445 1,767,521 1,458,457 1,512,852 54,395 3.7% Supplies & Materials 3,689,432 5,547,607 5,585,060 5,549,117 (35,943) -0.6% Training & Education 11,735 10,958 16,407 16,407 - 0.0% Utilities 41,932 41,023 42,466 42,466 - 0.0% Uncollectibles 320 48,739 - - -Total Other Operating 5,353,299 7,646,838 7,365,050 7,439,007 73,957 1.0% Total Operating Expenditures 8,009,600 10,474,341 10,518,774 10,776,468 257,694 2.4% Improvements Other Than Buildings - 50,010 334,000 458,000 124,000 37.1% Equipment 2,937,865 4,144,504 7,413,400 3,972,500 (3,440,900) -46.4% Total Capital 2,937,865 4,194,514 7,747,400 4,430,500 (3,316,900) -42.8% Debt and Lease Payments - 2,083 - 2,812 2,812Total Expenditures 10,947,465 $ 14,670,938 $ 18,266,174 $ 15,209,780 $ (3,056,394) $ -16.7% Revenues Net Expenditures 1,982,239 $ 1,277,545 $ (2,291,328) $ 2,866,210 $ 5,157,538 $ Adjustments for Net Income Capital 2,937,865 4,194,514 7,747,400 4,430,500 Debt and Lease Principal Payments - 2,045 2,000 2,000 Depreciation (3,965,471) (3,841,009) (3,800,000) (3,800,000) Amortization - (2,053) (2,000) (2,000) Other Adjustments 617,156 20,734 -Net Income 1,571,789 $ 1,651,776 $ 1,656,072 $ 3,496,710 $ Difference
HEALTH BENEFITS FUND Health Benefits Fund
Budget by Category
PAGE 122 / BUDGET & ACTUALS BY DEPARTMENT
2021 2022 2023 2024 Actual ActualOriginal BudgetBudget $ % Revenues Charges for Goods & Services 22,984,489 $ 24,010,649 $ 27,668,440 $ 28,889,234 $ 1,220,794 $ 4.4% Interest Earned (24,543) (221,851) 100,000 100,000 - 0.0% Total Revenues 22,959,946 $ 23,788,798 $ 27,768,440 $ 28,989,234 $ 1,220,794 $ 4.4% Expenditures Fulltime $ 120,115 $ 126,848 $ 129,718 $ 175,077 $ 45,359 35.0% Overtime 158 277 -OASI 8,576 9,084 9,297 12,581 3,284 35.3% Benefits 37,530 38,680 39,868 52,711 12,843 32.2% Total Personnel 166,379 174,889 178,883 240,369 61,486 34.4% Professional Services 1,803,550 1,855,869 2,107,891 2,158,732 50,841 2.4% Training & Education - - 2,275 1,625 (650) -28.6% Miscellaneous 9,087 9,670 10,220 11,616 1,396 13.7% Total Other Operating 1,812,637 1,865,539 2,120,386 2,171,973 51,587 2.4% Total Operating Expenditures 1,979,016 2,040,428 2,299,269 2,412,342 113,073 4.9% Benefit Payments 18,505,036 19,160,452 22,651,138 22,651,138 - 0.0% Total Expenditures 20,484,052 $ 21,200,880 $ 24,950,407 $ 25,063,480 $ 113,073 $ 0.5% Revenues Net Expenditures 2,475,894 $ 2,587,918 $ 2,818,033 $ 3,925,754 $ 1,107,721 $ Adjustments for Net Income Other Adjustments 51,632 3,010 -Net Income 2,527,526 $ 2,590,928 $ 2,818,033 $ 3,925,754 $ Difference
WORKER’S COMPENSATION FUND Workers' Compensation Fund
Budget by Category
BUDGET & ACTUALS BY DEPARTMENT / PAGE 123
2021 2022 2023 2024 Actual ActualOriginal BudgetBudget $ % Revenues Charges for Goods & Services 1,848,520 $ 1,563,365 $ 1,567,884 $ 1,567,884 $ - $ 0.0% Interest Earned (1,384) (92,032) 5,000 5,000 - 0.0% Other - 66,216 - - -Total Revenues 1,847,136 $ 1,537,549 $ 1,572,884 $ 1,572,884 $ - $ 0.0% Expenditures Fulltime $ 212,522 $ 122,661 $ 134,737 $ 121,966 $ (12,771) -9.5% Part-time - - 3,500 3,500 - 0.0% OASI 15,295 9,023 10,225 9,052 (1,173) -11.5% Benefits 62,340 32,778 38,580 33,149 (5,431) -14.1% Total Personnel 290,157 164,462 187,042 167,667 (19,375) -10.4% Professional Services 347,630 353,780 433,568 492,118 58,550 13.5% Rentals 195 388 300 300 - 0.0% Supplies & Materials 66,084 95,474 91,650 91,650 - 0.0% Training & Education 1,052 3,737 6,900 6,900 - 0.0% Uncollectibles - 66,216 - - -Total Other Operating 414,961 519,595 532,418 590,968 58,550 11.0% Total Operating Expenditures 705,118 684,057 719,460 758,635 39,175 5.4% Benefit Payments 936,058 1,027,048 900,000 900,000 - 0.0% Total Expenditures 1,641,176 $ 1,711,105 $ 1,619,460 $ 1,658,635 $ 39,175 $ 2.4% Revenues Net Expenditures 205,960 $ (173,556) $ (46,576) $ (85,751) $ (39,175) $ Adjustments for Net Income Other Adjustments (685,906) 567,831 -Net Income (479,946) $ 394,275 $ (46,576) $ (85,751) $ Difference
RISK MANAGEMENT FUND Risk Management Fund
Budget by Category
PAGE 124 / BUDGET & ACTUALS BY DEPARTMENT
2021 2022 2023 2024 Actual ActualOriginal BudgetBudget $ % Revenues Charges for Goods & Services 2,133,106 $ 2,298,883 $ 1,980,000 $ 2,160,000 $ 180,000 $ 9.1% Intergovernmental - 23,406 - - -Interest Earned (6,741) (42,112) 10,000 10,000 - 0.0% Total Revenues 2,126,365 $ 2,280,177 $ 1,990,000 $ 2,170,000 $ 180,000 $ 9.0% Expenditures Fulltime $ 124,886 $ 120,749 $ 136,002 $ 164,792 $ 28,790 21.2% Part-time - - - 23,837 23,837OASI 8,984 8,156 9,554 14,118 4,564 47.8% Benefits 28,898 34,317 40,947 25,320 (15,627) -38.2% Pension 8,687 6,644 7,847 9,677 1,830 23.3% Insurance 16,407 26,505 32,378 14,921 (17,457) -53.9% Workers' Compensation and Unemploym 3,426 506 -Allowances 378 662 722 722 - 0.0% Total Personnel 162,768 163,222 186,503 228,067 41,564 22.3% Professional Services 1,753,025 1,830,688 1,870,080 2,244,480 374,400 20.0% Rentals - - 600 600 - 0.0% Repair & Maintenance - 50,227 - - -Supplies & Materials 18,638 20,765 11,000 23,500 12,500 113.6% Training & Education 1,828 984 7,825 7,825 - 0.0% Utilities 1,444 1,202 - - -Total Other Operating 1,774,935 1,903,866 1,889,505 2,276,405 386,900 20.5% Liability Claims 612,297 173,202 225,000 220,000 (5,000) -2.2% Total Operating Expenditures 2,550,000 $ 2,240,290 $ 2,301,008 $ 2,724,472 $ 423,464 $ 18.4% Revenues Net Expenditures (423,635) $ 39,887 $ (311,008) $ (554,472) $ (243,464) $ Adjustments for Net Income Other Adjustments (2,067,625) (5,707) -Net Income (2,491,260) $ 34,180 $ (311,008) $ (554,472) $ Difference
ENTERPRISE NETWORK TECHNOLOGY FUND
Enterprise Network Technology Fund
Budget by Category
BUDGET & ACTUALS BY DEPARTMENT / PAGE 125
2021 2022 2023 2024 Actual ActualOriginal BudgetBudget $ % Revenues Charges for Goods & Services 4,396,229 $ 4,819,952 $ 5,003,746 $ 6,684,869 $ 1,681,123 $ 33.6% Other (Interest and County Contribution) (7,931) (83,196) 176,000 178,000 2,000 1.1% Transfer from General Fund - 500,000 - - -Total Revenues 4,388,298 $ 5,236,756 $ 5,179,746 $ 6,862,869 $ 1,683,123 $ 32.5% Expenditures Professional Services 839,768 $ 520,151 $ 1,465,000 $ 1,591,251 $ 126,251 $ 8.6% Rentals 41,993 30,670 50,000 43,000 (7,000) -14.0% Repair & Maintenance 8,171 3,220 - - -Supplies & Materials 4,016,061 4,645,565 3,946,750 2,491,206 (1,455,544) -36.9% Training 6,967 16,216 - - -Utilities 112,242 162,151 15,000 15,000 - 0.0% Total Other Operating 5,025,202 5,377,973 5,476,750 4,140,457 (1,336,293) -24.4% Capital Equipment 651,861 1,850,020 1,400,000 1,400,000 - 0.0% Debt and Lease Payments - 14,985 - 1,276,423 1,276,423Total Expenditures 5,677,063 $ 7,242,978 $ 6,876,750 $ 6,816,880 $ (59,870) $ -0.9% Revenues Net Expenditures (1,288,765) $ (2,006,222) $ (1,697,004) $ 45,989 $ 1,742,993 $ Adjustments for Net Income Capital 651,861 1,850,020 1,400,000 1,400,000 Debt and Lease Principal Payments - 14,709 1,250,000 1,276,423 Depreciation (417,614) (654,089) (600,000) (600,000) Amortization - (14,770) (1,250,000) (1,276,423) Other Adjustments (10,998) - -Net Income (1,065,516) $ (810,352) $ (897,004) $ 845,989 $ Difference
CENTRALIZED FACILITIES FUND
Centralized Facilities Fund
Budget by Category
PAGE 126 / BUDGET & ACTUALS BY DEPARTMENT
2021 2022 2023 2024 Actual ActualOriginal BudgetBudget $ % Revenues Charges for Goods & Services 5,818,000 $ 6,745,183 $ 5,790,100 $ 6,588,600 $ 798,500 $ 13.8% Other (County Contribution & Interest) 77,736 116,955 105,000 77,000 (28,000) -26.7% Transfers-In 3,560,000 2,101,949 2,600,000 2,438,703 (161,297) -6.2% Total Revenues 9,455,736 $ 8,964,087 $ 8,495,100 $ 9,104,303 $ 609,203 $ 7.2% Expenditures Fulltime $ 1,056,347 $ 1,256,418 $ 1,400,584 $ 1,721,909 $ 321,325 22.9% Overtime 32,665 39,506 41,910 41,910 - 0.0% Part-time 42,471 85,371 36,624 36,624 - 0.0% OASI 81,003 99,931 105,382 127,344 21,962 20.8% Benefits 398,888 424,188 491,631 633,070 141,439 28.8% Total Personnel 1,611,374 1,905,414 2,076,131 2,560,857 484,726 23.3% Professional Services 116,012 51,235 103,250 103,250 - 0.0% Rentals 252,006 221,295 290,196 253,515 (36,681) -12.6% Repair & Maintenance 1,332,787 2,043,425 3,181,959 3,207,931 25,972 0.8% Supplies & Materials 288,878 235,484 244,432 253,407 8,975 3.7% Training 1,406 3,070 4,480 4,480 - 0.0% Utilities 1,116,959 1,189,696 1,234,135 1,403,338 169,203 13.7% Other Current 1,707 - 1,500 1,500 - 0.0% Total Other Operating 3,109,755 3,744,205 5,059,953 5,227,422 167,469 3.3% Capital Buildings and Equipment 121,735 1,398,112 4,902,000 1,663,000 (3,239,000) -66.1% Debt and Lease Payments - 67,134 - 79,661 79,661Total Expenditures 4,842,864 $ 7,114,865 $ 12,038,084 $ 9,530,940 $ (2,507,144) $ -20.8% Revenues Net Expenditures 4,612,872 $ 1,849,222 $ (3,542,984) $ (426,637) $ 3,116,347 $ Adjustments for Net Income Capital - - 4,902,000 1,663,000 Debt and Lease Principal Payments 57,834 70,000 70,000 Amortization (428,723) (440,000) (440,000) Other Adjustments 404,013 97,568 -Net Income 5,016,885 $ 1,575,901 $ 989,016 $ 866,363 $
Difference
TOTAL PENSION AND HEALTHCARE TRUST FUNDS
Total Pension & Healthcare Trust Funds
Breakdown by Fund
BUDGET & ACTUALS BY DEPARTMENT / PAGE 127
Employee Retirement System by Category 2021 2022 2023 2024 Actual ActualOriginal BudgetBudget $ % Revenues Investment Income 81,234,637 $ (86,786,433) $ 42,650,000 $ 38,550,000 $ (4,100,000) $ -9.6% Contributions 13,436,489 12,969,138 11,844,723 12,631,490 786,767 6.6% Total Revenues 94,671,126 $ (73,817,295) $ 54,494,723 $ 51,181,490 $ (3,313,233) $ -6.1% Expenditures Fulltime 109,700 $ 115,759 $ 117,781 $ 141,882 $ 24,101 $ 20.5% Overtime 256 245 - - -OASI 7,884 8,367 8,541 10,360 1,819 21.3% Benefits 34,615 34,817 35,614 41,258 0.0% Total Personnel 152,455 159,188 161,936 193,500 31,564 19.5% 0.0% Professional Services 1,093,051 1,086,159 1,536,781 1,876,135 339,354 22.1% Supplies & Materials - 625 200 200 - 0.0% Training & Education 138 - 550 550 - 0.0% Total Other Operating 1,093,189 1,086,784 1,537,531 1,876,885 339,354 22.1% Total Operating Expenditures 1,245,644 1,245,972 1,699,467 2,070,385 370,918 21.8% Benefit Payments 27,249,600 29,192,832 34,679,003 36,808,730 2,129,727 6.1% Total Expenditures 28,495,244 $ 30,438,804 $ 36,378,470 $ 38,879,115 $ 2,500,645 $ 6.9% Firefighters' Pension by Category 2021 2022 2023 2024 Actual ActualOriginal BudgetBudget $ % Operating Revenues Investment Income 29,318,658 $ (31,399,403) $ 15,300,000 $ 13,900,000 $ (1,400,000) $ -9.2% Contributions 5,398,508 5,181,435 4,612,391 5,121,926 509,535 11.0% Other - - - -Total Operating Revenues34,717,166 $ (26,217,968) $ 19,912,391 $ 19,021,926 $ (890,465) $ -4.5% Expenditures Fulltime 70,346 $ 73,961 $ 75,399 $ 88,732 $ 13,333 $ 17.7% Overtime 172 150 - - -OASI 5,064 5,347 5,469 6,500 1,031 18.9% Benefits 22,069 22,343 22,872 25,569 2,697 11.8% Total Personnel 97,651 101,801 103,740 120,801 17,061 16.4% Professional Services 456,380 449,118 609,095 715,872 106,777 17.5% Supplies & Materials 55 - 250 250 - 0.0% Training & Education 138 - 1,725 1,725 - 0.0% Total Other Operating 456,573 449,118 611,070 717,847 106,777 17.5% Total Operating Expenditues 554,224 550,919 714,810 838,648 123,838 17.3% Benefit Payments 9,141,233 10,042,187 11,418,867 12,044,102 625,235 5.5% Total Expenditures 9,695,457 $ 10,593,106 $ 12,133,677 $ 12,882,750 $ 749,073 $ 6.2% 2021 2022 2023 2024 Actual ActualOriginal BudgetBudget $ % Total Combined Revenues Investment Income 110,545,664 $ (118,243,113) $ 57,950,000 $ 52,450,000 $ (5,500,000) $ -9.5% Contributions 18,834,997 18,150,573 16,457,114 17,753,416 1,296,302 7.9% Total Revenues 129,380,661 $ (100,092,540) $ 74,407,114 $ 70,203,416 $ (4,203,698) $ -5.6% Total Expenditures by Fund Employee's Retirement 28,495,244 $ 30,438,804 $ 36,378,470 $ 38,879,115 $ 2,500,645 $ 6.9% Firefighters' Pension 9,695,457 10,593,106 12,133,677 12,882,750 749,073 6.2% 115 Healthcare Trust 314,545 240,357 204,000 204,000 - 0.0% Total Operating Expenditures38,505,246 $ 41,272,267 $ 48,716,147 $ 51,965,865 $ 3,249,718 $ 6.7% Difference Difference
Difference
Intentionally Left Blank
PAGE 128 / BUDGET & ACTUALS BY DEPARTMENT
2024 – 2028 CAPITAL PROGRAM
The 2024–2028 (5 years) capital program maintains our existing infrastructure while making strategic investments in the future. The top priority is the replacement, rehabilitation and expansion of the street and utility infrastructure. Quality of life investments are also planned for our park system and entertainment venues. The program prioritizes the City’s plan to invest $1.1 billion over the next five years in the City’s infrastructure, facilities, equipment, and other capital improvements. The program is a blueprint for general planning purposes. Presented with a financing strategy, the program details the sources and uses for
each project. It is important to understand that only the first year of the program is incorporated into the 2024 budget.
The program consists of two portions; the capital improvements program (CIP) and the other capital expenditures program (OCEP). The CIP consists primarily of land acquisition, infrastructure improvements such as streets and utilities, acquisition or construction of buildings, and other improvements to facilities or property such as parks. The OCEP is comprised of vehicles and capital equipment.
2024–2028 CAPITAL PROGRAM / PAGE 129 2024–2028 CAPITAL PROGRAM
for more information
SOUTH
D AKOTA Visit siouxfalls.org/finance
September 17, 2019
Subject: Fiscal Year 2020 Budget
Dear Residents:
Today, I submit to you the final 2020 budget The 2020 budget reflects our citywide vision of “taking care of today for a better tomorrow.” Being good stewards of taxpayer dollars is one of our most important duties as elected officials The budget recognizes that, as the City expands, so too does the need for improving and growing our public infrastructure, providing essential services that residents and visitors can rely on, and enhancing our quality of life to keep Sioux Falls at the top of everyone’s list for best places to live
This budget reflects stable revenue growth and the City’s ability to make the most of existing revenue sources, not taking any more than allowed by inflation or what is necessary to maintain essential services. It is critical we leverage data to make informed decisions and implement innovative ideas to maximize our use of resources to accommodate this growth, take care of our existing infrastructure, and plan ahead for an even brighter future for Sioux Falls.
In keeping with the One Sioux Falls Framework, new expenditures for programs and projects are specifically tied to this framework or a departmental BHAG (big hairy audacious goal) to make Sioux Falls even better.
Safety and Health: The 2020 budget funds our top priority of public safety by adding five new positions within the police department and funding our share of several new employees for Metro Communications. A Community Resource Officer focused on mental health is also part of this budget. Accompanying this investment in mental health is funding for our partnership to launch the Community Triage Center in 2020. These combined efforts are part of a strategy to help narcotics users overcome their addiction while going after the drug suppliers and dealers. We’ve also included a pilot project for a Police report-to-work location to stretch existing resources by saving both commute times and space constraints at the downtown location.
PAGE 130 / 2024–2028 CAPITAL PROGRAM
S U STAINABLEGROWTH
KIDS&FAMILIES ENGAGING PEOPLE INNOVATION
it also means we as a city have big commitments in the next several years that affect our Capital Program. We need to continue to be good partners and invest in the necessary arterial streets to move these projects forward, which includes (but is not limited to):
• Benson Road and I-229 Interchange
• South Veterans Parkway
• 85th Street and I-29 Interchange
• Cliff Avenue and I-229 Interchange
• Minnesota Avenue and I-229 Interchange
Part of what makes a community special is its quality-of-life investments. We look forward to seeing some of those we have already committed to come to life in the coming years, like Jacobson Plaza and the third phase of the downtown River Greenway. One of the most-anticipated investments in this Capital Program is the aquatic facilities improvements which will bring new pools and expanded recreational amenities to Frank Olson, Kuehn, and McKennan Park. Along with the bright future of aquatics, other investments include expansion of the bike trails and investments in neighborhood and regional parks.
As you consider the program for 2024-2028, I hope you feel proud to live in a city that can make these types of large-scale investments while staying fiscally responsible. We know the private sector invests based on what we are planning, so it’s important we continue to keep Sioux Falls on the right path. It truly takes a One Sioux Falls effort to balance the program while planning and prioritizing what Sioux Falls will need in the coming years. I look forward to working together for this community that can trust we have done our due diligence to continue the positive momentum of this amazing city we call home.
Best regards,
 Mayor Paul TenHaken


2024–2028 CAPITAL PROGRAM / PAGE 131
CAPITAL PROGRAM INVESTMENT (USES)
The information below summarizes the 2024–2028 capital program by department.
$457,515,582 HIGHWAYS & STREETS
$407.1 million Highways & Streets
$50.4 million, Storm Drainage
$449,352,949 UTILITIES (ENTERPRISE FUNDS) $294.7 million, Water Reclamation $116.9 million, Water $19.7 million, Sanitary Landfill $18.1 million, Power & Distribution
$88,814,000 CULTURE & RECREATION $58.3 million, Parks and Recreation
$15.2 million, Event Complex $4.6 million, Library $8.7 million, Washington Pavilion $2.0 million, Orpheum $0.04 million, SF Stadium
$55,207,500 INTERNAL SERVICE FUNDS
$36.0 million, Fleet Revolving $7.0 million, Enterprise Network Technology $12.2 million, Centralized Facilities
$38,064,300 PUBLIC SAFETY $24.6 million, Fire $13.4 million, Police
$6,035,500 OTHER $0.8 million, Communications $3.2 million, General Facilities $0.6 million, Public Parking $0.6 million, Health $0.8 million, Planning & Development Services
$5,303,500 TRANSIT
$1,100,293,331 TOTAL 2024–2028 CAPITAL PROGRAM
PAGE 132 / 2024–2028 CAPITAL PROGRAM
Transit 1% Other 1% Highways & Streets 41% Culture & Recreation 8% Utilities 41% Internal Service 5% 1 2 3 4 5 6 7 Public Safety 3%
$1,100,293,331
FUNDING STRATEGY (SOURCES)
The following is a brief explanation of the various sources that fund the City’s capital program.
$438,004,382 SALES/USE TAX 2ND PENNY
• Funding generated from the City’s second penny sales and use tax, assessments or cost recoveries directly related to projects funded with sales tax, and interest earned on monies held in trust. Revenue assumptions as follows:
• 2023–2028 = 5.0 percent growth
$198,653,349 USER FEES
Charges for services within the enterprise (utility) funds.
$245,247,000 STATE LOANS
The use of $245.2 million in low interest state revolving fund (SRF) notes issued by the South Dakota Conservancy District as follows:
• $241.7 million—Water Reclamation
• $3.5 million—Storm Drainage
$55,207,500 INTERNAL SERVICE FEES
Charges for services within the internal service funds.
• $36.0 million—Fleet Revolving
• $7.0 million—Enterprise Network Technology
• $12.2 million—Centralized Facilities
$46,910,000 STORM DRAINAGE FEES
$1,100,293,331
Fees collected for capital construction and improvements to the storm drainage system.
$25,894,000 ENTERTAINMENT TAX
Funding generated from the City’s third penny entertainment tax levied by the City, which currently funds the Event Center, Arena, Convention Center, SF Stadium, Washington Pavilion and Orpheum Theater.
$90,377,100 OTHER SOURCES
$22.2 million, Platting Fees
Fees charged to developers in support of the arterial street and utility expansion program. Fees for both water and streets were based on an average number of acres platted over the last 9 years multiplied by the per acre cost by land use determined by the Nexus Study performed in 2016.
$5.3 million, Transit Funds
Monies from federal and local sources.
$50,077,000 STATE/FEDERAL GRANTS & CONTRIBUTIONS
• $49.1 million for Highways & Streets Improvements
• $0.8 million for Tomar Park Land purchases
• $0.1 million for Fire Equipment
• $0.1 million for Police Equipment
$12,836,600 DONATIONS FROM OUTSIDE SOURCES
• $6.2 million Various donors for Park Improvements
• $4.3 million Contributions from the City of Brandon for Water Reclamation Improvements
• $2.0 million Developer Contributions for Highways & Streets Improvements
• $0.3 million Minnehaha County for library materials
$1,100,293,331 TOTAL 2024–2028 CAPITAL PROGRAM
2024–2028 CAPITAL PROGRAM / PAGE 133 1 2 3 4 5 6 7 8
Other Sources 3% State/Federal Grants & Contributions 5% Storm Drainage Fees 4% Entertainment Tax 2% Internal Service Fees 5%
Sales Tax 40% Donations from Outside Sources 1% User Fees 18% State Loans 22%

PAGE 134 / 2024–2028 CAPITAL PROGRAM PAGE 4 l CIP 2024–2028 SALES/USE TAX FUND 253
$407.1M 2024 2025 2026 2027 2028 $ 109.5M $ 69.1M $ 70.5M $ 75.5M $ 82.5M SALES/USE TAX FUND 253 HIGHWAYS AND STREETS Capital Program 2024 2025 2026 2027 2028 Sources 2nd Penny Sales Tax 59,267,845 64,769,656 66,036,569 71,076,512 77,970,000 State Contributions 44,000,000 - - -State Grants 1,025,000 1,025,000 1,025,000 1,025,000 1,025,000 Other Contributions 2,000,000 - - -Platting Fees 3,210,000 3,300,000 3,390,000 3,450,000 3,510,000 Total Capital Sources 109,502,845 $ 69,094,656 $ 70,451,569 $ 75,551,512 $ 82,505,000 $ Pg. Capital Improvement Projects 7 Asphalt Street Rehabilitation Program 7,493,250 7,792,980 8,182,629 8,673,587 9,199,000 8 Neighborhood Street Rehabilitation Program 2,956,100 3,074,344 3,228,061 3,421,745 3,616,000 9 Surface Treatment Program 2,060,000 2,142,400 2,249,520 2,384,491 2,528,000 10 Concrete Pavement Restoration 4,712,250 4,900,740 5,145,777 5,454,524 5,757,000 11 Arterial Intersection Improvements 1,115,000 1,730,000 2,730,000 3,360,000 5,000,000 12 Bridge and Retaining Wall Rehabilitation 1,575,000 1,600,000 1,600,000 1,725,000 1,775,000 13 Major Street Reconstruction 8,294,484 12,316,846 12,895,582 15,125,000 15,500,000 14 Arterial Street Improvements 15,016,761 13,888,346 14,890,000 17,742,165 24,510,000 15 Right of Way Acquisition and Restoration 3,700,000 2,000,000 2,000,000 2,000,000 2,500,000 17 Bridge Reconstruction Program 18,325,000 5,800,000 6,250,000 1,500,000 500,000 18 Downtown Area-Street & Utility Improvements 1,725,000 1,955,000 1,955,000 2,155,000 2,500,000 19 ADA Improvements 1,650,000 2,200,000 2,200,000 -20 School District/Park Site Coordination 1,215,000 215,000 215,000 225,000 225,000 21 Railroad Crossing Improvements 80,000 80,000 95,000 95,000 110,000 22 SDDOT Project Coordination 195,000 195,000 195,000 195,000 200,000 23 ADA Transition Plan 600,000 600,000 600,000 600,000 650,000 24 Traffic Signal Improvements 280,000 280,000 380,000 430,000 530,000 25 Communications Network Upgrade 250,000 250,000 400,000 450,000 500,000 26 North Veterans Parkway Improvements 2,100,000 100,000 100,000 100,000 125,000 27 49th Street Extension 100,000 500,000 1,200,000 2,200,000 3,000,000 28 Arrowhead Parkway Improvements 32,150,000 - - -29 85th St & I29 Improvements 100,000 - - -30 Cliff Avenue and I229 Area Improvements 100,000 100,000 - -31 Minnesota Ave & I229 Area Improvements - 100,000 - 100,00032 Pedestrian and Bicycle Improvements 325,000 325,000 325,000 350,000 400,000 33 Salt Storage Facility 1,000,000 - - -34 Street Lights in Newly Developed Areas 470,000 470,000 500,000 530,000 530,000 35 LED Street Light Upgrade Program 675,000 675,000 775,000 825,000 875,000 36 Pole Replacement Program 200,000 200,000 250,000 300,000 575,000 37 Equipment Storage - - 380,000 3,845,000Other Public Works Projects 90 Drainage Improvement in Existing Areas 710,000 760,000 810,000 835,000 850,000 101 Light and Power Campus Enhancements - 4,500,000 - -Total Capital Improvement Projects 109,172,845 $ 68,750,656 $ 69,551,569 $ 74,621,512 $ 81,955,000 $ Capital Equipment (R=Replace, N=New)
HIGHWAYS AND STREETS
HIGHWAYS AND STREETS (CONT.)
SALES/USE TAX FUND 253 HIGHWAYS
2024–2028 CAPITAL PROGRAM / PAGE 135 PAGE 5 l CIP 2024–2028
STREETS Capital Program 2024 2025 2026 2027 2028 Sources 2nd Penny Sales Tax 59,267,845 64,769,656 66,036,569 71,076,512 77,970,000 State Contributions 44,000,000 - - -State Grants 1,025,000 1,025,000 1,025,000 1,025,000 1,025,000 Other Contributions 2,000,000 - - -Platting Fees 3,210,000 3,300,000 3,390,000 3,450,000 3,510,000 Total Capital Sources 109,502,845 $ 69,094,656 $ 70,451,569 $ 75,551,512 $ 82,505,000 $ Pg. Capital Improvement Projects 7 Asphalt Street Rehabilitation Program 7,493,250 7,792,980 8,182,629 8,673,587 9,199,000 8 Neighborhood Street Rehabilitation Program 2,956,100 3,074,344 3,228,061 3,421,745 3,616,000 9 Surface Treatment Program 2,060,000 2,142,400 2,249,520 2,384,491 2,528,000 10 Concrete Pavement Restoration 4,712,250 4,900,740 5,145,777 5,454,524 5,757,000 11 Arterial Intersection Improvements 1,115,000 1,730,000 2,730,000 3,360,000 5,000,000 12 Bridge and Retaining Wall Rehabilitation 1,575,000 1,600,000 1,600,000 1,725,000 1,775,000 13 Major Street Reconstruction 8,294,484 12,316,846 12,895,582 15,125,000 15,500,000 14 Arterial Street Improvements 15,016,761 13,888,346 14,890,000 17,742,165 24,510,000 15 Right of Way Acquisition and Restoration 3,700,000 2,000,000 2,000,000 2,000,000 2,500,000 17 Bridge Reconstruction Program 18,325,000 5,800,000 6,250,000 1,500,000 500,000 18 Downtown Area-Street & Utility Improvements 1,725,000 1,955,000 1,955,000 2,155,000 2,500,000 19 ADA Improvements 1,650,000 2,200,000 2,200,000 -20 School District/Park Site Coordination 1,215,000 215,000 215,000 225,000 225,000 21 Railroad Crossing Improvements 80,000 80,000 95,000 95,000 110,000 22 SDDOT Project Coordination 195,000 195,000 195,000 195,000 200,000 23 ADA Transition Plan 600,000 600,000 600,000 600,000 650,000 24 Traffic Signal Improvements 280,000 280,000 380,000 430,000 530,000 25 Communications Network Upgrade 250,000 250,000 400,000 450,000 500,000 26 North Veterans Parkway Improvements 2,100,000 100,000 100,000 100,000 125,000 27 49th Street Extension 100,000 500,000 1,200,000 2,200,000 3,000,000 28 Arrowhead Parkway Improvements 32,150,000 - - -29 85th St & I29 Improvements 100,000 - - -30 Cliff Avenue and I229 Area Improvements 100,000 100,000 - -31 Minnesota Ave & I229 Area Improvements - 100,000 - 100,00032 Pedestrian and Bicycle Improvements 325,000 325,000 325,000 350,000 400,000 33 Salt Storage Facility 1,000,000 - - -34 Street Lights in Newly Developed Areas 470,000 470,000 500,000 530,000 530,000 35 LED Street Light Upgrade Program 675,000 675,000 775,000 825,000 875,000 36 Pole Replacement Program 200,000 200,000 250,000 300,000 575,000 37 Equipment Storage - - 380,000 3,845,000Other Public Works Projects 90 Drainage Improvement in Existing Areas 710,000 760,000 810,000 835,000 850,000 101 Light and Power Campus Enhancements - 4,500,000 - -Total Capital Improvement Projects 109,172,845 $ 68,750,656 $ 69,551,569 $ 74,621,512 $ 81,955,000 $ Capital Equipment (R=Replace, N=New) R Air Compressor - 25,000 - -N Arrow Message Boards (3) 20,000 - - 40,000N Asphalt Hauler 55,000 - - -N Asphalt Roller (2) 100,000 - - - 100,000 R GPS Equipment 30,000 10,000 - 16,000N Heavy Equipment Attachments 25,000 25,000 - -N Loader (3) - - 350,000 350,000 350,000 N Pickup - - 55,000 -R Retroreflectometer - - 15,000 -N Skidsteer (2) - 100,000 - 100,000N Skidsteer Attachments - - - -R Snow Feeder - - - 300,000N Snow Gates - 24,000 - 24,000N Sweeper - - 250,000 -N Traffic Control Equipment 100,000 100,000 100,000 100,000 100,000 N/R Trailer (4) - 60,000 130,000 -30 Cliff Avenue and I229 Area Improvements 100,000 100,000 - -31 Minnesota Ave & I229 Area Improvements - 100,000 - 100,00032 Pedestrian and Bicycle Improvements 325,000 325,000 325,000 350,000 400,000 33 Salt Storage Facility 1,000,000 - - -34 Street Lights in Newly Developed Areas 470,000 470,000 500,000 530,000 530,000 35 LED Street Light Upgrade Program 675,000 675,000 775,000 825,000 875,000 36 Pole Replacement Program 200,000 200,000 250,000 300,000 575,000 37 Equipment Storage - - 380,000 3,845,000Other Public Works Projects 90 Drainage Improvement in Existing Areas 710,000 760,000 810,000 835,000 850,000 101 Light and Power Campus Enhancements - 4,500,000 - -Total Capital Improvement Projects 109,172,845 $ 68,750,656 $ 69,551,569 $ 74,621,512 $ 81,955,000 $ Capital Equipment (R=Replace, N=New) R Air Compressor - 25,000 - -N Arrow Message Boards (3) 20,000 - - 40,000N Asphalt Hauler 55,000 - - -N Asphalt Roller (2) 100,000 - - - 100,000 R GPS Equipment 30,000 10,000 - 16,000N Heavy Equipment Attachments 25,000 25,000 - -N Loader (3) - - 350,000 350,000 350,000 N Pickup - - 55,000 -R Retroreflectometer - - 15,000 -N Skidsteer (2) - 100,000 - 100,000N Skidsteer Attachments - - - -R Snow Feeder - - - 300,000N Snow Gates - 24,000 - 24,000N Sweeper - - 250,000 -N Traffic Control Equipment 100,000 100,000 100,000 100,000 100,000 N/R Trailer (4) - 60,000 130,000 -Total Capital Equipment Program 330,000 $ 344,000 $ 900,000 $ 930,000 $ 550,000 $ Total Capital Program 109,502,845 $ 69,094,656 $ 70,451,569 $ 75,551,512 $ 82,505,000 $
AND
PARKS AND RECREATION

PAGE 136 / 2024–2028 CAPITAL PROGRAM PAGE 38 l CIP 2024–2028
SALES/USE TAX FUND 253 $58.4M 2024 2025 2026 2027 2028 $ 15.7M $ 7.9M $ 10.5M $ 10.2M $ 14.1M SALES/USE TAX FUND 253 PARKS AND RECREATION Capital Program 2024 2025 2026 2027 2028 Sources 2nd Penny Sales Tax 15,033,500 7,599,000 9,662,500 9,402,000 9,582,000 Contributions 640,000 30,000 530,000 530,000 4,500,000 Federal Grant - 225,000 225,000 225,000State Grants - 30,000 30,000 30,000Total Capital Sources 15,673,500 $ 7,884,000$ 10,447,500 $ 10,187,000 $ 14,082,000 $ Pg. Capital Improvement Projects 41 189,000 1,560,000 2,060,000 2,489,000 3,112,000 42 115,000 90,000 578,000 595,000 400,000 43 1,350,000 660,000 2,664,000 2,797,000 7,400,000 44 - - - 400,00045 300,000 - - -46 1,830,000 1,406,000 929,500 1,167,000 352,000 47 1,996,000 1,884,000 399,000 918,00048 571,000 - 627,000 - 660,000 49 6,978,500 - - -50 300,000 100,000 564,000 400,00051 - - - 75,00052 Greenways/Trail Improvements Neighborhood Parks Improvements Community/Regional Parks Improvements Falls Park Improvements Zoo Master Plan Improvements Park Land Acquisition Cyclic Park Infrastructure Improvements Play Structure Improvements Aquatic Facilities Improvements Park Storage Facilities Phillips Plaza Improvements Park and Recreation System Master Plan 175,000 - - -Total Capital Improvement Projects 13,804,500 $ 5,700,000$ 7,821,500 $ 8,841,000 $ 11,924,000 $ Capital Equipment (R=Replace, N=New) R Aerator, Deep Line (2) - 115,000 - -R Aerator, Ride On (4) - - - 75,000 25,000 R Air Compressor - - 30,000 -R Aquatic Equipment 20,000 - 20,000 -R Dirt Screen - - - 30,000R Electronic Displays (3) 20,000 - 40,000 -R Floor Scrubber - - 11,000 -R Forklift - - 35,000 -R Groomer, Ballfield (5) - - - 40,000 168,000 N Groomer, Sand Trap - - - 45,000R Holiday Light Displays - - 30,000 -R Kitchen Equipment - - 30,000 -R Loader (2) - 300,000 250,000 -R Mowers (28) 265,000 160,000 50,000 25,000 738,000 R Overseeder - - - 20,000N Painter, Line/Field (2) 42,000 - 55,000 -R Pickup (33) 160,000 975,000 531,000 560,000 400,000 N Sherpa 45,000 - - -N/R Skidloader (3) 65,000 - 90,000 - 75,000 R Snow Cage Attachment 30,000 - - - -
PARKS AND RECREATION (CONT.)
SALES/USE TAX FUND 253
2024–2028 CAPITAL PROGRAM / PAGE 137 PAGE 39 l CIP 2024–2028
PARKS AND RECREATION Capital Program 2024 2025 2026 2027 2028 Sources 2nd Penny Sales Tax 15,033,500 7,599,000 9,662,500 9,402,000 9,582,000 Contributions 640,000 30,000 530,000 530,000 4,500,000 Federal Grant - 225,000 225,000 225,000State Grants - 30,000 30,000 30,000Total Capital Sources 15,673,500 $ 7,884,000$ 10,447,500 $ 10,187,000 $ 14,082,000 $ Pg. Capital Improvement Projects 41 189,000 1,560,000 2,060,000 2,489,000 3,112,000 42 115,000 90,000 578,000 595,000 400,000 43 1,350,000 660,000 2,664,000 2,797,000 7,400,000 44 - - - 400,00045 300,000 - - -46 1,830,000 1,406,000 929,500 1,167,000 352,000 47 1,996,000 1,884,000 399,000 918,00048 571,000 - 627,000 - 660,000 49 6,978,500 - - -50 300,000 100,000 564,000 400,00051 - - - 75,00052 Greenways/Trail Improvements Neighborhood Parks Improvements Community/Regional Parks Improvements Falls Park Improvements Zoo Master Plan Improvements Park Land Acquisition Cyclic Park Infrastructure Improvements Play Structure Improvements Aquatic Facilities Improvements Park Storage Facilities Phillips Plaza Improvements Park and Recreation System Master Plan 175,000 - - -Total Capital Improvement Projects 13,804,500 $ 5,700,000$ 7,821,500 $ 8,841,000 $ 11,924,000 $ Capital Equipment (R=Replace, N=New) R Aerator, Deep Line (2) - 115,000 - -R Aerator, Ride On (4) - - - 75,000 25,000 R Air Compressor - - 30,000 -R Aquatic Equipment 20,000 - 20,000 -R Dirt Screen - - - 30,000R Electronic Displays (3) 20,000 - 40,000 -R Floor Scrubber - - 11,000 -R Forklift - - 35,000 -R Groomer, Ballfield (5) - - - 40,000 168,000 N Groomer, Sand Trap - - - 45,000R Holiday Light Displays - - 30,000 -R Kitchen Equipment - - 30,000 -R Loader (2) - 300,000 250,000 -R Mowers (28) 265,000 160,000 50,000 25,000 738,000 R Overseeder - - - 20,000N Painter, Line/Field (2) 42,000 - 55,000 -R Pickup (33) 160,000 975,000 531,000 560,000 400,000 N Sherpa 45,000 - - -N/R Skidloader (3) 65,000 - 90,000 - 75,000 R Snow Cage Attachment 30,000 - - -R Snowcat, Groomer 250,000 - - -R Snowmaker, Portable (2) 80,000 - - -N Soil Conditioner Attachment 14,000 - - -N Sprayer (2) - 85,000 - - 55,000 R Stump Cutter 75,000 - - -R SUV (2) 65,000 - - 55,000R Top Dresser, Field - - - 25,000R Tractor (9) 60,000 65,000 459,000 85,000 35,000 N Trailer - - - 200,000R Truck (4) 180,000 - - - 100,000 R Truck, Dump - - 165,000 -R Truck, Grappler - - - - 400,000 R Truck, 2 Ton 225,000 - - -R Truck, Flatbed - - 165,000 -N Groomer, Sand Trap - - - 45,000R Holiday Light Displays - - 30,000 -R Kitchen Equipment - - 30,000 -R Loader (2) - 300,000 250,000 -R Mowers (28) 265,000 160,000 50,000 25,000 738,000 R Overseeder - - - 20,000N Painter, Line/Field (2) 42,000 - 55,000 -R Pickup (33) 160,000 975,000 531,000 560,000 400,000 N Sherpa 45,000 - - -N/R Skidloader (3) 65,000 - 90,000 - 75,000 R Snow Cage Attachment 30,000 - - -R Snowcat, Groomer 250,000 - - -R Snowmaker, Portable (2) 80,000 - - -N Soil Conditioner Attachment 14,000 - - -N Sprayer (2) - 85,000 - - 55,000 R Stump Cutter 75,000 - - -R SUV (2) 65,000 - - 55,000R Top Dresser, Field - - - 25,000R Tractor (9) 60,000 65,000 459,000 85,000 35,000 N Trailer - - - 200,000R Truck (4) 180,000 - - - 100,000 R Truck, Dump - - 165,000 -R Truck, Grappler - - - - 400,000 R Truck, 2 Ton 225,000 - - -R Truck, Flatbed - - 165,000 -R Utility Vehicle (50) 220,000 412,000 435,000 128,000 162,000 R Van - - 65,000 -R Wood Chipper - - 35,000 -R Zamboni Attachments - - - 20,000R Zoo Indoor Play Structure 22,000 - - -R Zoo Lab Equipment 31,000 42,000 - -R Zoo Skidloader - - 75,000 -R Zoo Utility Vehicle (3) - 30,000 55,000 38,000Total Capital Equipment Program 1,869,000 $ 2,184,000 $ 2,626,000 $ 1,346,000 $ 2,158,000 $ Total Capital Program 15,673,500 $ 7,884,000 $ 10,447,500 $ 10,187,000 $ 14,082,000 $

PAGE 138 / 2024–2028 CAPITAL PROGRAM PAGE 54 l CIP 2024–2028 SALES/USE
FIRE $24.6M 2024 2025 2026 2027 2028 $ 3.1M $ 3.4M $ 7.1M $ 5.1M $ 5.9M SALES/USE
FIRE Capital Program 2024 2025 2026 2027 2028 2nd Penny Sales Tax 3,023,000 3,426,500 7,067,500 5,079,000 5,939,000 Grant Funds 104,000 - - -Total Capital Sources 3,127,000$ 3,426,500 $ 7,067,500 $ 5,079,000 $ 5,939,000 $ Pg. Capital Improvement Projects 56 Land Acquisition - - 500,000 300,000 300,000 57 Fire Station #13 - 300,000 3,500,000 -58 Fire Station #6 Rebuild - - - 500,000 3,750,000 Total Capital Improvement Projects - $ 300,000 $ 4,000,000 $ 800,000 $ 4,050,000 $ Capital Equipment (R=Replace, N=New) R Boat, Rescue (3) - - 45,000 150,000R Camera, Thermal Imaging (24) - - - 180,000R Collapse Warning System - - - 32,000R Compressor, High Pressure 65,000 - - -R CPR Devices (12) 265,500 - - -R Defibrillator/Monitor - - - - 400,000 N Drone - - - 44,500N/R EMS Equipment 59,000 - - 270,000N EMS Patient Care Simulator Manikins 175,000 - - -N EVT Shop Lift - - 115,000 -N/R Fire Truck (7) 675,000 675,000 1,350,000 1,405,000 675,000 R Fire Truck, Ladder (2) 1,250,000 1,250,000 - -R Fire Prevention Camera System 35,000 - - -R Fitness Equipment 27,000 27,000 27,000 27,000 27,000 R Hazmat Detection System 65,000 135,000 - 75,000R Hazmat Equipment (Grant) 104,000 - - -R Hydraulic Rescue Tools (6) - - - 375,000N Outdoor Warning Sirens (9) - 108,000 54,000 54,000 27,000 R Pump Training Module Upgrade - - - 85,000R Radios, Apparatus & Stations 36,500 36,500 36,500 36,500R SCBA Equipment - 750,000 750,000 -R SCBA Compressor Fill Station - - - - 85,000 N SCBA Helmet Washer (4) 35,000 - 35,000 35,000 35,000 N SCBA Test Machine - 20,000 - -R Sedan (5) - - 55,000 - 220,000 R SUV (3) - - 155,000 -R Trailer, Enclosed - - - 100,000R Trailer, Logistics - - 30,000 -R Training Prop Replacement 10,000 - 10,000 - 10,000 R Truck, Aerial - - - 1,300,000R Truck (3) 335,000 80,000 335,000
TAX FUND 253
TAX FUND 253
FIRE (CONT.) SALES/USE TAX FUND 253
2024–2028 CAPITAL PROGRAM / PAGE 139 PAGE 55 l CIP
2024–2028
FIRE Capital Program 2024 2025 2026 2027 2028 2nd Penny Sales Tax 3,023,000 3,426,500 7,067,500 5,079,000 5,939,000 Grant Funds 104,000 - - -Total Capital Sources 3,127,000$ 3,426,500 $ 7,067,500 $ 5,079,000 $ 5,939,000 $ Pg. Capital Improvement Projects 56 Land Acquisition - - 500,000 300,000 300,000 57 Fire Station #13 - 300,000 3,500,000 -58 Fire Station #6 Rebuild - - - 500,000 3,750,000 Total Capital Improvement Projects - $ 300,000 $ 4,000,000 $ 800,000 $ 4,050,000 $ Capital Equipment (R=Replace, N=New) R Boat, Rescue (3) - - 45,000 150,000R Camera, Thermal Imaging (24) - - - 180,000R Collapse Warning System - - - 32,000R Compressor, High Pressure 65,000 - - -R CPR Devices (12) 265,500 - - -R Defibrillator/Monitor - - - - 400,000 N Drone - - - 44,500N/R EMS Equipment 59,000 - - 270,000N EMS Patient Care Simulator Manikins 175,000 - - -N EVT Shop Lift - - 115,000 -N/R Fire Truck (7) 675,000 675,000 1,350,000 1,405,000 675,000 R Fire Truck, Ladder (2) 1,250,000 1,250,000 - -R Fire Prevention Camera System 35,000 - - -R Fitness Equipment 27,000 27,000 27,000 27,000 27,000 R Hazmat Detection System 65,000 135,000 - 75,000R Hazmat Equipment (Grant) 104,000 - - -R Hydraulic Rescue Tools (6) - - - 375,000N Outdoor Warning Sirens (9) - 108,000 54,000 54,000 27,000 R Pump Training Module Upgrade - - - 85,000R Radios, Apparatus & Stations 36,500 36,500 36,500 36,500R SCBA Equipment - 750,000 750,000 -R SCBA Compressor Fill Station - - - - 85,000 N SCBA Helmet Washer (4) 35,000 - 35,000 35,000 35,000 N SCBA Test Machine - 20,000 - -R Sedan (5) - - 55,000 - 220,000 R SUV (3) - - 155,000 -R Trailer, Enclosed - - - 100,000R Trailer, Logistics - - 30,000 -R Training Prop Replacement 10,000 - 10,000 - 10,000 R Truck, Aerial - - - 1,300,000R Truck (3) - - 335,000 80,000 335,000 R USAR Vehicle 325,000 - - -N USAR Dive Equipment - - 70,000 -R Utility Vehicle (2) - 70,000 - 30,000R Van, TV - 55,000 - -N Victim Locator - - - - 75,000 Total Capital Equipment Program 3,127,000$ 3,126,500 $ 3,067,500 $ 4,279,000 $ 1,889,000 $ Total Capital Program 3,127,000$ 3,426,500 $ 7,067,500 $ 5,079,000 $ 5,939,000 $ R Radios, Apparatus & Stations 36,500 36,500 36,500 36,500R SCBA Equipment - 750,000 750,000 -R SCBA Compressor Fill Station - - - - 85,000 N SCBA Helmet Washer (4) 35,000 - 35,000 35,000 35,000 N SCBA Test Machine - 20,000 - -R Sedan (5) - - 55,000 - 220,000 R SUV (3) - - 155,000 -R Trailer, Enclosed - - - 100,000R Trailer, Logistics - - 30,000 -R Training Prop Replacement 10,000 - 10,000 - 10,000 R Truck, Aerial - - - 1,300,000R Truck (3) - - 335,000 80,000 335,000 R USAR Vehicle 325,000 - - -N USAR Dive Equipment - - 70,000 -R Utility Vehicle (2) - 70,000 - 30,000R Van, TV - 55,000 - -N Victim Locator - - - - 75,000 Total Capital Equipment Program 3,127,000$ 3,126,500 $ 3,067,500 $ 4,279,000 $ 1,889,000 $ Total Capital Program 3,127,000$ 3,426,500 $ 7,067,500 $ 5,079,000 $ 5,939,000 $
SALES/USE TAX FUND 253

PAGE 140 / 2024–2028 CAPITAL PROGRAM PAGE 60 l CIP 2024–2028 POLICE $13.4M 2024 2025 2026 2027 2028 $ 1.4M $ 3.1M $ 2.0M $ 5.0M $ 1.9M
POLICE Capital Program 2024 2025 2026 2027 2028 Sources 2nd Penny Sales Tax 1,361,100 3,076,500 2,022,100 4,970,100 1,912,500 Grant Funds 83,000 - - -Total Capital Sources 1,444,100$ 3,076,500$ 2,022,100$ 4,970,100$ 1,912,500$ Pg. Capital Improvement Projects 61 Westside Report to Work Station - 1,500,000 - -62 Eastside Report to Work Station - - 500,000 3,250,000Total Capital Improvement Projects - $ 1,500,000$ 500,000 $ 3,250,000$ - $ Capital Equipment (R=Replace, N=New) R Camera, Multispectral (Grant) 83,000 - - -R Evidence Cabinet - - 7,600 -N GPS Equipment 8,600 - - -N Infrared Spectrometer - - - 35,000R K-9 Dog (4) 18,000 36,000 - - 18,000 R Motorcycle (6) 36,000 - 36,000 - 36,000 R Patrol Crossover, K9 (3) - 122,000 80,000 -R Patrol Crossover (90) 1,260,000 1,300,000 1,240,000 1,526,600 1,560,000 R Radios, (Mobile, Car) 38,500 38,500 38,500 38,500 38,500 R Sedan (11) - 80,000 120,000 120,000 120,000 R Truck, Animal Control (2) - - - - 140,000 Total Capital Equipment Program 1,444,100$ 1,576,500$ 1,522,100$ 1,720,100$ 1,912,500$ Total Capital Program 1,444,100$ 3,076,500$ 2,022,100$ 4,970,100$ 1,912,500$

2024–2028 CAPITAL PROGRAM / PAGE 141 PAGE 64 l CIP 2024–2028 SALES/USE TAX FUND 253 GENERAL FACILITIES $3.2M 2024 2025 2026 2027 2028 $ 0.6M $ 0.6M $ 0.5M $ 0.7M $ 0.8M GENERAL FACILITIES Capital Program 2024 2025 2026 2027 2028 Sources 2nd Penny Sales Tax 560,000 548,000 525,000 747,000 782,000 Total Capital Sources 560,000 $ 548,000 $ 525,000 $ 747,000 $ 782,000 $ Pg. Capital Improvement Projects 65 Centralized Land Acquisition 560,000 548,000 525,000 747,000 782,000 Total Capital Program 560,000 $ 548,000 $ 525,000 $ 747,000 $ 782,000 $ SALES/USE TAX FUND 253

PAGE 142 / 2024–2028 CAPITAL PROGRAM PAGE 66 l CIP 2024–2028 SALES/USE TAX FUND 253 COMMUNICATIONS $0.8M 2024 2025 2026 2027 2028 $ 0.2M $ 0.2M $ 0.0M $ 0.1M $ 0.3M SALES/USE TAX FUND 253 COMMUNICATIONS Capital Program 2024 2025 2026 2027 2028 Sources 2nd Penny Sales Tax 160,000 195,000 17,500 90,000 325,000 Total Capital Sources 160,000 $ 195,000 $ 17,500 $ 90,000 $ 325,000 $ Capital Equipment (R=Replace, N=New) R City Link Studio Upgrade 160,000 35,000 10,000 40,000 325,000 R Drone - - 7,500 -R Editing System - 70,000 - -R Print Shop Equipment - - - 50,000R Rebroadcast System - 90,000 - -Total Capital Equipment Program 160,000 $ 195,000 $ 17,500 $ 90,000 $ 325,000 $ Total Capital Program 160,000 $ 195,000 $ 17,500 $ 90,000 $ 325,000 $

2024–2028 CAPITAL PROGRAM / PAGE 143 PAGE 68 l CIP 2024–2028 SALES/USE TAX FUND 253 PUBLIC HEALTH $0.6M 2024 2025 2026 2027 2028 $ 0.1M $ 0.3M $ 0.2M $ 0.0M $ 0.0M SALES/USE TAX FUND 253 PUBLIC HEALTH Capital Program 2024 2025 2026 2027 2028 Sources 2nd Penny Sales Tax 138,000 284,000 198,500 -Total Capital Sources 138,000 $ 284,000 $ 198,500 $ - $ - $ Capital Equipment (R=Replace, N=New) R Analyzer, Chemistry 15,000 - - -R Colposcopy 13,000 - - -R Dental Chair (5) - 104,000 - -R Dental Tool Assistant - 23,000 - -R Laser, Dental - - 8,500 -R Lab Water Testing Equipment - - 39,000 -R Lift Chair, ADA - - 16,000 -R Pickup, Vector (2) 110,000 - - -R Sprayer, ULV (9) - - 135,000 -R Sterilizers - 16,000 - -R X-Ray Sensors - 50,000 - -R X-Ray System, Digital Pano - 57,000 - -R X-Ray, Dental Portable - 34,000 - -Total Capital Equipment Program 138,000 $ 284,000 $ 198,500 $ - $ - $ Total Capital Program 138,000 $ 284,000 $ 198,500 $ - $ - $
PAGE 144 / 2024–2028 CAPITAL PROGRAM PAGE 70 l CIP 2024–2028 SALES/USE TAX FUND 253
$4.6M 2024 2025 2026 2027 2028 $ 0.9M $ 0.9M $ 1.0M $ 0.9M $ 0.9M
TAX
SIOUXLAND LIBRARIES Capital Program 2024 2025 2026 2027 2028 Sources 2nd Penny Sales Tax 845,000 790,000 980,000 830,000 865,000 Minnehaha County 65,000 65,000 65,000 65,000 65,000 Donations 11,000 - - -Total Capital Sources 921,000 $ 855,000 $ 1,045,000 $ 895,000 $ 930,000 $ Capital Equipment (R=Replace, N=New) N Library Print & AV Materials 781,000 790,000 810,000 830,000 850,000 N Library Print & AV Materials - County 65,000 65,000 65,000 65,000 65,000 R Interactive Learning Equipment - - - - 15,000 R Shelving - - 110,000 -R Signs, Digital - - 60,000 -R Van, Courier 75,000 - - -Total Capital Equipment Program 921,000 $ 855,000 $ 1,045,000 $ 895,000 $ 930,000 $ Total Capital Program 921,000 $ 855,000 $ 1,045,000 $ 895,000 $ 930,000 $
SIOUXLAND LIBRARIES
SALES/USE
FUND 253

2024–2028 CAPITAL PROGRAM / PAGE 145 PAGE 72 l CIP 2024–2028 SALES/USE TAX FUND 253 PLANNING AND DEVELOPMENT SERVICES $0.8M 2024 2025 2026 2027 2028 $ 0.3M $ 0.14M $ 0.14M $ 0.1M $ 0.1M SALES/USE TAX FUND 253 PLANNING AND DEVELOPMENT SERVICES Capital Program 2024 2025 2026 2027 2028 Sources 2nd Penny Sales Tax 287,500 140,000 140,000 140,000 140,000 Total Capital Sources 287,500$ 140,000$ 140,000$ 140,000$ 140,000$ Pg. Capital Improvement Projects 73 Sculpture Walk 35,000 40,000 40,000 40,000 40,000 74 Core Façade Easement 100,000 100,000 100,000 100,000 100,000 Total Capital Improvement Projects 135,000$ 140,000$ 140,000$ 140,000$ 140,000$ Capital Equipment (R=Replace, N=New) N/R Truck (3) 152,500 - - -Total Capital Equipment Program 152,500$ - $ - $ - $ - $ Total Capital Program 287,500$ 140,000$ 140,000$ 140,000$ 140,000$
ENTERTAINMENT TAX FUND 250

PAGE 146 / 2024–2028 CAPITAL PROGRAM PAGE 76 l CIP 2024–2028 ENTERTAINMENT TAX FUND 250 ENTERTAINMENT VENUES $25.9M 2024 2025 2026 2027 2028 $ 6.4M $ 7.5M $ 4.9M $ 4.7M $ 2.4M ENTERTAINMENT VENUES Capital Program 2024 2025 2026 2027 2028 Sources Entertainment Tax 6,395,000 7,489,000 4,910,000 4,695,000 2,405,000 Total Capital Sources 6,395,000$ 7,489,000$ 4,910,000$ 4,695,000$ 2,405,000$ Pg. Capital Improvement Projects 78 Arena Building Improvements 200,000 - - -79 Convention Center Building Improvements 300,000 - 450,000 - 50,000 80 Event Center Building Improvements 980,000 780,000 1,495,000 1,875,000 1,300,000 81 Washington Pavilion Bldg Improvements 1,730,000 1,159,000 1,725,000 1,350,000 850,000 82 Orpheum Building Improvements 500,000 825,000 350,000 -Total Capital Improvement Projects 3,710,000$ 2,764,000$ 4,020,000$ 3,225,000$ 2,200,000$ Capital Equipment (R=Replace, N=New) Arena - 65,000 68,000 -R Truck (2) - 65,000 68,000 -Convention Center 149,000 215,000 325,000 25,000 30,000 R Audio Visual Equipment - - 300,000 -R Carpet Extractor - - - 25,000R Forklift - 50,000 - -R Ice Machine 24,000 - - -R Mixer 13,000 - - -R Pipe and Drape - 75,000 - -R Refrigerator/Freezer 20,000 - - -R Scrubber, Riding (2) 25,000 - - - 30,000 R Skillet, Tilting 20,000 - - -R Stages, Rolling - 90,000 - -R Vacuum, Riding (2) 25,000 - 25,000 -N Vertical Lift 22,000 - - -Event Center 1,510,000 3,940,000 327,000 995,000 75,000 N AV Equipment 175,000 - - -R Bobcat - - 72,000 -N Concession Equipment 300,000 - 150,000 150,000R Garbage Cans 100,000 - - -R Lift, Wheelchair - - 30,000 -R Loader - - - 145,000R Phone System - 325,000 - -N Radios 150,000 - - -R Refrigerators, Suites - - - - 75,000 N Security System - 275,000 - -R Scorers Table - 250,000 - -R Servers, Switches, Blades 700,000 - - - -
ENTERTAINMENT VENUES (CONT.)
ENTERTAINMENT TAX FUND 250
2024–2028 CAPITAL PROGRAM / PAGE 147 PAGE 77 l CIP
2024–2028
N Pickup - - - 65,000R Phone System - 350,000 - -R Security System - - 100,000 -R Show Equipment - - - - 100,000 Orpheum Theater 300,000 - - 60,000N Network Equipment - - - 60,000R Sound System 300,000 - - -Total Capital Equipment Program 2,685,000 $ 4,725,000 $ 890,000 $ 1,470,000 $ 205,000 $ Total Capital Program 6,395,000 $ 7,489,000 $ 4,910,000 $ 4,695,000 $ 2,405,000 $ ENTERTAINMENT VENUES Capital Program 2024 2025 2026 2027 2028 Sources Entertainment Tax 6,395,000 7,489,000 4,910,000 4,695,000 2,405,000 Total Capital Sources 6,395,000$ 7,489,000$ 4,910,000$ 4,695,000$ 2,405,000$ Pg. Capital Improvement Projects 78 Arena Building Improvements 200,000 - - -79 Convention Center Building Improvements 300,000 - 450,000 - 50,000 80 Event Center Building Improvements 980,000 780,000 1,495,000 1,875,000 1,300,000 81 Washington Pavilion Bldg Improvements 1,730,000 1,159,000 1,725,000 1,350,000 850,000 82 Orpheum Building Improvements 500,000 825,000 350,000 -Total Capital Improvement Projects 3,710,000$ 2,764,000$ 4,020,000$ 3,225,000$ 2,200,000$ Capital Equipment (R=Replace, N=New) Arena - 65,000 68,000 -R Truck (2) - 65,000 68,000 -Convention Center 149,000 215,000 325,000 25,000 30,000 R Audio Visual Equipment - - 300,000 -R Carpet Extractor - - - 25,000R Forklift - 50,000 - -R Ice Machine 24,000 - - -R Mixer 13,000 - - -R Pipe and Drape - 75,000 - -R Refrigerator/Freezer 20,000 - - -R Scrubber, Riding (2) 25,000 - - - 30,000 R Skillet, Tilting 20,000 - - -R Stages, Rolling - 90,000 - -R Vacuum, Riding (2) 25,000 - 25,000 -N Vertical Lift 22,000 - - -Event Center 1,510,000 3,940,000 327,000 995,000 75,000 N AV Equipment 175,000 - - -R Bobcat - - 72,000 -N Concession Equipment 300,000 - 150,000 150,000R Garbage Cans 100,000 - - -R Lift, Wheelchair - - 30,000 -R Loader - - - 145,000R Phone System - 325,000 - -N Radios 150,000 - - -R Refrigerators, Suites - - - - 75,000 N Security System - 275,000 - -R Scorers Table - 250,000 - -R Servers, Switches, Blades 700,000 - - -R Skirting 85,000 - - -R Sweeper (2) - - 75,000 -R Video Board System - 3,050,000 - -R Video Upgrade, Front End - - - 550,000R Washer/Dryer - 40,000 - -R Zamboni - - - 150,000SF Stadium 41,000 - - -R Concession Equipment 25,000 - - -R Washing Machine 16,000 - - -Washington Pavilion 685,000 505,000 170,000 390,000 100,000 N Art Ceiling Grid Controls - - 70,000 -R China, Glass, Silver 100,000 - - -R Communication Equipment 85,000 - - -R Hearing Loop - - - 150,000 -
R Bobcat - - 72,000 -N Concession Equipment 300,000 - 150,000 150,000R Garbage Cans 100,000 - - -R Lift, Wheelchair - - 30,000 -R Loader - - - 145,000R Phone System - 325,000 - -N Radios 150,000 - - -R Refrigerators, Suites - - - - 75,000 N Security System - 275,000 - -R Scorers Table - 250,000 - -R Servers, Switches, Blades 700,000 - - -R Skirting 85,000 - - -R Sweeper (2) - - 75,000 -R Video Board System - 3,050,000 - -R Video Upgrade, Front End - - - 550,000R Washer/Dryer - 40,000 - -R Zamboni - - - 150,000SF Stadium 41,000 - - -R Concession Equipment 25,000 - - -R Washing Machine 16,000 - - -Washington Pavilion 685,000 505,000 170,000 390,000 100,000 N Art Ceiling Grid Controls - - 70,000 -R China, Glass, Silver 100,000 - - -R Communication Equipment 85,000 - - -R Hearing Loop - - - 150,000N KSDC Exhibits 500,000 - - -R Network Equipment 155,000 - -R Orchestra Shell - - - 175,000 -

PAGE 148 / 2024–2028 CAPITAL PROGRAM PAGE 84 l CIP 2024–2028 TRANSIT FUND 268 TRANSIT $5.3M 2024 2025 2026 2027 2028 $ 2.2M $ 0.1M $ 0.1M $ 2.4M $ 0.5M TRANSIT FUND 268 TRANSIT Capital Program 2024 2025 2026 2027 2028 Sources Transit Fund 2,200,000 100,000 153,500 2,350,000 500,000 Total Capital Sources 2,200,000$ 100,000 $ 153,500 $ 2,350,000 $ 500,000 $ Pg. Capital Improvement Projects 85 Transit Facilities Improvements 900,000 - - -Total Capital Improvement Projects 900,000 $ - $ - $ - $ - $ Capital Equipment (R=Replace, N=New) R Bus, Cutaway (18) 1,200,000 - - 2,250,000R Pickup - - 53,500 -N/R In Bus Technology - - - - 500,000 R Shelters, Bus 100,000 100,000 100,000 100,000Total Capital Equipment Program 1,300,000$ 100,000 $ 153,500 $ 2,350,000 $ 500,000 $ Total Capital Program 2,200,000$ 100,000 $ 153,500 $ 2,350,000 $ 500,000 $

2024–2028 CAPITAL PROGRAM / PAGE 149 PAGE 86 l CIP 2024–2028 STORM DRAINAGE FUND 272 STORM DRAINAGE $50.4M 2024 2025 2026 2027 2028 $ 12.4M $ 8.0M $ 10.8M $ 8.6M $ 10.6M STORM DRAINAGE FUND 272 STORM DRAINAGE Capital Program 2024 2025 2026 2027 2028 Sources Drainage Fees 8,905,000 8,057,000 10,759,000 8,591,000 10,598,000 State Loans 3,500,000 - - -Total Capital Sources 12,405,000 $ 8,057,000 $ 10,759,000 $ 8,591,000 $ 10,598,000 $ Pg. Capital Improvement Projects 87 Drainage Improvements in Developing Areas 2,580,000 3,100,000 2,990,000 1,410,000 4,140,000 88 Sump Pump Collection Systems 500,000 500,000 500,000 500,000 500,000 89 Unforeseen Drainage Improvements 340,000 350,000 360,000 370,000 390,000 90 Drainage Improvements in Existing Areas 1,590,000 260,000 1,690,000 1,450,000 1,960,000 91 Regional Stormwater Analysis and Improvements 1,430,000 1,760,000 3,170,000 1,690,000 1,500,000 92 Flood Control System Improvements 280,000 292,000 304,000 316,000 328,000 93 Covell Area Basin Drainage Improvements 50,000 50,000 50,000 900,000 50,000 94 Land Acquisition for Drainage Projects 1,180,000 930,000 930,000 1,230,000 930,000 95 Non Point Source Improvements 3,500,000 - - -Other Public Works Projects 14 Arterial Street Improvements 620,000 620,000 650,000 650,000 650,000 131 Sanitary Pipe Lining Program 60,000 60,000 60,000 60,000 60,000 Total Capital Improvement Projects 12,130,000 $ 7,922,000 $ 10,704,000 $ 8,576,000 $ 10,508,000 $ Capital Equipment (R=Replace, N=New) N Heavy Equipment Attachments - 15,000 - 15,000 30,000 N Mower - - - - 30,000 N Skidsteer - 120,000 - -R Sprayer - - 55,000 -N Stump Grinder - - - - 30,000 R Trailer 50,000 - - -R Truck, Dump 225,000 - - -Total Capital Equipment Program 275,000 $ 135,000 $ 55,000 $ 15,000 $ 90,000 $ Total Capital Program 12,405,000 $ 8,057,000 $ 10,759,000 $ 8,591,000 $ 10,598,000 $
PAGE 150 / 2024–2028 CAPITAL PROGRAM PAGE 98 l CIP 2024–2028 ENTERPRISE FUND 656 POWER AND DISTRIBUTION $18.1M 2024 2025 2026 2027 2028 $ 7.1M $ 3.3M $ 3.4M $ 2.4M $ 1.9M POWER AND DISTRUBUTION Capital Program 2024 2025 2026 2027 2028 Sources User Fees 7,102,000 3,370,000 3,367,610 2,345,100 1,888,500 Total Capital Sources 7,102,000 $ 3,370,000 $ 3,367,610 $ 2,345,100 $ 1,888,500 $ Pg. Capital Improvement Projects 99 Unforeseen Electrical System Replacement 280,000 300,000 320,000 340,000 360,000 100 Circuit Improvements 1,102,000 200,000 1,038,910 1,845,100 1,518,500 101 Lights and Power Campus Enhancements 5,500,000 2,750,000 2,000,000 -102 Pole Improvements Program - 120,000 - 130,000Total Capital Improvement Projects 6,882,000 $ 3,370,000 $ 3,358,910 $ 2,315,100 $ 1,878,500 $ Capital Equipment (R=Replace, N=New) R GPS Equipment - - - - 10,000 N Telehandler 75,000 - - -R Transmitter 10,000 - - -N Trailer, Wire 35,000 - - -N/R Trailer (3) - - 8,700 30,000N Truck 100,000 - - -Total Capital Equipment Program 220,000 $ - $ 8,700 $ 30,000 $ 10,000 $ Total Capital Program 7,102,000 $ 3,370,000 $ 3,367,610 $ 2,345,100 $ 1,888,500 $ ENTERPRISE FUND 656

2024–2028 CAPITAL PROGRAM / PAGE 151 PAGE 104 l CIP 2024–2028 ENTERPRISE FUND 665
$0.6M 2024 2025 2026 2027 2028 $ 0.1M $ 0.1M $ 0.2M $ 0.1M $ 0.1M PUBLIC PARKING Capital Program 2024 2025 2026 2027 2028 Sources User Fees 65,000 130,000 218,000 125,000 80,000 Total Capital Sources 65,000 $ 130,000$ 218,000$ 125,000$ 80,000 $ Pg. Capital Improvement Projects 105 Parking Lot & Ramp Improvements 65,000 75,000 80,000 80,000 80,000 Total Capital Improvement Projects 65,000 $ 75,000 $ 80,000 $ 80,000 $ 80,000 $ Capital Equipment (R=Replace, N=New) R Pickup-Plow/Custom Bed - 55,000 - -R Pickup (2) - - 94,000 -R Signs - - 44,000R SUV - - - 45,000Total Capital Equipment Program - $ 55,000 $ 138,000$ 45,000 $ - $ Total Capital Program 65,000 $ 130,000$ 218,000$ 125,000$ 80,000 $ ENTERPRISE FUND 665
PUBLIC PARKING

PAGE 152 / 2024–2028 CAPITAL PROGRAM PAGE 106 l CIP 2024–2028 ENTERPRISE FUND 666 SANITARY LANDFILL $19.7M 2024 2025 2026 2027 2028 $ 6.3M $ 1.9M $ 1.5M $ 4.3M $ 5.7M SANITARY LANDFILL Capital Program 2024 2025 2026 2027 2028 Sources User Fees 6,355,000 1,880,000 1,508,000 4,275,000 5,675,000 Total Capital Sources 6,355,000$ 1,880,000$ 1,508,000$ 4,275,000$ 5,675,000$ Pg. Capital Improvement Projects 107 Leachate Recirculation/Gas Infrastructure 2,720,000 1,055,000 425,000 435,000 435,000 108 Land Acquisition 200,000 200,000 200,000 200,000 200,000 109 Perimeter Control and Fencing 25,000 25,000 25,000 30,000 30,000 110 Building and Site Improvements 1,400,000 600,000 600,000 420,000 420,000 111 Wetland and Drainage Way Improvements 890,000 - - -112 Sanitary Landfill Expansion - - 90,000 3,025,000 4,515,000 113 Landfill Closure 770,000 - - -Total Capital Improvement Projects 6,005,000$ 1,880,000$ 1,340,000$ 4,110,000$ 5,600,000$ Capital Equipment (R=Replace, N=New) R Truck, Flusher - - 150,000 -N Material Handler 300,000 - - -N Sign, Message (2) - - 18,000 -R Toolcat - - - 100,000R Trash Pump (3) 50,000 - - 65,000 75,000 Total Capital Equipment Program 350,000 $ - $ 168,000 $ 165,000 $ 75,000 $ Total Capital Program 6,355,000$ 1,880,000$ 1,508,000$ 4,275,000$ 5,675,000$ ENTERPRISE FUND 666
ENTERPRISE FUND 675

2024–2028 CAPITAL PROGRAM / PAGE 153 PAGE 116 l CIP 2024–2028
WATER $116.9M 2024 2025 2026 2027 2028 $ 17.5M $ 20.8M $ 19.3M $ 29.9M $ 29.4M WATER Capital Program 2024 2025 2026 2027 2028 Sources User Fees 16,507,983 19,698,303 18,212,484 28,810,050 28,337,119 Platting Fees 1,020,000 1,040,000 1,060,000 1,080,000 1,100,000 Total Capital Sources 17,527,983 $ 20,738,303 $ 19,272,484 $ 29,890,050 $ 29,437,119 $ Pg. Capital Improvement Projects 118 Lewis and Clark Regional Water Systems 1,164,233 3,285,303 3,433,984 9,382,800 14,983,619 119 Water Purification Facility Improvements 269,000 3,270,000 - 13,128,000 4,139,000 120 Transmission System Improvements - 1,798,000 6,431,000 -121 Other Mains - Unforeseen Water Projects 400,000 100,000 100,000 100,000 100,000 122 Land Acquisition 50,000 50,000 50,000 50,000 50,000 123 Water Pipe Trenchless Rehabilitation - - - - 15,000 124 City Wide Water Main Replacement Projects - - - - 200,000 125 Water Storage Improvements 1,800,000 - 1,500,000 -Other Public Works Projects 7 Asphalt Street Rehabilitation 20,000 20,000 20,000 20,000 20,000 8 Neighborhood Street Rehabilitation Program 1,100,000 300,000 300,000 300,000 300,000 10 Concrete Pavement Restoration 40,000 40,000 40,000 40,000 40,000 11 Arterial Intersection Improvements 100,000 200,000 250,000 250,000 250,000 13 Major Street Reconstruction Program 2,300,000 5,275,000 385,000 1,000,000 3,900,000 14 Arterial Street Improvements 2,320,000 1,790,000 1,810,000 2,080,000 2,100,000 16 South Veterans Parkway Improvements 50,000 50,000 50,000 -17 Bridge Reconstruction Program - - 300,000 -18 Downtown Area - Street & Utility Improvements 25,000 350,000 200,000 250,000 250,000 20 School District/Park Site Coordination 50,000 50,000 50,000 50,000 50,000 21 Railroad Crossing Improvements 10,000 10,000 10,000 10,000 10,000 22 SDDOT Project Coordination 10,000 10,000 10,000 10,000 10,000 27 49th Street Extension - - 150,000 -28 Arrowhead Parkway Improvements 250,000 - - -29 85th St & I-29 Improvements 25,000 - - -30 Cliff Avenue and I229 Improvements - 500,000 - -31 Minnesota Avenue and i229 Improvements - - - 500,00090 Drainage Improvements in Existing Areas 25,000 400,000 550,000 25,000 25,000 135 Pump Station 240 Capacity Improvements 4,605,000 - - -Total Capital Improvement Projects 14,613,233 $ 17,498,303 $ 15,639,984 $ 27,195,800 $ 26,442,619 $ Capital Equipment (R=Replace, N=New) N AMR Equipment 650,000 750,000 825,000 850,000 900,000 R Air Compressor - - 20,000 - 20,000 R Chlorinator - 40,000 - -N Communication Headsets 22,250 - - - 15,000 R Concrete Saw - 7,500 - -N Crane - 100,000 - -N DCU Equipment 10,000 10,000 10,000 - 10,000 R Digital Flowmeters 40,000 40,000 40,000 40,000N Excavator, Mini - 150,000 - - -
ENTERPRISE FUND 675
WATER (CONT.)
ENTERPRISE FUND 675
PAGE 154 / 2024–2028 CAPITAL PROGRAM
PAGE 117 l CIP 2024–2028
WATER Capital Program 2024 2025 2026 2027 2028 Sources User Fees 16,507,983 19,698,303 18,212,484 28,810,050 28,337,119 Platting Fees 1,020,000 1,040,000 1,060,000 1,080,000 1,100,000 Total Capital Sources 17,527,983 $ 20,738,303 $ 19,272,484 $ 29,890,050 $ 29,437,119 $ Pg. Capital Improvement Projects 118 Lewis and Clark Regional Water Systems 1,164,233 3,285,303 3,433,984 9,382,800 14,983,619 119 Water Purification Facility Improvements 269,000 3,270,000 - 13,128,000 4,139,000 120 Transmission System Improvements - 1,798,000 6,431,000 -121 Other Mains - Unforeseen Water Projects 400,000 100,000 100,000 100,000 100,000 122 Land Acquisition 50,000 50,000 50,000 50,000 50,000 123 Water Pipe Trenchless Rehabilitation - - - - 15,000 124 City Wide Water Main Replacement Projects - - - - 200,000 125 Water Storage Improvements 1,800,000 - 1,500,000 -Other Public Works Projects 7 Asphalt Street Rehabilitation 20,000 20,000 20,000 20,000 20,000 8 Neighborhood Street Rehabilitation Program 1,100,000 300,000 300,000 300,000 300,000 10 Concrete Pavement Restoration 40,000 40,000 40,000 40,000 40,000 11 Arterial Intersection Improvements 100,000 200,000 250,000 250,000 250,000 13 Major Street Reconstruction Program 2,300,000 5,275,000 385,000 1,000,000 3,900,000 14 Arterial Street Improvements 2,320,000 1,790,000 1,810,000 2,080,000 2,100,000 16 South Veterans Parkway Improvements 50,000 50,000 50,000 -17 Bridge Reconstruction Program - - 300,000 -18 Downtown Area - Street & Utility Improvements 25,000 350,000 200,000 250,000 250,000 20 School District/Park Site Coordination 50,000 50,000 50,000 50,000 50,000 21 Railroad Crossing Improvements 10,000 10,000 10,000 10,000 10,000 22 SDDOT Project Coordination 10,000 10,000 10,000 10,000 10,000 27 49th Street Extension - - 150,000 -28 Arrowhead Parkway Improvements 250,000 - - -29 85th St & I-29 Improvements 25,000 - - -30 Cliff Avenue and I229 Improvements - 500,000 - -31 Minnesota Avenue and i229 Improvements - - - 500,00090 Drainage Improvements in Existing Areas 25,000 400,000 550,000 25,000 25,000 135 Pump Station 240 Capacity Improvements 4,605,000 - - -Total Capital Improvement Projects 14,613,233 $ 17,498,303 $ 15,639,984 $ 27,195,800 $ 26,442,619 $ Capital Equipment (R=Replace, N=New) N AMR Equipment 650,000 750,000 825,000 850,000 900,000 R Air Compressor - - 20,000 - 20,000 R Chlorinator - 40,000 - -N Communication Headsets 22,250 - - - 15,000 R Concrete Saw - 7,500 - -N Crane - 100,000 - -N DCU Equipment 10,000 10,000 10,000 - 10,000 R Digital Flowmeters 40,000 40,000 40,000 40,000N Excavator, Mini - 150,000 - -N Fill Valve - - 60,000 -N Generator, Controls 30,000 - - -N Generator, Portable - - 85,000 -N Generator, Tower - 22,500 22,500 22,500 27,500 R GPS Equipment - - - 17,000 17,000 R Heavy Equipment Attachments 25,000 25,000 - -N Hydroblaster - - - - 125,000 N HydroExcavator - - 600,000 -R Lab Equipment - 10,000 - 12,500R Leak Detection System - - 30,000 -N Monoanalyzer - 32,500 - -N Mower, Riding - - 20,000 -R Particle Counters 150,000 - - -R Pumps 100,000 210,000 75,000 -R SCADA Equipment 190,000 45,000 50,000 50,000 150,000 R Scrubber, Floor (3) 40,000 - - - -
90 Drainage Improvements in Existing Areas 25,000 400,000 550,000 25,000 25,000 135 Pump Station 240 Capacity Improvements 4,605,000 - - -Total Capital Improvement Projects 14,613,233 $ 17,498,303 $ 15,639,984 $ 27,195,800 $ 26,442,619 $ Capital Equipment (R=Replace, N=New) N AMR Equipment 650,000 750,000 825,000 850,000 900,000 R Air Compressor - - 20,000 - 20,000 R Chlorinator - 40,000 - -N Communication Headsets 22,250 - - - 15,000 R Concrete Saw - 7,500 - -N Crane - 100,000 - -N DCU Equipment 10,000 10,000 10,000 - 10,000 R Digital Flowmeters 40,000 40,000 40,000 40,000N Excavator, Mini - 150,000 - -N Fill Valve - - 60,000 -N Generator, Controls 30,000 - - -N Generator, Portable - - 85,000 -N Generator, Tower - 22,500 22,500 22,500 27,500 R GPS Equipment - - - 17,000 17,000 R Heavy Equipment Attachments 25,000 25,000 - -N Hydroblaster - - - - 125,000 N HydroExcavator - - 600,000 -R Lab Equipment - 10,000 - 12,500R Leak Detection System - - 30,000 -N Monoanalyzer - 32,500 - -N Mower, Riding - - 20,000 -R Particle Counters 150,000 - - -R Pumps 100,000 210,000 75,000 -R SCADA Equipment 190,000 45,000 50,000 50,000 150,000 R Scrubber, Floor (3) 40,000 - - -R Sludge Pump - - - - 70,000 R Spectrometer (2) - - 110,000 -R Sweeper, Riding - - - 50,000N/R Trailer (3) - 80,000 10,000 15,000R Transmitter - 22,500 - -N Trench Box (2) 22,500 - - 22,250R Turbidimeters 150,000 - - -N Truck, 1Ton - 115,000 - -N Truck, Locator 55,000 - - -R Valve Actuators 50,000 - - -N Water Fill Stations - 30,000 - 30,000N Water Meter 1,350,000 1,520,000 1,640,000 1,550,000 1,620,000 N Well, VFD 30,000 30,000 35,000 35,000 40,000 Total Capital Equipment Program 2,914,750 $ 3,240,000 $ 3,632,500 $ 2,694,250 $ 2,994,500 $ Total Capital Program 17,527,983 $ 20,738,303 $ 19,272,484 $ 29,890,050 $ 29,437,119 $
WATER RECLAMATION 2024 2025 2026 2027 2028
$ 110.3M $ 39.9M $ 47.2M $ 23.9M $ 73.4M WATER RECLAMATION Capital Program 2024 2025 2026 2027 2028 Sources User Fees 15,930,500 12,423,500 6,234,200 6,911,500 7,203,500 Contributions 4,270,600 - - -State Loans 90,074,000 27,516,000 40,974,000 16,975,000 66,208,000 Total Capital Sources 110,275,100 $ 39,939,500 $ 47,208,200 $ 23,886,500 $ 73,411,500 $ Pg. Capital Improvement Projects 130 Unforeseen Sanitary Sewers - Other Mains 2,000,000 2,250,000 2,500,000 2,750,000 3,000,000 131 Sanitary Pipe Lining Program 150,500 1,505,000 159,700 1,598,000 169,500 132 Manhole Rehabilitation Program 219,000 226,000 233,000 240,000 248,000 133 Future Interceptors 75,000 75,000 75,000 75,000 75,000 134 Water Reclamation Facility Expansion 7,271,000 29,973,000 36,881,000 13,026,000 34,709,000 135 Pump Station 240 Capacity Improvements 65,186,600 - - -136 ESSS Basin 18C Sanitary Sewer Extension 1,675,000 137 Pump Station Improvements 279,000 500,000 - -138 Basin 33 Sanitary Sewer Extension 520,000 - - -139 Basin 15 Sanitary Sewer Extension 23,130,000 - - -140 Septage Receiving Station 4,050,000 - - -141 Water Reclamation Building Improvements 480,000 - - -142 Opportune Land Acquisition 103,000 107,000 111,000 115,000 119,000 143 Southeast Basins Sanitary Sewer Improvements 1,812,000 1,078,000 4,093,000 4,093,000 32,795,000 144 Northeast Basins Sanitary Sewer Improvements 250,000 - - -145 Water Reclamation Collection Systems Master Plan - - - - 866,000 Other Public Works Projects 8 Neighborhood Street Rehabilitation Program 284,000 294,000 303,000 313,000 313,000 10 Concrete Pavement Restoration 25,000 25,000 25,000 25,000 25,000 11 Arterial Intersection Improvements 25,000 25,000 25,000 25,000 25,000 13 Major Street Reconstruction 855,000 550,000 1,020,000 200,000 200,000 14 Arterial Street Improvements 125,000 125,000 125,000 125,000 125,000 16 South Veterans Parkway Improvements 50,000 50,000 50,000 -17 Bridge Reconstruction Program - - 10,000 -18 Downtown Area - Street & Utility Improvements 50,000 730,000 825,000 40,000 40,000 20 School District/Park Site Coordination 10,000 10,000 10,000 10,000 10,000 21 Railroad Crossing Improvements 10,000 10,000 10,000 10,000 10,000 22 SDDOT Project Coordination 10,000 10,000 10,000 10,000 10,000 26 North Veterans Parkway Improvements 25,000 - - -27 49th Street Extension - - 20,000 -28 Arrowhead Parkway Improvements 10,000 - - -29 85th Street and I29 Improvements 25,000 - - -30 Cliff Avenue and I229 Improvements - 525,000 - -31 Minnesota Avenue and I229 Improvements - - - 375,00087 Drainage Improvements in Developing Areas - 243,000 - 205,000 90 Drainage Improvements in Existing Areas 200,000 206,000 213,000 220,000 227,000 101 Light and Power Campus Enhancements - 300,000 - -Total Capital Improvement Projects 108,905,100 $ 38,817,000 $ 46,698,700 $ 23,455,000 $ 72,966,500 $ Capital Equipment (R=Replace, N=New) R Communications Devices, Two-Way - 15,000 15,000 -R Crane (3) 25,000 50,000
ENTERPRISE FUND 677

2024–2028 CAPITAL PROGRAM / PAGE 155 PAGE 128 l CIP 2024–2028
ENTERPRISE FUND 677 $294.7M
WATER RECLAMATION (CONT.)
PAGE 156 / 2024–2028 CAPITAL PROGRAM
PAGE 129 l CIP 2024–2028
R Valve/Actuators - 20,000 - -N Valve, Air Release 40,000 40,000 40,000 40,000 45,000 N Van, CC TV - 400,000 - -R VFD 150,000 25,000 25,000 30,000 30,000 Total Capital Equipment Program 1,370,000 $ 1,122,500 $ 509,500 $ 431,500 $ 445,000 $ Total Capital Program 110,275,100 $ 39,939,500 $ 47,208,200 $ 23,886,500 $ 73,411,500 $ WATER RECLAMATION Capital Program 2024 2025 2026 2027 2028 Sources User Fees 15,930,500 12,423,500 6,234,200 6,911,500 7,203,500 Contributions 4,270,600 - - -State Loans 90,074,000 27,516,000 40,974,000 16,975,000 66,208,000 Total Capital Sources 110,275,100 $ 39,939,500 $ 47,208,200 $ 23,886,500 $ 73,411,500 $ Pg. Capital Improvement Projects 130 Unforeseen Sanitary Sewers - Other Mains 2,000,000 2,250,000 2,500,000 2,750,000 3,000,000 131 Sanitary Pipe Lining Program 150,500 1,505,000 159,700 1,598,000 169,500 132 Manhole Rehabilitation Program 219,000 226,000 233,000 240,000 248,000 133 Future Interceptors 75,000 75,000 75,000 75,000 75,000 134 Water Reclamation Facility Expansion 7,271,000 29,973,000 36,881,000 13,026,000 34,709,000 135 Pump Station 240 Capacity Improvements 65,186,600 - - -136 ESSS Basin 18C Sanitary Sewer Extension 1,675,000 137 Pump Station Improvements 279,000 500,000 - -138 Basin 33 Sanitary Sewer Extension 520,000 - - -139 Basin 15 Sanitary Sewer Extension 23,130,000 - - -140 Septage Receiving Station 4,050,000 - - -141 Water Reclamation Building Improvements 480,000 - - -142 Opportune Land Acquisition 103,000 107,000 111,000 115,000 119,000 143 Southeast Basins Sanitary Sewer Improvements 1,812,000 1,078,000 4,093,000 4,093,000 32,795,000 144 Northeast Basins Sanitary Sewer Improvements 250,000 - - -145 Water Reclamation Collection Systems Master Plan - - - - 866,000 Other Public Works Projects 8 Neighborhood Street Rehabilitation Program 284,000 294,000 303,000 313,000 313,000 10 Concrete Pavement Restoration 25,000 25,000 25,000 25,000 25,000 11 Arterial Intersection Improvements 25,000 25,000 25,000 25,000 25,000 13 Major Street Reconstruction 855,000 550,000 1,020,000 200,000 200,000 14 Arterial Street Improvements 125,000 125,000 125,000 125,000 125,000 16 South Veterans Parkway Improvements 50,000 50,000 50,000 -17 Bridge Reconstruction Program - - 10,000 -18 Downtown Area - Street & Utility Improvements 50,000 730,000 825,000 40,000 40,000 20 School District/Park Site Coordination 10,000 10,000 10,000 10,000 10,000 21 Railroad Crossing Improvements 10,000 10,000 10,000 10,000 10,000 22 SDDOT Project Coordination 10,000 10,000 10,000 10,000 10,000 26 North Veterans Parkway Improvements 25,000 - - -27 49th Street Extension - - 20,000 -28 Arrowhead Parkway Improvements 10,000 - - -29 85th Street and I29 Improvements 25,000 - - -30 Cliff Avenue and I229 Improvements - 525,000 - -31 Minnesota Avenue and I229 Improvements - - - 375,00087 Drainage Improvements in Developing Areas - 243,000 - 205,000 90 Drainage Improvements in Existing Areas 200,000 206,000 213,000 220,000 227,000 101 Light and Power Campus Enhancements - 300,000 - -Total Capital Improvement Projects 108,905,100 $ 38,817,000 $ 46,698,700 $ 23,455,000 $ 72,966,500 $ Capital Equipment (R=Replace, N=New) R Communications Devices, Two-Way - 15,000 15,000 -R Crane (3) 25,000 - 50,000 -R Floor Scrubber - - - 12,000R Distiller - - - 20,000N/R Flowmeters 600,000 25,000 25,000 30,000 30,000 R Generator, Portable (2) - - 47,500 -N Heavy Equipment Attachments 30,000 - - -R Hoists (2) - - 95,000 -R Lab Equipment - 20,000 - 20,000R Mower - - 32,000 -N Pickup 55,000 60,000 - -R Pumps 35,000 35,000 35,000 40,000 40,000 R Pump, Trash (4) 120,000 200,000 - - 30,000 R Pump, VFD (4) - 120,000 - 139,500R SCADA Equipment 50,000 50,000 100,000 100,000 200,000 N Slinger Spreader 125,000 - - -N SUV (4) 100,000 50,000 - - 55,000 ENTERPRISE FUND 677 26 North Veterans Parkway Improvements 25,000 - - -27 49th Street Extension - - 20,000 -28 Arrowhead Parkway Improvements 10,000 - - -29 85th Street and I29 Improvements 25,000 - - -30 Cliff Avenue and I229 Improvements - 525,000 - -31 Minnesota Avenue and I229 Improvements - - - 375,00087 Drainage Improvements in Developing Areas - 243,000 - 205,000 90 Drainage Improvements in Existing Areas 200,000 206,000 213,000 220,000 227,000 101 Light and Power Campus Enhancements - 300,000 - -Total Capital Improvement Projects 108,905,100 $ 38,817,000 $ 46,698,700 $ 23,455,000 $ 72,966,500 $ Capital Equipment (R=Replace, N=New) R Communications Devices, Two-Way - 15,000 15,000 -R Crane (3) 25,000 - 50,000 -R Floor Scrubber - - - 12,000R Distiller - - - 20,000N/R Flowmeters 600,000 25,000 25,000 30,000 30,000 R Generator, Portable (2) - - 47,500 -N Heavy Equipment Attachments 30,000 - - -R Hoists (2) - - 95,000 -R Lab Equipment - 20,000 - 20,000R Mower - - 32,000 -N Pickup 55,000 60,000 - -R Pumps 35,000 35,000 35,000 40,000 40,000 R Pump, Trash (4) 120,000 200,000 - - 30,000 R Pump, VFD (4) - 120,000 - 139,500R SCADA Equipment 50,000 50,000 100,000 100,000 200,000 N Slinger Spreader 125,000 - - -N SUV (4) 100,000 50,000 - - 55,000 R Transporter/Camera - 30,000 30,000 -R Trench Box - 17,500 - -N Tripods (4) 15,000 15,000 15,000 - 15,000 N UTV 25,000 - - - -

2024–2028 CAPITAL PROGRAM / PAGE 157 PAGE 148 l CIP 2024–2028
$12.2M 2024 2025 2026 2027 2028 $ 1.7M $ 3.7M $ 3.2M $ 0.6M $ 3.0M CENTRALIZED FACILITIES Capital Program 2024 2025 2026 2027 2028 Sources Service Fees 1,663,000 3,708,000 3,234,000 638,000 2,948,000 Total Capital Sources 1,663,000 $ 3,708,000 $ 3,234,000 $ 638,000 $ 2,948,000 $ Pg. Capital Improvement Projects 149 Centralized Facilities Improvements 1,425,000 3,675,000 3,100,000 625,000 2,850,000 Total Capital Improvement Projects 1,425,000 $ 3,675,000 $ 3,100,000 $ 625,000 $ 2,850,000 $ Capital Equipment (R=Replace, N=New) R Cleaning Equipment 13,000 - - 13,000R Lift, Aerial - 20,000 - -N Lift, Basket 50,000 - - -N Portable HVAC/Generator 30,000 - - -R Scrubber, Auto Ride On (5) - 13,000 49,000 - 13,000 N Trailer 15,000 - - -N UTV 45,000 - - -N/R Van (3) 85,000 - 85,000 - 85,000 Total Capital Equipment Program 238,000 $ 33,000 $ 134,000 $ 13,000 $ 98,000 $ Total Capital Program 1,663,000 $ 3,708,000 $ 3,234,000 $ 638,000 $ 2,948,000 $
INTERNAL SERVICE FUND 848
CENTRALIZED FACILITIES
INTERNAL SERVICE FUND 848
INTERNAL SERVICE FUND 851

PAGE 158 / 2024–2028 CAPITAL PROGRAM PAGE 152 l CIP 2024–2028
FLEET $36.0M 2024 2025 2026 2027 2028 $ 4.4M $ 7.7M $ 10.9M $ 9.5M $ 3.5M FLEET REVOLVING Capital Program 2024 2025 2026 2027 2028 Sources Service Fees 4,430,500 7,670,000 10,890,000 9,551,000 3,475,000 Total Capital Sources 4,430,500$ 7,670,000 $ 10,890,000 $ 9,551,000$ 3,475,000$ Pg. Capital Improvement Projects 154 Underground Storage Tanks 458,000 - - -Total Capital Improvement Projects 458,000 $ - $ - $ - $ - $ Capital Equipment (R=Replace, N=New) R Amphibious Vehicle - - 30,000 -R Backhoe (3) 225,000 - 250,000 - 375,000 R Compactor (2) - - 1,500,000 1,500,000R Compost Turner - - - 500,000R Crane 40,000 - - -R Digger - 400,000 - -R Dozer (3) - 1,100,000 150,000 -R Easement Machine - - 90,000 -R Excavator (3) - 400,000 225,000 -R Front End Loader (3) 350,000 - 1,000,000 -R Generator, Compressor - 20,000 - - 20,000 R Grinder - - - 1,500,000R Ironworker - 20,000 - -R Oil Distributor - - - 250,000R Pickup (46) 667,500 715,000 995,000 880,000 165,000 R Sander (16) 1,400,000 - 1,750,000 2,450,000 1,400,000 R Scraper - - 1,850,000 -R Sedan (5) 90,000 - 150,000 - 120,000 R Skidloader (7) 280,000 210,000 - 100,000 250,000 R Snowblower (2) - - 420,000 -R Sweeper (2) - 600,000 - -R Toolcat - - - 41,000R Tractor - 500,000 - -R Trailer (2) - 135,000 - - 15,000 R Trailer, Side Dump (2) 240,000 - - -R Truck (18) 100,000 370,000 1,115,000 1,070,000 180,000 R Truck, Box - 425,000 - -R Truck, Bucket (2) 200,000 400,000 - -R Truck, Dump (10) 225,000 1,400,000 240,000 250,000 700,000 R Truck w/ Jet Vacuum (3) - 600,000 700,000 750,000R Truck, Hook (2) - - 250,000 260,000R Truck, Semi (2) - - 175,000 - 250,000 R Van (3) 155,000 - - - -
INTERNAL SERVICE FUND 851
FLEET (CONT.)
2024–2028 CAPITAL PROGRAM / PAGE 159 PAGE 153 l CIP
2024–2028
FLEET REVOLVING Capital Program 2024 2025 2026 2027 2028 Sources Service Fees 4,430,500 7,670,000 10,890,000 9,551,000 3,475,000 Total Capital Sources 4,430,500$ 7,670,000 $ 10,890,000 $ 9,551,000$ 3,475,000$ Pg. Capital Improvement Projects 154 Underground Storage Tanks 458,000 - - -Total Capital Improvement Projects 458,000 $ - $ - $ - $ - $ Capital Equipment (R=Replace, N=New) R Amphibious Vehicle - - 30,000 -R Backhoe (3) 225,000 - 250,000 - 375,000 R Compactor (2) - - 1,500,000 1,500,000R Compost Turner - - - 500,000R Crane 40,000 - - -R Digger - 400,000 - -R Dozer (3) - 1,100,000 150,000 -R Easement Machine - - 90,000 -R Excavator (3) - 400,000 225,000 -R Front End Loader (3) 350,000 - 1,000,000 -R Generator, Compressor - 20,000 - - 20,000 R Grinder - - - 1,500,000R Ironworker - 20,000 - -R Oil Distributor - - - 250,000R Pickup (46) 667,500 715,000 995,000 880,000 165,000 R Sander (16) 1,400,000 - 1,750,000 2,450,000 1,400,000 R Scraper - - 1,850,000 -R Sedan (5) 90,000 - 150,000 - 120,000 R Skidloader (7) 280,000 210,000 - 100,000 250,000 R Snowblower (2) - - 420,000 -R Sweeper (2) - 600,000 - -R Toolcat - - - 41,000R Tractor - 500,000 - -R Trailer (2) - 135,000 - - 15,000 R Trailer, Side Dump (2) 240,000 - - -R Truck (18) 100,000 370,000 1,115,000 1,070,000 180,000 R Truck, Box - 425,000 - -R Truck, Bucket (2) 200,000 400,000 - -R Truck, Dump (10) 225,000 1,400,000 240,000 250,000 700,000 R Truck w/ Jet Vacuum (3) - 600,000 700,000 750,000R Truck, Hook (2) - - 250,000 260,000R Truck, Semi (2) - - 175,000 - 250,000 R Van (3) 155,000 - - -R Wheel Loader - 375,000 - -Total Capital Equipment Program 3,972,500$ 7,670,000 $ 10,890,000 $ 9,551,000$ 3,475,000$ Total Capital Program 4,430,500$ 7,670,000 $ 10,890,000 $ 9,551,000$ 3,475,000$
851 R Tractor - 500,000 - -R Trailer (2) - 135,000 - - 15,000 R Trailer, Side Dump (2) 240,000 - - -R Truck (18) 100,000 370,000 1,115,000 1,070,000 180,000 R Truck, Box - 425,000 - -R Truck, Bucket (2) 200,000 400,000 - -R Truck, Dump (10) 225,000 1,400,000 240,000 250,000 700,000 R Truck w/ Jet Vacuum (3) - 600,000 700,000 750,000R Truck, Hook (2) - - 250,000 260,000R Truck, Semi (2) - - 175,000 - 250,000 R Van (3) 155,000 - - -R Wheel Loader - 375,000 - -Total Capital Equipment Program 3,972,500$ 7,670,000 $ 10,890,000 $ 9,551,000$ 3,475,000$ Total Capital Program 4,430,500$ 7,670,000 $ 10,890,000 $ 9,551,000$ 3,475,000$
INTERNAL SERVICE FUND


PAGE 160 / 2024–2028 CAPITAL PROGRAM PAGE 156 l CIP 2024–2028 INTERNAL SERVICE FUND 857
$7.0M 2024 2025 2026 2027 2028 $ 1.4M $ 1.4M $ 1.4M $ 1.4M $ 1.4M ENTERPRISE NETWORK TECHNOLOGY FUND Capital Program 2024 2025 2026 2027 2028 Sources Service Fees 1,400,000 1,400,000 1,400,000 1,400,000 1,400,000 Total Capital Sources 1,400,000 $ 1,400,000 $ 1,400,000 $ 1,400,000 $ 1,400,000 $ Capital Equipment (R=Replace, N=New) R Servers, Blades and Storage 875,000 875,000 805,000 805,000 805,000 R Switches, Routers & Equipment 375,000 375,000 345,000 345,000 345,000 R Wireless Network Infrastructure 150,000 150,000 250,000 250,000 250,000 Total Capital Equipment Program 1,400,000 $ 1,400,000 $ 1,400,000 $ 1,400,000 $ 1,400,000 $ Total Capital Program 1,400,000 $ 1,400,000 $ 1,400,000 $ 1,400,000 $ 1,400,000 $ INTERNAL SERVICE FUND 857
ENTERPRISE NETWORK TECHNOLOGY FUND
CAPITAL PLAN SUMMARY
2024-2028 Capital Program
(Capital Improvements & Capital Equipment)
2024–2028 CAPITAL PROGRAM / PAGE 161
PAGE 159 l CIP 2024–2028
Funding Sources 2024 2025 2026 2027 2028 Total Sales/Use Tax 80,675,945 $ 80,828,656 $ 86,649,669 $ 92,334,612 $ 97,515,500 $ 438,004,382 $ Platting Fees 4,230,000 4,340,000 4,450,000 4,530,000 4,610,000 22,160,000 User Fees 45,960,483 37,501,803 29,540,294 42,466,650 43,184,119 198,653,349 Internal Service Fees 7,493,500 12,778,000 15,524,000 11,589,000 7,823,000 55,207,500 State Contributions 48,270,600 30,000 30,000 30,000 - 48,360,600 Federal Funds - 225,000 225,000 225,000 - 675,000 State Loans 93,574,000 27,516,000 40,974,000 16,975,000 66,208,000 245,247,000 Other Contributions 2,000,000 - - - - 2,000,000 Storm Drainage Fees 8,905,000 8,057,000 10,759,000 8,591,000 10,598,000 46,910,000 Entertainment Tax 6,395,000 7,489,000 4,910,000 4,695,000 2,405,000 25,894,000 Transit Funds 2,200,000 100,000 153,500 2,350,000 500,000 5,303,500 Other Financing 1,928,000 1,120,000 1,620,000 1,620,000 5,590,000 11,878,000 Total Sources 301,632,528 $ 179,985,459 $ 194,835,463 $ 185,406,262 $ 238,433,619 $ 1,100,293,331 $ Funding Uses 2024 2025 2026 2027 2028 Total General Facilities 560,000 548,000 525,000 747,000 782,000 3,162,000 Communications 160,000 $ 195,000 $ 17,500 $ 90,000 $ 325,000 $ 787,500 $ General Government 720,000 743,000 542,500 837,000 1,107,000 3,949,500 Fire 3,127,000 3,426,500 7,067,500 5,079,000 5,939,000 24,639,000 Police 1,444,100 3,076,500 2,022,100 4,970,100 1,912,500 13,425,300 Public Safety 4,571,100 6,503,000 9,089,600 10,049,100 7,851,500 38,064,300 Highways & Streets 109,502,845 69,094,656 70,451,569 75,551,512 82,505,000 407,105,582 Highways & Streets/Storm Drainage 12,405,000 8,057,000 10,759,000 8,591,000 10,598,000 50,410,000 Highways & Streets 121,907,845 77,151,656 81,210,569 84,142,512 93,103,000 457,515,582 Health 138,000 284,000 198,500 - - 620,500 Ent. Venues/Events Complex 3,139,000 5,000,000 2,665,000 2,895,000 1,455,000 15,154,000 Ent. Venues/SF Stadium 41,000 - - - - 41,000 Ent. Venues/Washington Pavilion 2,415,000 1,664,000 1,895,000 1,740,000 950,000 8,664,000 Ent. Venues/Orpheum 800,000 825,000 350,000 60,000 - 2,035,000 Parks & Recreation 15,673,500 7,884,000 10,447,500 10,187,000 14,082,000 58,274,000 Library 921,000 855,000 1,045,000 895,000 930,000 4,646,000 Culture & Recreation 22,989,500 16,228,000 16,402,500 15,777,000 17,417,000 88,814,000 Planning & Development Services 287,500 140,000 140,000 140,000 140,000 847,500 Transit 2,200,000 100,000 153,500 2,350,000 500,000 5,303,500 Public Parking 65,000 130,000 218,000 125,000 80,000 618,000 Power Distribution 7,102,000 3,370,000 3,367,610 2,345,100 1,888,500 18,073,210 Sanitary Landfill 6,355,000 1,880,000 1,508,000 4,275,000 5,675,000 19,693,000 Water 17,527,983 20,738,303 19,272,484 29,890,050 29,437,119 116,865,939 Water Reclamation 110,275,100 39,939,500 47,208,200 23,886,500 73,411,500 294,720,800 Enterprise Funds 141,325,083 66,057,803 71,574,294 60,521,650 110,492,119 449,970,949 Centralized Facilities 1,663,000 3,708,000 3,234,000 638,000 2,948,000 12,191,000 $ Revolving Fleet 4,430,500 7,670,000 10,890,000 9,551,000 3,475,000 36,016,500 Enterprise Network Systems 1,400,000 1,400,000 1,400,000 1,400,000 1,400,000 7,000,000 Internal Service Funds 7,493,500 12,778,000 15,524,000 11,589,000 7,823,000 55,207,500 Total Uses 301,632,528 $ 179,985,459 $ 194,835,463 $ 185,406,262 $ 238,433,619 $ 1,100,293,331 $
SALES/USE TAX FUND 2024–2028 CAPITAL PROGRAM
Sales/Use Tax Fund - 2023-2027 Capital Program
Total Sales/Use Tax Fund Less Other Financing*
PAGE 162 / 2024–2028 CAPITAL PROGRAM PAGE 160 l CIP 2024–2028
Sources 2024 2025 2026 2027 2028 Total Sales/Use Tax (2nd Penny) $98,051,436 $102,954,009 $108,101,710 $113,506,795 $119,182,135 $541,796,085 Audits and Interest 750,000 750,000 750,000 750,000 750,000 3,750,000 Miscellaenous 150,000 150,000 150,000 150,000 150,000 750,000 Platting Fees 3,210,000 3,300,000 3,390,000 3,450,000 3,510,000 16,860,000 Other Financing 47,928,000 1,375,000 1,875,000 1,875,000 5,590,000 58,643,000 Total Sales Tax Fund Sources 150,089,436 $ 108,529,009 $ 114,266,710 $ 119,731,795 $ 129,182,135 $ 621,799,085 $ Uses Highways & Streets 2024 2025 2026 2027 2028 Total Capital Improvement Projects (CIP) 109,172,845 $ 68,750,656 $ 69,551,569 $ 74,621,512 $ 81,955,000 $ 404,051,582 $ Capital Equipment (OCEP) 330,000 344,000 900,000 930,000 550,000 3,054,000 Total Highways & Streets 109,502,845 69,094,656 70,451,569 75,551,512 82,505,000 407,105,582 Culture & Recreation Parks and Recreation (CIP) 13,804,500 5,700,000 7,821,500 8,841,000 11,924,000 48,091,000 Parks and Recreation (OCEP) 1,869,000 2,184,000 2,626,000 1,346,000 2,158,000 10,183,000 Library (OCEP) 921,000 855,000 1,045,000 895,000 930,000 4,646,000 Total Culture & Recreation 16,594,500 8,739,000 11,492,500 11,082,000 15,012,000 62,920,000 Other Departments General Facilities (CIP) 560,000 548,000 525,000 747,000 782,000 3,162,000 Fire (CIP) - 300,000 4,000,000 800,000 4,050,000 9,150,000 Fire (OCEP) 3,127,000 3,126,500 3,067,500 4,279,000 1,889,000 15,489,000 Police (CIP) - 1,500,000 500,000 3,250,000 - 5,250,000 Police (OCEP) 1,444,100 1,576,500 1,522,100 1,720,100 1,912,500 8,175,300 Public Health (OCEP) 138,000 284,000 198,500 - - 620,500 Communications (OCEP) 160,000 195,000 17,500 90,000 325,000 787,500 Planning & Development Services (CIP) 135,000 140,000 140,000 140,000 140,000 695,000 Planning & Development Services (OCEP) 152,500 - - - - 152,500 Total Other Departments 5,716,600 7,670,000 9,970,600 11,026,100 9,098,500 43,481,800 Total Departmental Uses 131,813,945 85,503,656 91,914,669 97,659,612 106,615,500 513,507,382 Transfers Transit Transfer 977,000 1,109,310 1,247,089 1,390,502 1,432,217 6,156,118 Fleet Transfer 250,000 250,000 250,000 250,000 250,000 1,250,000 Facilities Management Transfer 1,438,703 1,678,475 1,600,785 1,203,553 1,625,724 7,547,240 Total Transfers 2,665,703 3,037,785 3,097,874 2,844,055 3,307,941 14,953,358 Debt Service City Center Bond - General Government 1,803,350 1,804,350 1,803,750 1,801,000 1,800,750 9,013,200 Events Center Bonds - Entertainment 8,204,528 8,201,728 8,201,328 8,205,378 8,203,578 41,016,540 Quality of Life Bond - Culture & Recreation 1,835,250 763,490 - - 2,598,740 Quality of Life III Bond - Culture & Recreation 266,910 5,722,500 5,751,339 5,725,750 5,759,116 23,225,615 Public Safety Bond 3,399,750 3,395,500 3,397,750 3,396,000 3,395,250 16,984,250 Other Debt Service 100,000 100,000 100,000 100,000 100,000 500,000 Total Debt Service 15,609,788 19,987,568 19,254,167 19,228,128 19,258,694 93,338,345 Total Sales/Use Tax Fund 150,089,436 $ 108,529,009 $ 114,266,710 $ 119,731,795 $ 129,182,135 $ 621,799,085 $ * Donations from outside sources for specfic projects
15% 19% 17% 16% 16% 8% 10% 12% 12% 10% 16% 8% 10% 9% 8% 61% 63% 62% 63% 67% $0 $20 $40 $60 $80 $100 $120 $140 2024 2025 2026 2027 2028 $ Millions
Highways and Streets Culture and Recreation Other Dept. & Transfers Debt Service
SALES/USE TAX FUND
SALES TAX FUND
MAJOR CHANGES FROM 2023-2027 PLAN
MAJOR CHANGES FROM 2023-2027 PLAN
2024–2028 CAPITAL PROGRAM / PAGE 163 PAGE 161 l CIP 2024–2028
2024 2025 2026 2027 11009 Right-Of-Way Acquisition and Restoration Right of Way acquisition for Street Projects 1,700,000 - -11064 Arrowhead Parkway Improvements Widen Arrowhead Parkway and Veterans Parkway Intersection 4,000,000 - -11086 Bridge Reconstruction Program Marion Road and BNSF Overpass (construct) - - 3,000,00011088 Salt Storage Facility Salt Storage Dome Facility (960,000) - -20005 Light and Power Facility Enhancements Construction of new joint Lights/Traffic Building (3,000,000) 4,500,000 -06020 Centrailized Facilities Land Acquisition Strategic Land Acquistion 560,000 548,000 525,000 747,000 09008 Land Acquisition Will use Centralized Land Acquistion (250,000) (250,000) - 300,000 09016 Fire Station #13 Increased construction costs - - 500,00014079 Greenways/Trails Underpass(Legacy, Minn Ave, Pasley, Elmen Trail RR) (300,000) 375,000 -Arboretum - RR Trail - 250,000 -Neighborhood Connections - Lake Lorraine (38,000) (220,000) - 38,000 Neighborhood Connections - 26th & Hwy 100 (40,000) (222,000) -BSR - Bahnson to Great Bear - - (325,000)Dawley Farm Trail (18th to 26th) - - (369,000) 130,000 Arrowhead lower trail - - 135,000 757,000 Sanford SC to Diversion Dam-concrete - - - (600,000) Cherry Creek - Phase#3 - - - 320,000 14080 Neighborhood Parks Willow Ridge park - (78,000) (402,000) 480,000 Whispering Woods park - (65,000) (400,000) 65,000 Wild Meadows (6th & Dubuque) - 90,000 500,00014082 Community/Regional Park Improvements Sherman Park Improvements - (29,000) (131,000) 160,000 Harmodon - Field Renovations 850,000 (130,000) (540,000) 800,000 McCart - Bleacher Pads (326,000) - -Arboretum - Canoe Launch Improvements (150,000) - -Spencer Park - Flood Study - 100,000 60,000Cherry Rock - Picnic Shelter - - - 70,000 Terrace park - Master Plan Improvements - (95,000) (700,000)Great Bear - Bunny Hill improvements - - - (125,000) Sertoma - Butterfly House Renovation - 500,000 1,500,000 1,000,000 Sertoma - Restroom Replacement - - - 112,000 Sanford Sport - Multi Purpose Field - (152,500) 152,50014009 Aquatic Facilities Improvements Mckennan Final Design/Construct, QOL Pool Design 5,222,500 - -MAC- Locker Room Renovations 756,000 - -14071 Parks Storage Facility 49th Street Park Shop Campus Expansion (50,000) (2,300,000) -Family Park Shop Building - (64,000) (336,000) 400,000 Sherman Park Shop Building - 100,000 400,000 (500,000) 16002 Core Façade Easement 100,000 100,000 100,000 100,000 Planning & Development Services Highways and Streets Centralized Facilities Parks and Recreation
Fire
SALES/USE TAX 2024–2028 CAPITAL PROGRAM
(CASH BASIS)
Sales/Use Tax Analysis for the 2024-2028 Capital Program (Cash Basis)
Sales/Use Tax Plan-to-Plan Comparison (Debt/Transfers Unallocated to Departments)
PAGE 164 / 2024–2028 CAPITAL PROGRAM PAGE 162 l CIP 2024–2028
Highways & Streets 2023 2024 2025 2026 2027 2028 Total 2024-2028 Plan - $ 59,267,845 $ 64,769,656 $ 66,036,569 $ 71,076,512 $ 77,970,000 $ $339,120,582 2023-2027 Plan 54,278,159 57,521,845 60,169,656 62,476,569 70,660,511 - 305,106,740 Increase/(Decrease) 1,746,000 4,600,000 3,560,000 416,001 34,013,842 3 Culture & Recreation 2024-2028 Plan - 15,878,500 8,389,000 10,642,500 10,232,000 10,447,000 55,589,000 2023-2027 Plan 11,391,400 9,090,500 9,006,500 11,656,500 6,229,000 - 47,373,900 Increase/(Decrease) 6,788,000 (617,500) (1,014,000) 4,003,000 8,215,100 Other Departments 2024-2028 Plan - 5,529,600 7,670,000 9,970,600 11,026,100 9,098,500 43,294,800 2023-2027 Plan 5,558,500 4,653,285 7,640,500 8,120,100 10,300,100 - 36,272,485 Increase/(Decrease) 876,315 29,500 1,850,500 726,000 7,022,315 Debt Service 2024-2028 Plan - 15,609,788 19,987,568 19,254,167 19,228,128 19,258,694 93,338,345 2023-2027 Plan 16,020,506 19,492,878 18,415,068 17,652,829 17,653,128 - 89,234,409 Increase/(Decrease) (3,883,090) 1,572,500 1,601,338 1,575,000 4,103,936 Total Increase/(Decrease - $ 5,527,225 $ 5,584,500 $ 5,997,838 $ 6,720,001 $ - $ 53,355,193 $
$305.1 $47.4 $36.3 $89.2 $339.1 $55.6 $43.3 $93.3 $$50 $100 $150 $200 $250 $300 $350 $400 Highways & Streets Culture & Recreation Other Departments Debt Service Millions 2023-2027 Plan 2024-2028 Plan
SERVICE OUTCOMES AND STATISTICS
Protect lives and property from fires and other emergencies and provided life safety education.
Enhance
efforts in order to reduce crime and ensure the feeling of safety within the
initial call to dispatch and dispatch to police arrival.
Part I crimes include murder, rape, robbery, aggravated assault, burglary, larceny, motor vehicle theft, and arson.
Part I violent crimes.
Part I violent crimes are murder, rape, robbery and aggravated assault.
6) Increase or maintain clearance rates on Part I property crimes.
Note: Part I property crimes include burglary, larceny/theft, motor vehicle theft, and arson. Cleared crimes refer to those in which at least one person is arrested, charged with the offense, and turned over to the court for prosecution. Exceptional clearances occur when some element beyond law enforcement control precludes the placing of formal charges against the offender, such as
Protect the community from health hazards, disease transmission and provide access to services that promote health.
1) Percentage of diabetic patients whose HbA1c levels are less than or equal to 9 percent.
2) Percentage of adult patients with diagnosed hypertension whose most recent blood pressure was less than 140/90.
3) Percentage of women age 21‐64 who received one or more pap tests during the measurement year or during the two years prior.
4) Percentage of adults who are overweight or underweight with follow up plan.
5) Survival of bystander witnessed arrests of cardiac etiology who were found in a shockable rhythm.
6) Respond to citizen public health code concerns/complaints within 48 hours.
7) Results available from drinking water samples within 24 hours and pool/spa results available within 28 hours.
8) Reduction of potential food borne illness by decreasing the percentage of facilities having critical violations at the time of inspection.
9) Decrease the percentage of adults in the Sioux Falls MSA that currently smoke.
A
Some facilities only received one routine inspection due to COVID‐19.
Data not available at time of publishing. Siouxland Libraries
B
Expand access
library service and materials to enhance customer satisfaction.
SERVICE OUTCOMES & STATISTICS / PAGE 165
Fire
2021 Results2022 Results2023 Target2024 Target 1) Respond to 90% of emergency calls in
minutes. 9:37 min9:44 min9:33 min9:33 min Note: total response time includes
2) Maintain percentage of property saved during a fire. 99.0% 98.4% 98.0% 98.0% Value of property saved after fire exposure. $492.8 million$376.6 millionN/A N/A 3) Maintain ISO Rating (on a scale of 1‐10,
1/Yes 1/Yes 1/Yes 1/Yes 4) Conduct CPR education to public (certified and hands‐only). 2,794 2,670 2,400 2,400 5) Conduct multi‐agency disaster exercises. 5588 6) Conduct multi‐agency emergency management training courses. 3 18 10 10 Police
9:33
dispatch, turnout and travel time.
1 being the best) and maintain accredited status.
community
community. 2021 Results2022 Results2023 Target2024 Target 1) Effectively deploy patrol officers to maintain
reduce average
priority calls. 7 min. 47 sec.7 min. 34 sec.7 min. 30 sec.7 min. 30 sec. Note: Response time
Maintain or decrease Part I crimes per 1,000 population. 43.5 crimes45.0 crimes43.0 crimes43.0 crimes
3) Maintain or increase percentage
neighborhoods 93% 93% 95% 95% 4) Maintain or reduce
of
5.23 4.97 6 6 5) Increase or maintain clearance rates on
74% cleared 76.5% cleared 70% cleared 75% cleared
policing
or
response times on
includes
2)
Note:
of Nation Citizen Survey participants who felt safe in their
the ratio
injury producing traffic accidents per 1,000 population.
Note:
40% cleared 40.0% cleared 37% cleared 40% cleared
Public Health
2021 Results2022 Results2023 Target2024 Target
65% 67% 65% 65%
64% 65% 66% 66%
42% 45% 51% 51%
46% 33% 64% 64%
55% 47% 35% 35%
Unavailable B 77% 96% 96%
Unavailable B 99% 97% 97%
21% 8% 27% 27%
12% Unavailable B 15% 15%
‐
‐
2021 Results2022 Results2023 Target2024 Target 1) Library Visits (Physical & Virtual) 525,4831,527,5401,500,0002,000,000 2) Percentage of population with a Library Card 39% 40% 42% 40% 3) Circulation Per Capita 7.5 7.4 8.0 8.0 Parks & Recreation Enhance customer service and user satisfaction. 2021 Results2022 Results2023 Target2024 Target 1) Percentage of residents rating city parks as good or excellent 88% NAA 88% 90% 2) Percentage of residents rating recreation programs or classes as good or excellent 80% NAA 80% 85% 3) Percentage of residents rating recreation centers or facilities as good or excellent 81% NAA 81% 85% A National Community Survey conducted every other year
to
meet the needs and demands of our
PAGE 166 / SERVICE OUTCOMES & STATISTICS Housing Increase affordable housing
production, preservation, rehabilitation
and families stabilize their living situation. 2021 Results2022 Results2023 Target2024 Target 1) Total Housing units produced, preserved or rehabilitated 226 161 288 288 2) Number of households who received assistance 295 652 600 600 Transit Provide a safe, reliable, and efficient public transit service. 2021 Results2022 Results2023 Target2024 Target 1) Percentage of on‐time performance 99.0% 99.0% 98.0% 98.0% Public Parking
sufficient and convenient parking for both monthly leased parking customers and hourly customers. 2021 Results2022 Results2023 Target2024 Target 1) Percentage of the total available off‐street parking that is leased as of Dec 31 of each year 65% 71% 71% 71% Highways and Streets Provide safe, rideable streets and efficient traffic flow for the traveling public. 2021 Results2022 Results2023 Target2024 Target 1) Increase average street Overall Condition Index (OCI) rating ‐ 70.0 70.0 70.0 Note: 1‐100 scale 100 being a new street (last survey completed in 2019) 2) Time it takes to plow the streets after a snow alert has been issued <36 hours<36 hours48 hours48 hours 3) Snow and ice control expenditures per a. Lane Mile $2,065$2,176$2,750$3,400 b. Per capita $34 $36 $45 $56 4) Conduct traffic counts to determine impacts of future construction projects 560 565 500 500 5) Conduct turning movement counts to improve traffic signal timings 181 109 150 150 6) Conduct traffic studies and signal enhancement 204 172 180 180 7) Design street lighting along all public streets in new residential developments. 100% 100% 100% 100% Landfill
by
and help individuals
Provide
county region. 2021 Results2022 Results2023 Target2024 Target 1) Maintain and/or increase life expectancy of MSW landfill Area 2077 2075 2075 2075 Water
safe, clean and reliable drinking water to
2021 Results2022 Results2023 Target2024 Target 1) Days per year drinking water delivered to customers at adequate volumes 365 365 365 365 2) Number of Safe Drinking Water Act Violations both Federal and State 0000 Water Reclamation Provide uninterrupted wastewater service and maximize sustainability opportunities. 2021 Results2022 Results2023 Target2024 Target 1) Number of permit violations 1000 2) Percentage of collection system cleaned 34% 33% 33% 33% 3) Percentage of collection system inspected 7% 8% 6% 6% 4) Percentage of biosolids recycled and applied to agricultural land 93% 126% 100% 100% 5) Percentage of methane utilized 83% 77% 100% 100% 6) Extraneous flow (gallons per day per inch of diameter mile) Note: (South Dakota recommended design criteria ‐ Chapt II Part F 5) <200 326 339 <200 1) Library Visits (Physical & Virtual) 525,4831,527,5401,500,0002,000,000 2) Percentage of population with a Library Card 39% 40% 42% 40% 3) Circulation Per Capita 7.5 7.4 8.0 8.0 Parks & Recreation Enhance customer service and user satisfaction. 2021 Results2022 Results2023 Target2024 Target 1) Percentage of residents rating city parks as good or excellent 88% NAA 88% 90% 2) Percentage of residents rating recreation programs or classes as good or excellent 80% NAA 80% 85% 3) Percentage of residents rating recreation centers or facilities as good or excellent 81% NAA 81% 85% A ‐ National Community Survey conducted every other year Planning & Development Services Enhance customer experience and provide responsive planning for a well developed city.2021 Results2022 Results2023 Target2024 Target 1) Building permit applications completed online 60% 67% 75% 75% 2) Completion of commercial building plan review 33 days23 days21 days21 days
Continue to provide for disposal of Municipal Solid Waste (MSW) and allow for expansion to continue to accept MSW for 5
Provide
customers.
ACTUAL STATISTICS BY YEAR
SERVICE OUTCOMES & STATISTICS / PAGE 167
2018 2019 2020 2021 2022 City Attorney's Office Magistrate Court Cases for City ordinance violations 905 819 820 843 839 a) number of cases resolved prior to trial 592 547 589 510 564 b) number of cases prepared for trial 313 272 231 333 275 Total retail liquor licenses/retail liquor licenses issued 107 / 2111/6111/0 111/0 130/19 Human Resources Payroll Statements Processed (active and retiree) 53,47454,53451,487 53,872 56,205 Applications 3,0483,249 2,861 2,710 3,237 New Hires and Promotions 133 161 137 210 224 Temporary Employees Hired Not Available864 545 739 767 FTE per 10,000 Population 68 66 67 66 65 Turnover Rate without Retirements 5.15%5.00%4.45% 6.00% 6.77% Turnover Rate with Retirements 7.16%8.41%6.79% 9.80% 9.32% Finance Accounts payable written checks 5,7135,508 4,462 4,102 4,428 Accounts payable electronic checks (ACH) 5,9466,070 6,826 6,615 7,065 General Fund Reserve Percentage (25% target) 32% 32% 35%* 38% 38% Two times debt coverage (pledged) 2.98 3.24 3.10 3.72 4.16 Financial audit completed within 90 days 88 80 78 82 115 *Does not include local gov't assistance grants. Communications CityLink ‐ Total number of finished minutes (City meeting coverage) 10,12511,53810,530 7,338 9,533 YouTube Watch Time (hours) 178,600339,700178,800 71,688 YouTube Subscribers (New Subscribers) 6,60010,100 22,100 23,182 Impressions served (all social accounts/networks) 33,198,37143,661,03327,300,00024,233,936 Engagements (all social accounts/networks) 2,611,8273,458,7561,691,2333,117,404 Post Link Clicks (all social accounts/networks) 65,58147,093 58,764 69,304 Web ‐ Total number of page views 4,255,3604,973,0674,936,1473,245,8723,339,214 Facilities Management Number of facility & preventative maintenance work requests 5,4464,459 4,031 3,245 4,234 Innovation & Technology and Civic Analytics Total number of help desk calls 14,60518,34517,905 18,758 21,711 Digitize and maintain parcel polygons and associated features 59,48560,36461,598 73,848 75,204 Digitize and maintain street centerline and attributes (total miles) 977 995 1,010 1,028 1,100 Digitize and maintain basemap/general features within city limits 78.9 sq miles79.8 sq miles80.1 sq miles81.4 sq miles83 sq miles Collect GPS address points and associated building photos 69,38970,42871,930 63,249 64,099 Planning & Development Services City Population 187,200190,750195,850202,600 208,900 MSA Population 267,293272,500276,730284,800 291,300 City Square Miles 78.9479.81 80.12 81.38 83.34 Annexations 6 9 8 18 23 Rezoning (acres) 1088 1183 414 1835 1573 Preliminary Plans (PP) 8 14 12 17 16 Plats (acres) 1201 1635 1107 1417 1631 Building Permits 6873 7335 7222 7246 11171 Planning Applications 129 116 109 151 126 Housing Neighborhood Revitalization (Units created and sold/leased) 10 10 6 15 5 Single‐Family Housing Rehab (Housing units) 57 57 35 36 111 Rental Rehab (Housing units) 21 21 15 13 12 Emergency Mobile Home Repair (Housing units) 11 11 8 10 8 Bright Futures (Households) 77 94 74 95 87 Tenant‐Based Rental Assistance (Households) 50 68 67 73 68 Rapid Rehousing (Families) 55 117 98 118 127 Home Modification (Rental units made accessible) 53424 Repair Affair (Owner units made accessible) 97878 Mobile Home Self Help N/A 5 2 0 0 Habitat for Humanity ‐ House construction (Homes sold) 45222 Transit Total fixed route passengers 782,129769,437445,205400,692 385,565 Total paratransit passengers 91,40782,63638,288 50,022 54,388 Number of regular routes 12 12 12 12 12 Miles driven ‐ fixed route 747,922746,493660,906667,702 36,316 Miles driven ‐ paratransit 497,412470,058277,513331,757 372,310 Total fixed route buses 26 26 26 26 26 Total paratransit buses 25 25 25 23 21 Transit staffing ‐ full time 97 93 88 89 83 Transit staffing ‐ part time 1 2 1 2 5 Fire Value of property saved after fire exposure ($ in millions) $218.3 M$534.5M$258.9M$492.8M $376.6M Number of fire stations 11 11 11 12 12 Total Fires Incidents 292 264 395 325 345 Residential Fires 116 127 159 143 141 Non‐residential Fires 34 34 50 33 53 Non‐structure Fires (cars, storage, crops, grass, etc.) 142 103 149 139 151 Total Nonfire Incidents 12,57113,34213,988 14,184 15,209 Medical 6,4826,634 7,251 7,487 8,045 False Alarms 1,5281,809 1,661 1,873 2,009 Mutual Aid 93 115 118 73 68 Hazardous Materials 205 199 185 192 218 Other Hazardous Responses 673 858 707 401 454 Other Responses 3,5903,727 4,066 4,160 4,415 Total Incidents 12,85413,60614,345 14,509 15,554 Total fire related casualties 23143 Total civilian injuries related to fire incidents 18 5 3 18 16 Partner with community to increase the number of public access defibrillators 825 768 770 796 825 Building inspections conducted. 3,7002,957 2,466 4,689 5,286 Number of building project plans reviewed. 450 508 903 668 2,459
PAGE 168 / SERVICE OUTCOMES & STATISTICS 2018 2019 2020 2021 2022 Police Number of Sworn Officers 263 269 274 280 284 Number of Civilian Employees 37 37 37 36 37 Calls for Service 122,771125,885127,477128,196 127,089 Aggravated Assaults 600 722 557 517 1,031 Arsons 41 31 47 40 43 Auto Thefts 638 759 1,121 1,337 1,361 Burglaries 682 718 775 819 858 Drunk Driving Arrests 1,009 904 862 870 769 Homicides 8 8 13 5 7 Larcenies 5,0495,321 5,333 5,427 5,847 Rapes 128 121 116 119 90 Robberies 119 98 136 113 169 Traffic Citations Issued 24,60724,32225,282 25,741 23,015 Public Health Clinic Visits: Medical 26,32022,33318,571 20,903 21,223 Clinic Visits: Dental 10,07810,7348,040 9,979 10,064 Clinic Visits: Total 41,55838,44730,571 34,744 32,305 Facility Inspections 3,5393,635 3,260 3,163 3,145 Home Daycare Registrations 254 244 237 232 212 Nuisance Cases Resolved 1,4501,554 1,258 1,155 1,109 Nuisance Property Cleanups 19 12 15 17 23 Vector/Mosquito Control Treatment Sites 16,35713,22012,846 13,942 11,589 NICE/KEEP Clean Up Area‐ total square miles 11212 Siouxland Libraries Estimated Population Served 222,023225,573225,916230,819 241,518 Registered Borrowers 97,122103,84096,842 89,354 87,386 Library Cards Issued 8,2977,959 4,113 7,731 9,775 Library Holdings (Collection) 312,623308,454302,486302,045 310,803 Number of Items Borrowed 2,225,4002,114,8231,381,6681,725,9461,798,496 Computer Uses 162,420159,35341,241 61,955 106,721 Visits 987,246965,247378,302525,483 718,190 Program Attendance 51,98552,23312,010 12,203 31,611 Meeting Room Use 12,75012,8073,343 5,043 11,491 Programs and training opportunities for adults 396 500 104 163 224 Program attendance for adults 5,5136,997 1,431 2,076 4,376 Programs presented for teens 219 169 36 35 70 Program attendance for teens 3,4041,550 370 171 1,020 Programs presented for children 705 497 127 66 155 Program attendance for children 13,07510,9372,833 2,554 6,099 Programs presented for children (Early Literacy) 1,5841,587 298 369 801 Program attendance for children (Early Literacy) 33,20532,7497,376 7,402 20,116 One‐to‐one Programs (tutoring, etc.) 4,5074,195 235 2,047 1,923 A ‐ Overall Libraries attendance and use was
2020
Parks & Recreation Undeveloped Park Acres 364 184 211 219 220 Non‐Park Land Acres Maintained 1,9861,986 1,899 1,893 1,893 Developed Park Acres (not including Golf Courses and Support Sites) 2,4702,633 2,633 2,644 2,644 Developed Parks 80 80 80 81 81 Playground Structures 72 72 74 75 75 Restrooms 48 48 48 55 56 Shelters 65 65 75 75 75 Recreation Trail Miles 30 37 37 37 37 Family Aquatic Centers (outdoor/indoor) 3 / 13 / 13 / 13 / 13 / 1 Traditional Swimming Pools 2 2 2 2 2 Wading Pool 33333 Spray Parks 22223 Athletic Fields (including baseball, softball, soccer, lacrosse, football, rugby) 180 180 181 180 180 Basketball Courts (City‐owned) 65 65 65 65 66 Ice Skating Rinks 66666 Hockey Rinks (outdoor/indoor) 2 / 0 2/0 2/0 2/0 2/0 Tennis Courts 40 40 40 40 48 Recreation Programs Offered for Youth 138 142 90 103 125 Recreation Programs Offered for Adults 75 72 94 104 114 Recreation Programs Offered for Seniors 17 15 9 27 40 Number of family programs 73 51 57 110 110 City Sponsored Athletic Participants 5,3206,215 2,766 5,114 5,935 Non‐City Sponsored Athletic Participants 23,56522,25014,278 23,625 20,435 Aquatics Season Passes Sold at Full Price 5,1415,748 1,705 1,759 1,999 Free Swimming Passes Issued 2,2652,133 235 1,886 1,650 Reduced Swimming Passes Issued 495 656 112 630 744 Value of Free/Reduced Swimming Passes Issued $244,390$254,005$21,940$226,767$203,745 Days Pools Reached Capacity 41 0A 36 Annual Community Center Attendance 204,220192,628129,557149,355 176,555 Shelter Reservation Attendees 55,03662,26972,693 83,692 92,892 Golf Rounds Played 75,85084,40197,351105,400 105,998 Properties Inspected for Tree Ordinance Violations 12,55611,48513,172 10,000 9,950 Properties Brought into Compliance for Tree Ordinance Violations 3,0203,066 3,353 2,500 2,200 Total Department Participation/Attendance 2,768,6552,713,444942,2022,717,0752,549,399 Developed park acres as percentage of city limits area 4.9% 5.2% 5.1% 5.1% 5.0% Total park acres as a percentage city limits area 6.6% 6.6% 6.6% 6.5% 6.4% A ‐ The
B ‐ Overall
down in
due to the pandemic
outdoor pools were not open in 2020 due to the pandemic
Parks attendance and use was down in 2020 due to the pandemic
SERVICE OUTCOMES & STATISTICS / PAGE 169 2018 2019 2020 2021 2022 Highways and Streets Lane miles 3,1573,178 3,253 3,384 3,436 Pothole Requests 2,8585,663 3,994 3,310 1,946 Crack sealing (blocks) 106 252 348 373 247 Surface treatment (blocks) 397 396 436 553 390 Mill and overlay (blocks) 186 186 226 241 209 Street Sweeping (curb miles) 9,5007,90010,354 9,135 10,845 Grates cleaned after storm 1,7481,190 878 1,332 440 Number of Street Sweeping events 3 3 3 3 3 Snow Alerts 77232 Snow Fall (inches) 70.8 56.7 42.8 32.3 20.0 Number of street lights 19,65220,64221,550 21,871 22,480 Number of street lights repaired 2,3022,123 2,482 2,183 1,922 Storm Drainage Acres 1,2301,229 1,231 1,277 1,349 Parcels 327 326 335 352 393 Silt removal (tons) 1,40010,50013,030 43,860 60,820 Inlets cleaned 3,2053,973 3,232 3,911 2,888 Inlets/storm lines/Jetted/cleaned (feet) 479,091564,987479,491495,603 670,256 Storm sewer lines televised (feet) 111,755155,53591,601124,480 132,439 Power and Distribution Number of conductor miles of overhead primary 95 85 82 81 Number of wood poles 4,0613,424 3,400 3,416 3,389 Private accounts 2,3192,407 2,506 2,504 2,522 Governmental accounts 396 512 464 412 409 Kilowatt hours sold 84,859,01483,669,15582,285,60883,870,14583,556,619 Landfill Municipal Solid Waste (tons) 184,996205,957198,496211,669 211,251 Construction & Demolition (tons) 60,80768,25568,349 77,500 118,290 Electronics (lbs.) 1,175,9721,136,1151,047,937946,543 843,246 Household Hazardous Waste Incoming (lbs.) 686,794736,250714,612739,909 760,990 LFG Sales ($) 1,508,275923,688386,285898,1451,272,579 Water Number of metered accounts 56,50057,35958,563 59,763 61,910 Gallons of water treated 7.2 Billion6.9 Billion8.0 Billion8.2 Billion8.2 Billion Water treated in gallons meeting USEPA regulations 7.2 Billion6.9 Billion8.0 Billion8.2 Billion8.2 Billion Water purchased from Lewis & Clark (gallons) 3.9 Billion4.1 Billion3.9 Billion4.4 Billion4.6 Billion Number of wells maintained 66 66 66 66 66 Number of water storage facilities maintained 10 10 10 10 10 Treated water storage capacity in million gallons 27 27 27 27 27 Number of applications for water conservation program 524 257 526 211 164 Estimated water saved in gallons with conservation program 3,060,1022,400,0002,453,7742,075,1172,310,000 Feet of Distribution pipe replaced 20,00015,71918,560 13,981 43,243 Rate adjustment 00000 Water Reclamation Gallons of treated wastewater (million Gallons) 7634 8481 6514 6052 6077 Sanitary sewer collections system (miles) 917 927 941 954 971 Inflow & infiltration gpd/inch diameter mile 814 805 477 339 326 Sanitary sewer lift stations (City owned) 21 21 21 21 21 Gallons of billed flow per capita per day 64.8 63.6 62 61.9 61 Number of customers 549795635957198 58409 59681 Rate adjustment 6.0% 6.0% 6.0% 5.0% 4.0% Public Parking Parking violations issued by the Parking Patrol 34,19033,05425,068 28,662 29,311 Total number of off street public spaces 2,3772,377 2,377 2,967 2,917 Courtesy notices given 5,7677,180 3,676 2,574 2,588
Intentionally Left Blank
PAGE 170
FULLTIME POSITIONS BY DEPARTMENT
FULLTIME POSITIONS BY DEPARTMENT / PAGE 171 Fulltime Positions by Department General Government Mayor 1 5 5 City Council 14 14 City Attorney's Office 1 2 18 18 Human Resources 1 17 1 18 Finance 1 2 31 1 32 Facilities Management 1 28 3 31 Innovation & Technology 1 3 43 4 47 Communications 1 21 21 Total General Government 0 4 10 177 9 186 Public Safety Fire 15 2 228 1 229 Police 5 5 5 326 7 333 Total Public Safety 20 5 7 554 8 562 Highways and Streets Public Works Administration 8 8 Engineering 52 52 Street Maintenance 3 2 51 1 52 Street Lights and Traffic 2 10 10 Storm Drainage and Levee 2 15 1 16 Total Highways and Streets 0 7 2 136 2 138 Public Health 1 0 1 85 85 Culture and Recreation Libraries 1 63 63 Parks & Recreation 1 2 80 1 81 Total Culture and Recreation 0 1 3 143 1 144 Urban and Economic Development Planning & Development Services 2 2 54 2 56 Affordable Housing 1 7 7 Total Urban and Economic Developmen 1 2 2 61 2 63 Enterprise Fleet Management 1 26 26 Power and Distribution 14 14 Public Parking 9 9 Sanitary Landfill/Environmental 1 2 28 28 Water 1 2 1 68 1 69 Water Reclamation 2 1 1 56 1 57 Total Enterprise 4 4 4 201 2 203 Total 26 24 29 1357 24 1381 *Positions added mid-year 2024 New Positions Payroll & Benefits Specialist Financial Coordinator Vehicle Technologist IT Support Specialist IT Analyst Civic Analytics Analyst Urban Planner Building Inspector Captain Training Officer Police Officer (7) Streets Equipment Operator Watershed Maintenance Equipment Operator Park Technician Water Utility Locator Controls Technician Custodian (3) 2023 Current Positions as of 06/01/23 2021 New Positions 2023 New Positions 2022 New Positions 2024 New Positions 2024 Budget
TAKING CARE OF TODAY FOR A BETTER TOMORROW
FIN23_003.indd
