3.2.3 Reserves, Production, and Consumption
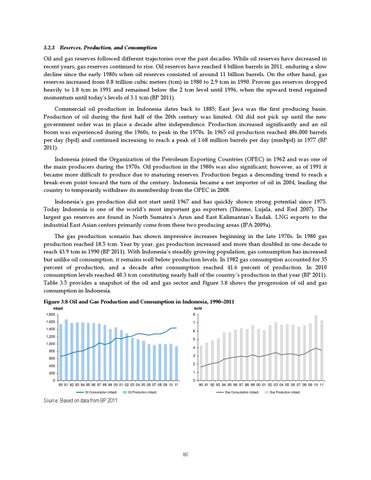
Oil and gas reserves followed different trajectories over the past decades. While oil reserves have decreased in recent years, gas reserves continued to rise. Oil reserves have reached 4 billion barrels in 2011, enduring a slow decline since the early 1980s when oil reserves consisted of around 11 billion barrels. On the other hand, gas reserves increased from 0.8 trillion cubic meters (tcm) in 1980 to 2.9 tcm in 1990. Proven gas reserves dropped heavily to 1.8 tcm in 1991 and remained below the 2 tcm level until 1996, when the upward trend regained momentum until today's levels of 3.1 tcm (BP 2011). Commercial oil production in Indonesia dates back to 1885; East Java was the first producing basin. Production of oil during the first half of the 20th century was limited. Oil did not pick up until the new government order was in place a decade after independence. Production increased significantly and an oil boom was experienced during the 1960s, to peak in the 1970s. In 1965 oil production reached 486,000 barrels per day (bpd) and continued increasing to reach a peak of 1.68 million barrels per day (mmbpd) in 1977 (BP 2011). Indonesia joined the Organization of the Petroleum Exporting Countries (OPEC) in 1962 and was one of the main producers during the 1970s. Oil production in the 1980s was also significant; however, as of 1991 it became more difficult to produce due to maturing reserves. Production began a descending trend to reach a break-even point toward the turn of the century. Indonesia became a net importer of oil in 2004, leading the country to temporarily withdraw its membership from the OPEC in 2008. Indonesia’s gas production did not start until 1967 and has quickly shown strong potential since 1975. Today Indonesia is one of the world’s most important gas exporters (Thieme, Lujala, and Rød 2007). The largest gas reserves are found in North Sumatra’s Arun and East Kalimantan’s Badak. LNG exports to the industrial East Asian centers primarily come from these two producing areas (IPA 2009a). The gas production scenario has shown impressive increases beginning in the late 1970s. In 1980 gas production reached 18.5 tcm. Year by year, gas production increased and more than doubled in one decade to reach 43.9 tcm in 1990 (BP 2011). With Indonesia’s steadily growing population, gas consumption has increased but unlike oil consumption, it remains well below production levels. In 1982 gas consumption accounted for 35 percent of production, and a decade after consumption reached 41.6 percent of production. In 2010 consumption levels reached 40.3 tcm constituting nearly half of the country’s production in that year (BP 2011). Table 3.5 provides a snapshot of the oil and gas sector and Figure 3.8 shows the progression of oil and gas consumption in Indonesia. Figure 3.8 Oil and Gas Production and Consumption in Indonesia, 1990–2011 mbpd
bcfd
1,800
8
1,600
7
1,400
6
1,200
5
1,000 4 800 3
600
2
400
1
200 0
0
90 91 92 93 94 95 96 97 98 99 00 01 02 03 04 05 06 07 08 09 10 11 Oil Consumption (mbpd)
90 91 92 93 94 95 96 97 98 99 00 01 02 03 04 05 06 07 08 09 10 11
Oil Production (mbpd)
Gas Consumption (mbpd)
Source: Based on data from BP 2011.
80
Gas Production (mbpd)