88
Innovation Policy for Competitiveness
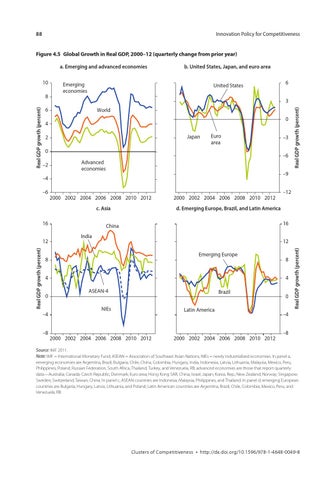
Figure 4.5 Global Growth in Real GDP, 2000–12 (quarterly change from prior year) a. Emerging and advanced economies
United States
3
6
World 0
4 Japan
2
Euro area
0 –2
–9
2000 2002 2004 2006 2008 2010 2012 c. Asia
16
Real GDP growth (percent)
12
2000 2002 2004 2006 2008 2010 2012
16
China India
12 Emerging Europe
4
–4 –8
–12
d. Emerging Europe, Brazil, and Latin America
8
0
–3 –6
Advanced economies
–4 –6
6
Real GDP growth (percent)
Real GDP growth (percent)
8
Emerging economies
8 4
ASEAN-4
Brazil
NIEs
Latin America
2000 2002 2004 2006 2008 2010 2012
2000 2002 2004 2006 2008 2010 2012
0
Real GDP growth (percent)
10
b. United States, Japan, and euro area
–4 –8
Source: IMF 2011. Note: IMF = International Monetary Fund; ASEAN = Association of Southeast Asian Nations; NIEs = newly industrialized economies. In panel a, emerging economies are Argentina, Brazil, Bulgaria, Chile, China, Colombia, Hungary, India, Indonesia, Latvia, Lithuania, Malaysia, Mexico, Peru, Philippines, Poland, Russian Federation, South Africa, Thailand, Turkey, and Venezuela, RB; advanced economies are those that report quarterly data—Australia; Canada; Czech Republic; Denmark; Euro area; Hong Kong SAR, China; Israel; Japan; Korea, Rep.; New Zealand; Norway; Singapore; Sweden; Switzerland; Taiwan, China. In panel c, ASEAN countries are Indonesia, Malaysia, Philippines, and Thailand. In panel d, emerging European countries are Bulgaria, Hungary, Latvia, Lithuania, and Poland; Latin American countries are Argentina, Brazil, Chile, Colombia, Mexico, Peru, and Venezuela, RB.
Clusters of Competitiveness • http://dx.doi.org/10.1596/978-1-4648-0049-8