28
A World Bank Study
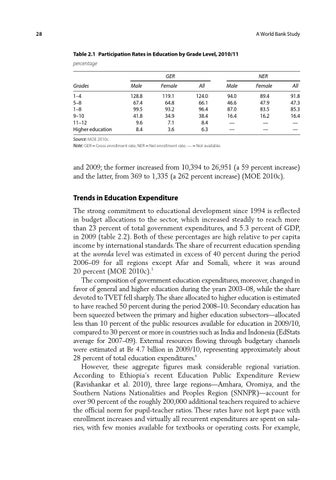
Table 2.1 Participation Rates in Education by Grade Level, 2010/11 percentage GER
NER
Grades
Male
Female
All
Male
Female
All
1–4 5–8 1–8 9–10 11–12 Higher education
128.8 67.4 99.5 41.8 9.6 8.4
119.1 64.8 93.2 34.9 7.1 3.6
124.0 66.1 96.4 38.4 8.4 6.3
94.0 46.6 87.0 16.4 — —
89.4 47.9 83.5 16.2 — —
91.8 47.3 85.3 16.4 — —
Source: MOE 2010c. Note: GER = Gross enrollment rate; NER = Net enrollment rate; — = Not available.
and 2009; the former increased from 10,394 to 26,951 (a 59 percent increase) and the latter, from 369 to 1,335 (a 262 percent increase) (MOE 2010c).
Trends in Education Expenditure The strong commitment to educational development since 1994 is reflected in budget allocations to the sector, which increased steadily to reach more than 23 percent of total government expenditures, and 5.3 percent of GDP, in 2009 (table 2.2). Both of these percentages are high relative to per capita income by international standards. The share of recurrent education spending at the woreda level was estimated in excess of 40 percent during the period 2006–09 for all regions except Afar and Somali, where it was around 20 percent (MOE 2010c).5 The composition of government education expenditures, moreover, changed in favor of general and higher education during the years 2003–08, while the share devoted to TVET fell sharply. The share allocated to higher education is estimated to have reached 50 percent during the period 2008–10. Secondary education has been squeezed between the primary and higher education subsectors—allocated less than 10 percent of the public resources available for education in 2009/10, compared to 30 percent or more in countries such as India and Indonesia (EdStats average for 2007–09). External resources flowing through budgetary channels were estimated at Br 4.7 billion in 2009/10, representing approximately about 28 percent of total education expenditures.6 However, these aggregate figures mask considerable regional variation. According to Ethiopia’s recent Education Public Expenditure Review (Ravishankar et al. 2010), three large regions—Amhara, Oromiya, and the Southern Nations Nationalities and Peoples Region (SNNPR)—account for over 90 percent of the roughly 200,000 additional teachers required to achieve the official norm for pupil-teacher ratios. These rates have not kept pace with enrollment increases and virtually all recurrent expenditures are spent on salaries, with few monies available for textbooks or operating costs. For example,