82
World Bank Working Paper
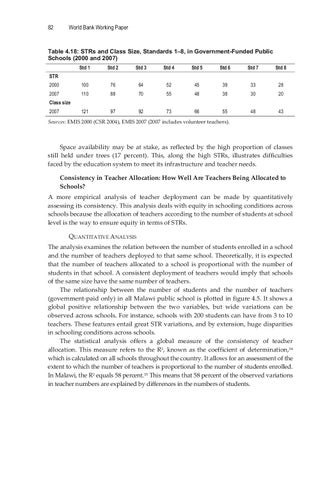
Table 4.18: STRs and Class Size, Standards 1–8, in Government-Funded Public Schools (2000 and 2007) Std 1
Std 2
Std 3
Std 4
Std 5
Std 6
Std 7
Std 8
2000
100
76
64
52
45
39
33
28
2007
110
88
70
55
48
38
30
20
121
97
92
73
66
55
48
43
STR
Class size 2007
Sources: EMIS 2000 (CSR 2004), EMIS 2007 (2007 includes volunteer teachers).
Space availability may be at stake, as reflected by the high proportion of classes still held under trees (17 percent). This, along the high STRs, illustrates difficulties faced by the education system to meet its infrastructure and teacher needs. Consistency in Teacher Allocation: How Well Are Teachers Being Allocated to Schools? A more empirical analysis of teacher deployment can be made by quantitatively assessing its consistency. This analysis deals with equity in schooling conditions across schools because the allocation of teachers according to the number of students at school level is the way to ensure equity in terms of STRs. QUANTITATIVE ANALYSIS The analysis examines the relation between the number of students enrolled in a school and the number of teachers deployed to that same school. Theoretically, it is expected that the number of teachers allocated to a school is proportional with the number of students in that school. A consistent deployment of teachers would imply that schools of the same size have the same number of teachers. The relationship between the number of students and the number of teachers (government paid only) in all Malawi public school is plotted in figure 4.5. It shows a global positive relationship between the two variables, but wide variations can be observed across schools. For instance, schools with 200 students can have from 3 to 10 teachers. These features entail great STR variations, and by extension, huge disparities in schooling conditions across schools. The statistical analysis offers a global measure of the consistency of teacher allocation. This measure refers to the R2, known as the coefficient of determination,34 which is calculated on all schools throughout the country. It allows for an assessment of the extent to which the number of teachers is proportional to the number of students enrolled. In Malawi, the R2 equals 58 percent.35 This means that 58 percent of the observed variations in teacher numbers are explained by differences in the numbers of students.