11984-08_Annex1.qxd
3/4/10
12:52 PM
Page 112
112 World Bank Working Paper
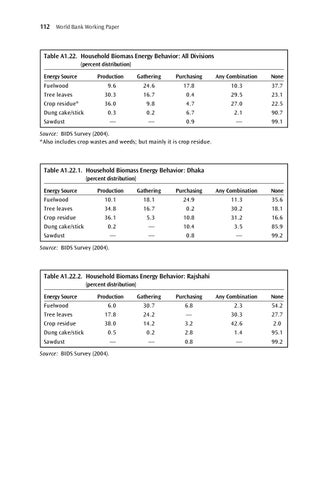
Table A1.22. Household Biomass Energy Behavior: All Divisions (percent distribution) Energy Source Fuelwood Tree leaves Crop residue* Dung cake/stick Sawdust
Production 9.6 30.3 36.0 0.3 —
Gathering 24.6 16.7 9.8 0.2 —
Purchasing 17.8 0.4 4.7 6.7 0.9
Any Combination 10.3 29.5 27.0 2.1 —
None 37.7 23.1 22.5 90.7 99.1
Any Combination 11.3 30.2 31.2 3.5 —
None 35.6 18.1 16.6 85.9 99.2
Any Combination 2.3 30.3 42.6 1.4 —
None 54.2 27.7 2.0 95.1 99.2
Source: BIDS Survey (2004). *Also includes crop wastes and weeds; but mainly it is crop residue.
Table A1.22.1. Household Biomass Energy Behavior: Dhaka (percent distribution) Energy Source Fuelwood Tree leaves Crop residue Dung cake/stick Sawdust
Production 10.1 34.8 36.1 0.2 —
Gathering 18.1 16.7 5.3 — —
Purchasing 24.9 0.2 10.8 10.4 0.8
Source: BIDS Survey (2004).
Table A1.22.2. Household Biomass Energy Behavior: Rajshahi (percent distribution) Energy Source Fuelwood Tree leaves Crop residue Dung cake/stick Sawdust
Production 6.0 17.8 38.0 0.5 —
Source: BIDS Survey (2004).
Gathering 30.7 24.2 14.2 0.2 —
Purchasing 6.8 — 3.2 2.8 0.8