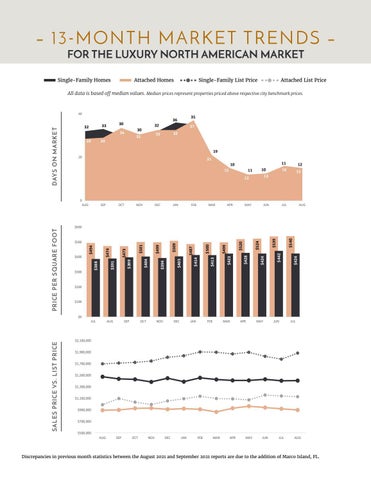
– 13 - MONTH MARKET TRENDS – FOR THE LUXURY NORTH AMERICAN MARKET
Single-Family Homes
Attached Homes
Single-Family List Price
Attached List Price
All data is based off median values. Median prices represent properties priced above respective city benchmark prices.
33
32
19 20
21
10
15
SEP
OCT
NOV
DEC
JAN
FEB
MAR
APR
11 16
10 13
11 12
MAY
JUN
12 15
JUL
AUG
$540 $424
$539 $442
$524 $424
$520 $428
$499 $423
$413
$414
$487
$509 $405
$499
$473
$501 $404
$394
$300
$399
$474
$400
$494
$500
$500
$600
$388
PRICE PER SQUARE FOOT
37 33
33
31
29
29
35
36
32
30
34
0 AUG
$200
$100
$0
SALES PRICE VS. LIST PRICE
30
$391
DAYS ON MARKET
40
JUL
AUG
SEP
OCT
NOV
DEC
JAN
FEB
MAR
APR
MAY
JUN
JUL
$2,100,000 $1,900,000 $1,700,000 $1,500,000 $1,300,000 $1,100,000 $900,000 $700,000 $500,000
AUG
SEP
OCT
NOV
DEC
JAN
FEB
MAR
APR
MAY
JUN
JUL
AUG
Discrepancies in previous month statistics between the August 2021 and September 2021 reports are due to the addition of Marco Island, FL.