EXPLORING MORTGAGE TRENDS IN CALIFORNIA: Charting Lending Patterns in California Communities Using NCRC’s 2018 – 2020 Fair Lending Tool and 2021 Home Mortgage Disclosure Act Data

Jamie Buell, Research Analyst
Kevin Stein, Chief of Legal and Strategy
The racial gap in homeownership rates is historically high—and the chasm stands to widen due to preexisting wealth inequities, the COVID-19 pandemic and the subsequent economic fallout. Available affordable housing stock lags far behind what is needed while foreclosure rates continue to be a disproportionate threat to low-and-moderate income (LMI) communities and particularly Black, Indigenous and other people of color (BIPOC)1 homeowners. Financial policy and programs should be proactive in addressing the looming issues associated with rising interest rates and inflation.
The Home Mortgage Disclosure Act (HMDA) was passed in 1975 and “requires many financial institutions to maintain, report, and publicly disclose loan-level information about mortgages”. It has been under the federal Consumer Financial Protections Bureau’s (CFPB’s) rulemaking authority since 2010s Dodd-Frank Wall Street Reform and the Consumer Protection Act of 2010 (the Dodd-Frank Act), and is implemented by Regulation C. HMDA data is crucial to understanding gaps or inequities in the mortgage space; whether it be potential steering of borrowers into higher cost mortgages, higher rates of denials, or inequitable lending to LMI and majority-minority communities. The National Community Reinvestment Coalition’s (NCRC) Fair Lending Tool2 aggregates data from the HMDA as well as population data from the U.S. Census.
In addition to HMDA, the Federal Community Reinvestment Act (CRA) is another crucial way to hold financial institutions accountable for their ability to meet the credit and financial needs of low-to-moderate income (LMI) individuals and communities. Signed in 1977, the CRA was passed to respond to systemic discrimination and denial of credit for borrowers and communities of color and low-to-moderate income communities. The legislation is helpful in multiple ways. First, it encourages certain types of lending and investment banks should be doing in LMI communities. Second, it calls for routine performance evaluations of financial institutions. And, lastly, it enables community input in CRA exams and mergers. The federal CRA, however, falls short in its race-neutral approach and its exemption of nonbank lenders like mortgage companies, which are fastly becoming the majority of the mortgage market. Furthermore, financial institutions rarely fail their performance evaluations, and face few penalties or downgrades for their harms to communities. Advocates and community groups therefore must take analysis and scrutiny of financial institutions step further to fully vet banks’ and other financial institutions’ conduct in their communities.
This report will first look at this combined longitudinal data on lending trends between 2018 – 2020. We then add our own analysis of 2021 HMDA data to illustrate trends influenced by long-standing issues in the financial services sector, and to shed light on new trends that may have arisen during the COVID-19 pandemic.
An analysis across institution types is critical to understanding any inequities and targeted solutions. For this analysis, we compared lending by different institution types: state and federally chartered banks, independent mortgage companies, and credit unions. We pay special attention to independent mortgage companies, and how their presence in the mortgage market has increased, particularly among BIPOC and LMI homebuyers.
This retrospective HMDA analysis across institution types will provide a foundation of historical trends which we will build upon with a consequential series of more in-depth publications, discussing topics like denial and fallout rates among Asian and Hispanic disaggregated nationalities, lending patterns among specific institutions, and analysis of soon-to-be-released 2022 HMDA data.
1 CRC uses the term “BIPOC” as nomenclature to refer to Black, Indigenous, Hispanic/Latine, Asian, and other people of color. It is not the intention to reduce these groups to a singular experience or homogenous group. All included racial groups and nationalities have their own economic condition and issues faced, and the combined acronym does not mean to suggest the experiences and economic conditions are the same.
2 NCRC’s Fair Lending Tool includes information about denial rates and reasons, small business lending, and bank branches. The Fair Lending Tool offers the ability to filter by Metropolitan Statistical Area, loan purpose, and lender type. The tool is available to NCRC members. For more information, visit https://ncrc.org/ncrc-launches-interactive-tool-to-explore-local-lending-patterns/
Exploring Mortgage Trends in California 2
KEY FINDINGS
¤ The COVID-19 pandemic’s rippling impact on supply chains, income inequality, historic high-interest rates, and investor ownership of housing will likely continue in 2023.
¤ A housing market inaccessible to the average Californian has created a vacuum for corporations and private equity to continue their consolidation of the available housing stock, fueling displacement and a cycle of lack of affordability and availability.
¤ Independent mortgage companies more often than other institutions originate their loans online, and as a result, a greater proportion of their loans are missing race data. This obstructs an accurate view of their lending patterns.
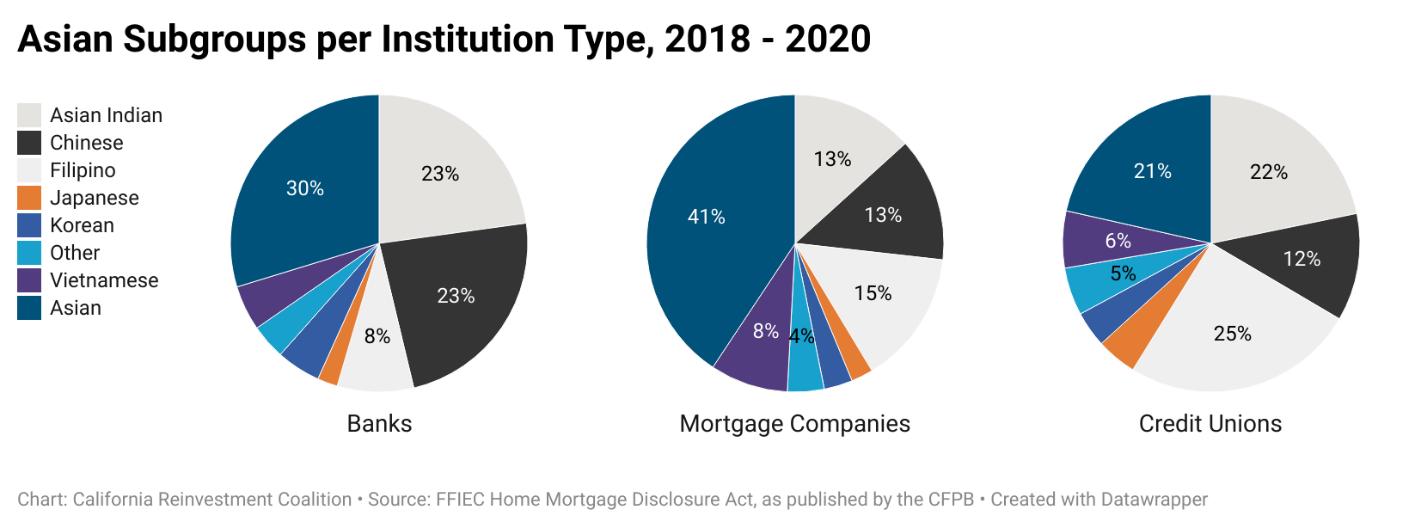
¤ Credit unions had the highest number of Asian and Hispanic borrowers reporting a subgroup of national origin.
¤ Mortgage companies and credit unions have a larger percentage of their originations going to BIPOC borrowers, especially among their government-insured lending portfolio.
¤ Banks almost exclusively originate conventional loans, while independent mortgage companies and credit unions provide more government-insured loans.
¤ Government-insured loans, while playing an important role in the mortgage market, are associated with higher closing costs.
¤ Independent mortgage companies’ government lending needs higher scrutiny. Questions arise regarding the potential steering of conventional loan-qualifying borrowers of color into higher-cost government-insured loans.
¤ Federal CRA ratings and performance evaluations are negligent of the full scope of potential discrimination and redlining behavior perpetrated by banks.
KEY RECOMMENDATIONS
Federal Community Reinvestment Act (CRA) rules and laws must include:
¤ A race-conscious analysis of whether financial institutions are meeting the credit needs of BIPOC borrowers and communities.
¤ Greater incentives for banks to offer race-conscious financial relief and products, such as special-purpose credit programs.
¤ More robust fair housing and fair lending exams in CRA performance evaluations to evaluate disparities in closing costs, steering of protected classes into higher cost products instead of others they could qualify for, and loans that foreseeably lead to the displacement of protected classes of residents. This type of potential steering raises discrimination concerns and therefore must be rigorously examined in fair housing and fair lending evaluations.
¤ Coverage and regulation of independent mortgage companies and credit unions.
HMDA rules and enforcement should:
¤ Promote more robust reporting of race and ethnicity among all borrowers.
¤ Lower reporting thresholds for lending institutions to prior levels.
Exploring Mortgage Trends in California 3
¤ Include a field for language preferred and spoken by applicants.
¤ Include a data field on whether or not the borrower is a corporate or LLC borrower.
Financial institutions should:
¤ Create special purpose credit programs to make homeownership for first-time borrowers more affordable and accessible.
¤ Offer Fannie Mae’s HomeReady mortgage, Freddie Mac’s HomeOne or HomePossible mortgage, products created for first time homebuyers.
¤ Adopt CRC’s Anti-Displacement Code of Conduct to stop the financing of problematic landlords and real estate companies, and the acceleration of displacement and gentrification.
The State of California should:
¤ Pass a state level Community Reinvestment Act which is race-conscious, ensures robust regulation and oversight, and extends coverage to institutions ignored by federal CRA – i.e., independent mortgage companies, state chartered credit unions, and financial technology companies.
¤ Foster housing co-ops, community land trusts, and shared equity models as an affordable entry in homeownership and long term solution to housing instability.
¤ Implement a public registry of beneficial ownership information so that policymakers, code enforcement officials, and residential and commercial tenants know who their landlords are.
¤ Invest a larger sum into CalHFA Loan, a state-level affordable housing lender, to make mortgage financing more accessible to a larger number of LMI Californians.
An Introduction to the Current Landscape of Lending and Homeownership in California
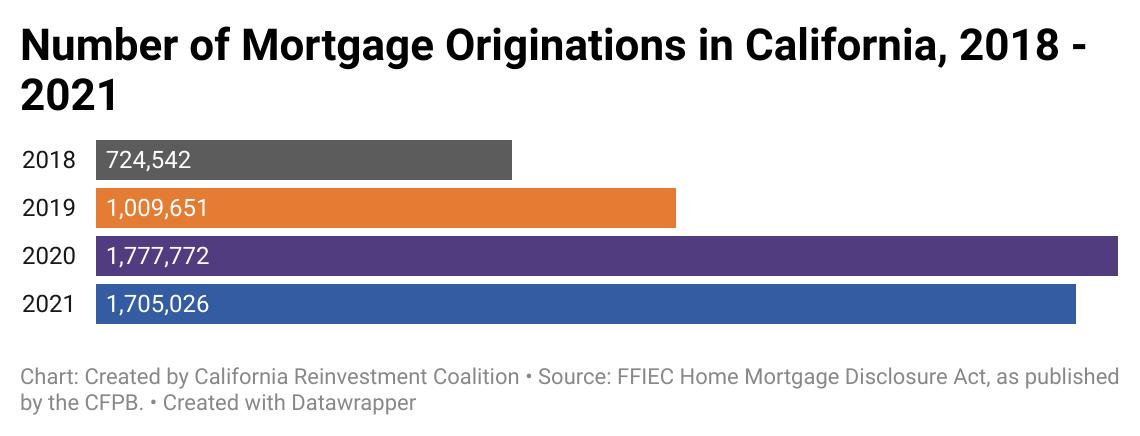
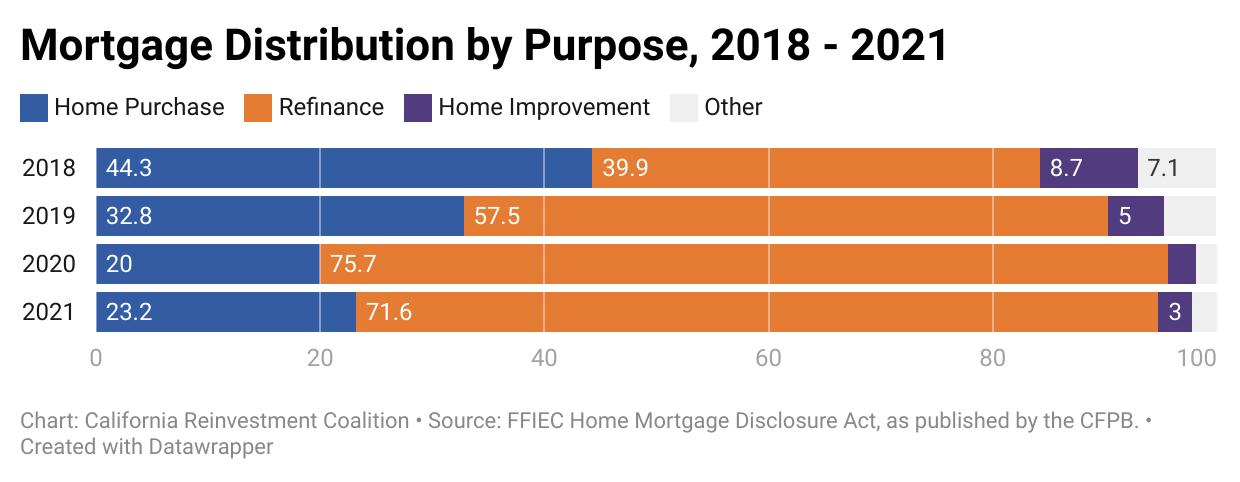
The skyrocketing amount of home loan originations in 2020 is well-documented. With record-low interest rates, millennials entering their prime homebuying years, remote work offering the opportunity to relocate to affordable markets, and direct cash infusions via stimulus payments, homebuying became uniquely affordable in spite of a global crisis. Mortgage lending in California mirrored national trends, with 768,121 more loan originations in 2020 than in 2019.
This increase in originations was particularly driven by a refinance boom. Existing homeowners capitalized at a time of record low-interest rates to refinance their mortgages, thus saving more on their monthly payments to decrease their debt. Others also recognized the historic economic opportunity to purchase a home, especially homes with “pandemic-friendly” amenities such as outdoor space and home office
Exploring Mortgage Trends in California 4
that became exceptionally affordable, and may pay off in future increased value. Amenities or not, wealth gained from new or refinanced homeownership during 2020 and 2021 has already illustrated its payoff. The Federal Reserve estimates that the total equity in real estate gained at the end of Q1 2022 was nearly $4.7 trillion greater than in the previous year; and in Q1 2021, equity gained was over $3 trillion greater than the cumulative value in Q1 2020. For context, from Q1 2013 to Q1 2020, the largest increase in year-over-year (YOY) equity per quarter increase was $1.86 trillion.
The benefits gained from 2020 and 2021’s unique housing market were not equal, however. Those who were most in need of attaining or leveraging the asset of homeownership were not able to benefit in large numbers from the record-low rate mortgage market. Additionally, those that did enter the housing market later, like in the second half of 2021 or in 2022, are already finding higher monthly costs. Corelogic finds that homebuyers who used FHA loans in the second half of 2021 – who were more likely Black, Latine, and Asian subgroups like Filipino – made monthly mortgage payments that were 19.7% higher than before the pandemic. Comparatively, those who used an FHA loan in the second half of 2020 made monthly mortgage payments that were 9.3% higher than pre-pandemic averages. Conventional loans, on the contrary, have experienced modest increases from pre-pandemic prices, as conventional mortgage borrowers made monthly mortgage payments that were 3.3% higher in the second half of 2021 compared to pre-pandemic times.
Exploring Mortgage Trends in California 5
The uniquely hot housing market during the pandemic has certainly cooled during 2022. Home values continue to rise, yet interest rates continually increase – reaching about 7% for both a conventional and an FHA loan in September 2022. California’s first-time homebuyer affordability index for single-family homes has declined 9 percentage points from Q1 2022 to Q2 2022 alone, with similar trends experienced at the county level. Correlated with rising home prices is an increase in down payment costs. In California metro areas like San Diego, Sacramento, and Anaheim, median down payment amounts have increased between 11 to almost 18% in one year. Many of California’s metro areas were ranked the least affordable markets in August 2022, with Los Angeles being the most unaffordable: in LA, 72% of the median family income would go toward monthly principal and interest payments on an average-priced home.
WHEN THE TYPICAL HOUSEHOLD IS PRICED OUT, CORPORATE LANDLORDS WILL CONTINUE TO REAP THE BENEFITS
As homeownership grows increasingly unaffordable, those who should be theoretically growing into their homebuying years are increasingly becoming incapable of purchasing. Millennials, who are aging into their prime homebuying years, are left with no choice but to be long-term renters. This age cohort has the highest rate of rentership of all generations, at 27%, and is unable to afford rent in California, let alone a mortgage. There is a 40% gap between California’s median rent for a 1 bedroom and what the typical millennial can afford. Los Angeles has the largest millennial renter wage gap in the whole nation, with the median millennial renter wage nearly 50% less than the annual wage needed to afford a 1 bedroom apartment. Furthermore, in 2021, nearly two-thirds of millennials reported not having any savings, making them further incapable of meeting the steeper prices of down payments.
Though the long-term wealth implications of delayed – or unachieved – homeownership for millennials still remain to be seen, the Urban Institute had previously estimated that those who bought their first home between ages 25 and 34 had the greatest amount of wealth by their sixties. Accessing homeownership is crucial for building intergenerational wealth, and doing so early proves most advantageous for families and their descendants.
With homeownership becoming increasingly unaffordable for the average Californian family, corporate investors are capitalizing on the opportunity to consolidate the market. From the beginning of 2000 to the end of 2021, investor purchases increased by 227%. Some of California’s biggest metros averaged about 20% of all purchases in Q2 2022 by investors. In Q4 2021 alone, three-quarters of all national investor home purchases were paid in all cash. Similarly, three-quarters of investor purchases nationally in Q4 2021 were single-family homes. With larger liquidity on hand and more capability to pay above asking price – a trend that peaked during mid- 2021 and early 2022 – corporate investors may be more capable of outbidding and pricing out average families. The National Association of Realtors finds that corporate investors represented 15% of all single-family purchases in 2021, and were more likely to purchase in markets with a high density of renters, millennials, minority groups, and fast home appreciation, further accelerating the trend of homeownership becoming unaffordable and inaccessible for those who deserve to access the asset of a home.
Exploring Mortgage Trends in California 6
2018 – 2020 HISTORICAL HMDA FINDINGS USING NCRC’S FAIR LENDING TOOL
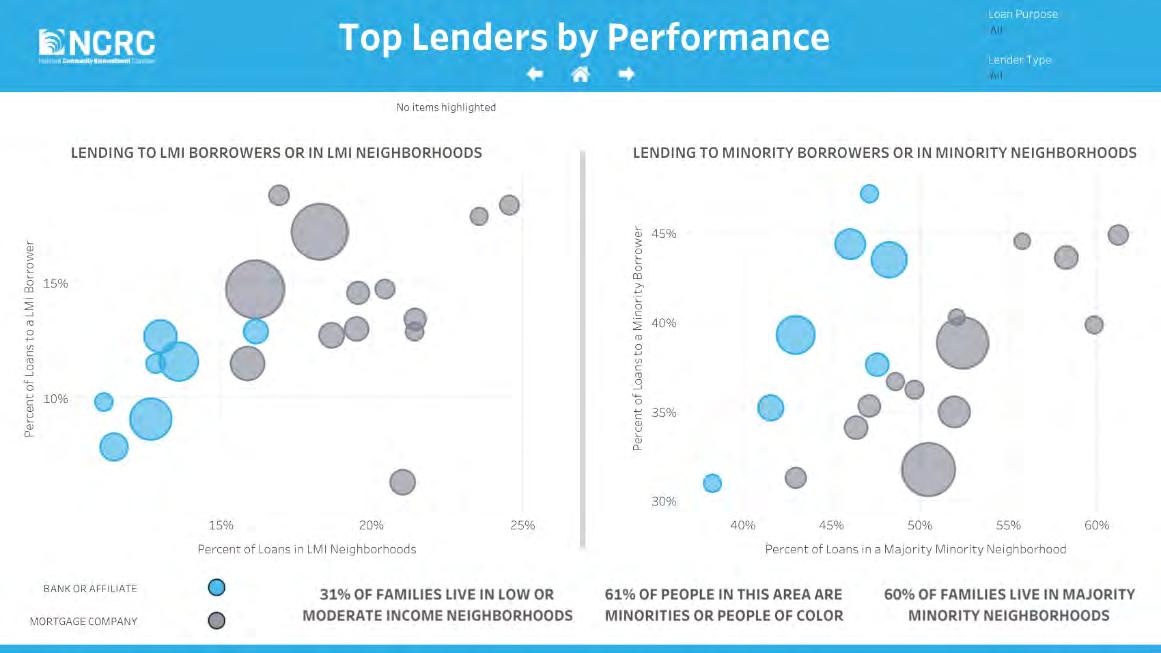
The National Community Reinvestment Coalition (NCRC) offers an interactive tool called the Fair Lending Report for its members. The tool collects and analyzes data of financial institutions’ small business lending, mortgage lending, and bank branch locations. A unique and crucial function of NCRC’s Fair Lending Report is its ability to compare lending patterns across institution types – i.e. banks, credit unions, and independent mortgage companies – and with local population demographics. The data analysis is available at the national, state, and city levels. Additionally, using quantitative HMDA data is critical for local advocates to understand how financial institutions are serving their communities, yet data analysis is often not accessible or feasible for local nonprofits and advocates whose capacity and funding could be stretched thin. An interactive tool that compiles and analyzes complicated data is an important way to empower local groups and advocates with information to support local causes.
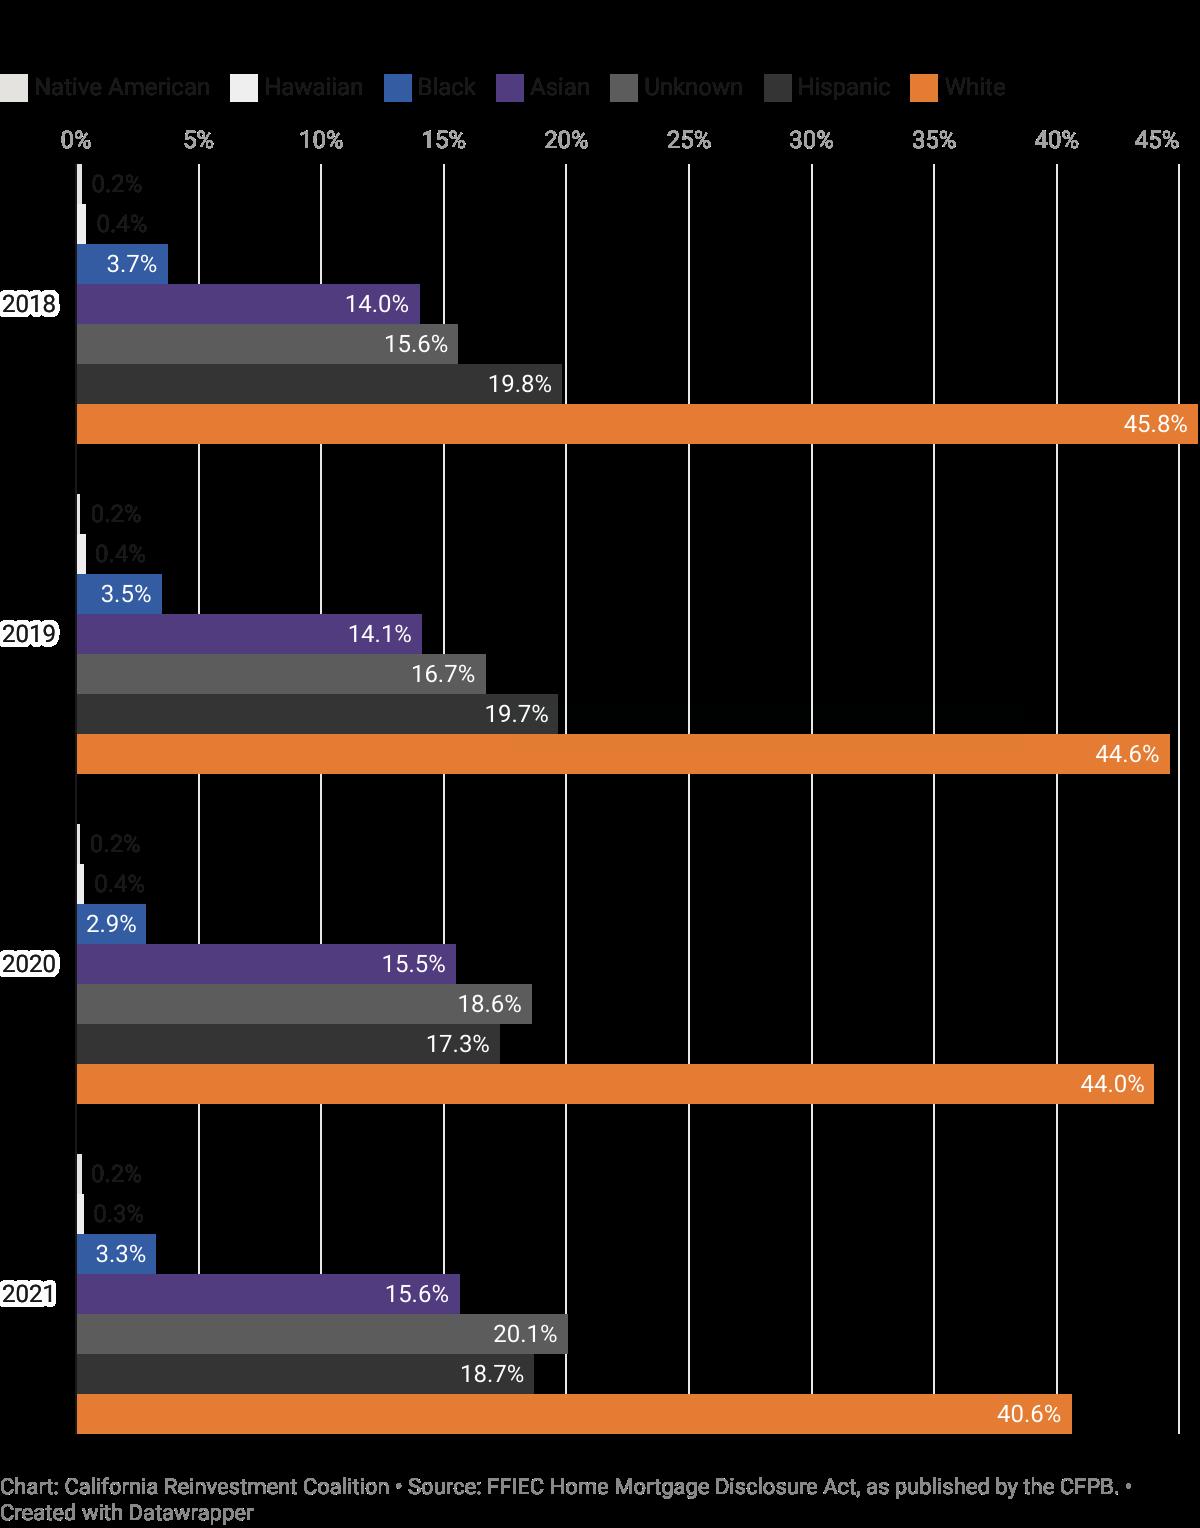
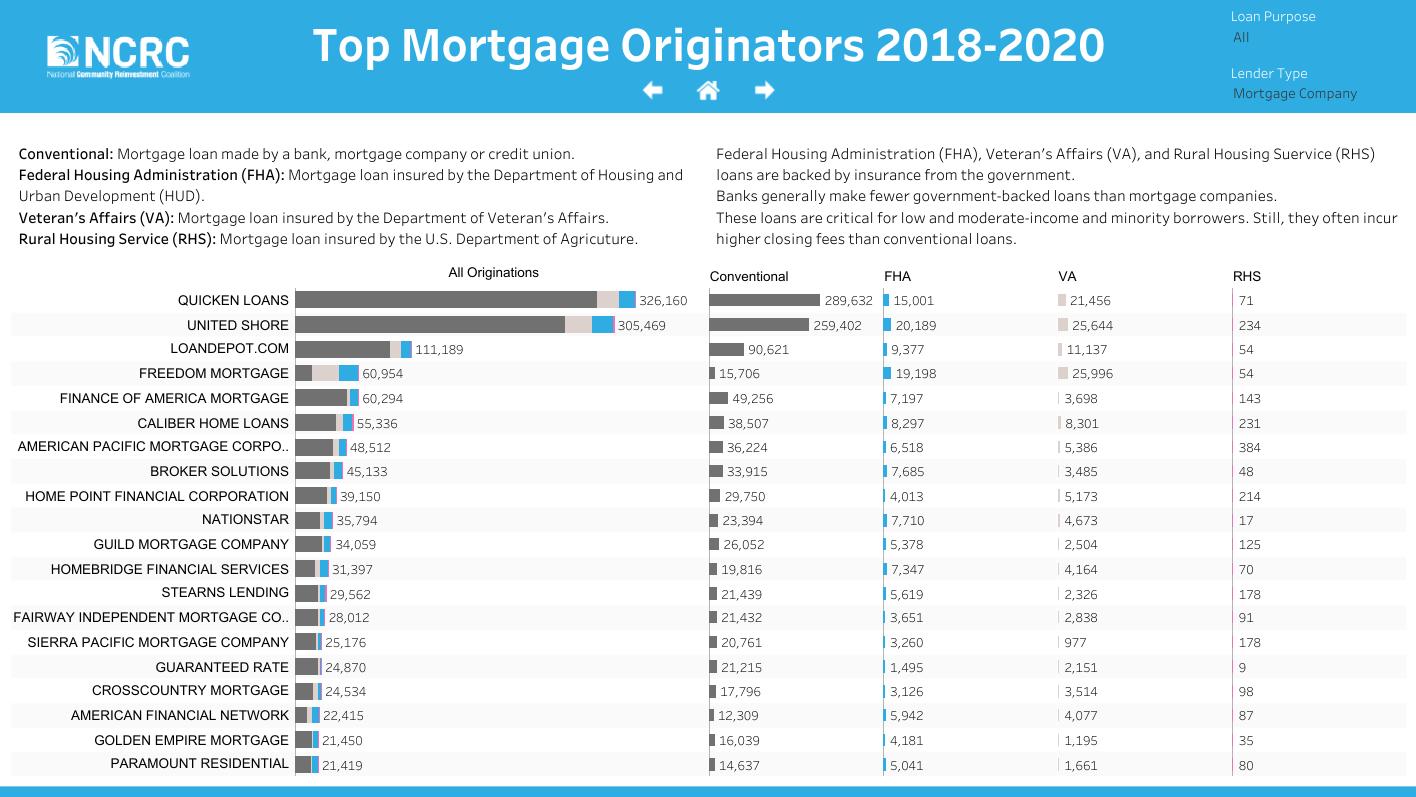
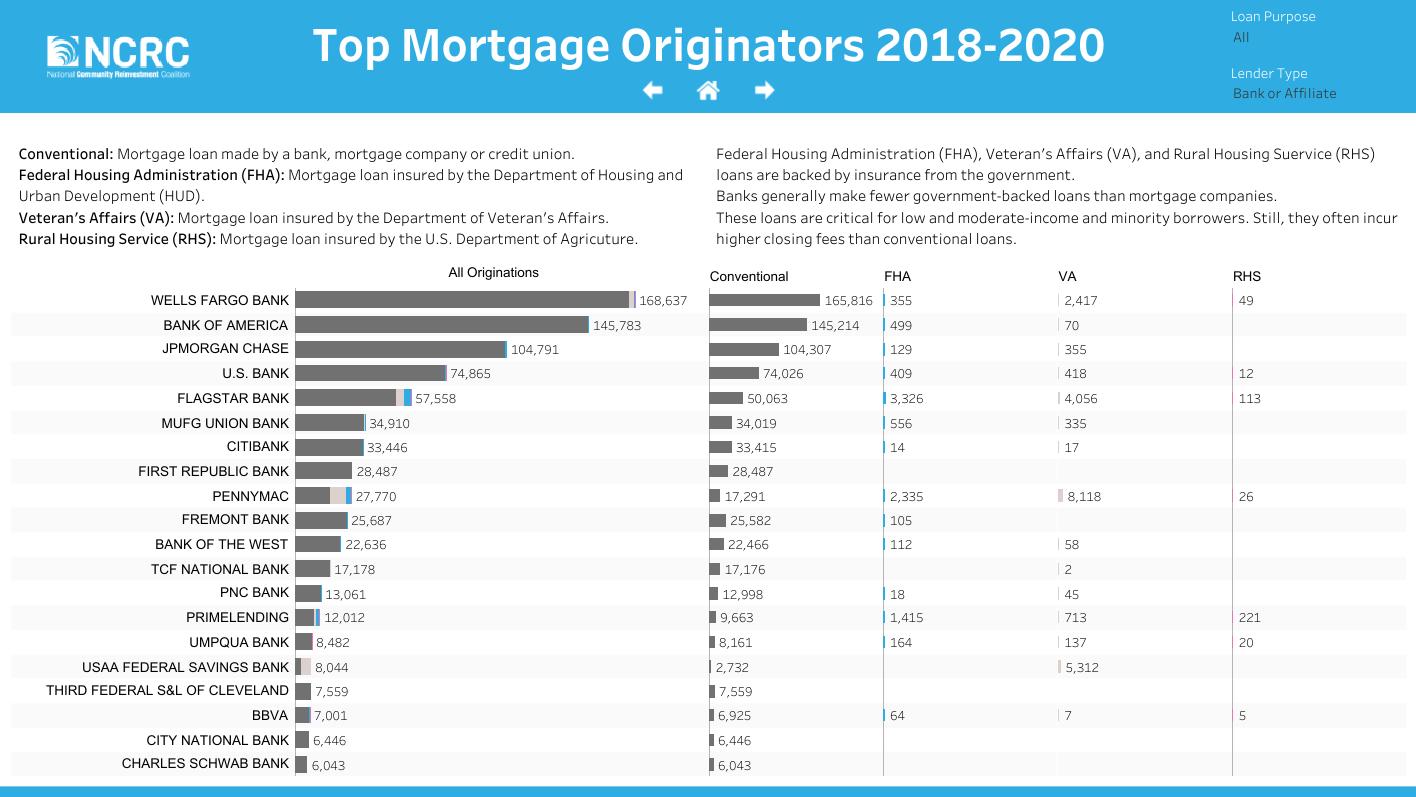
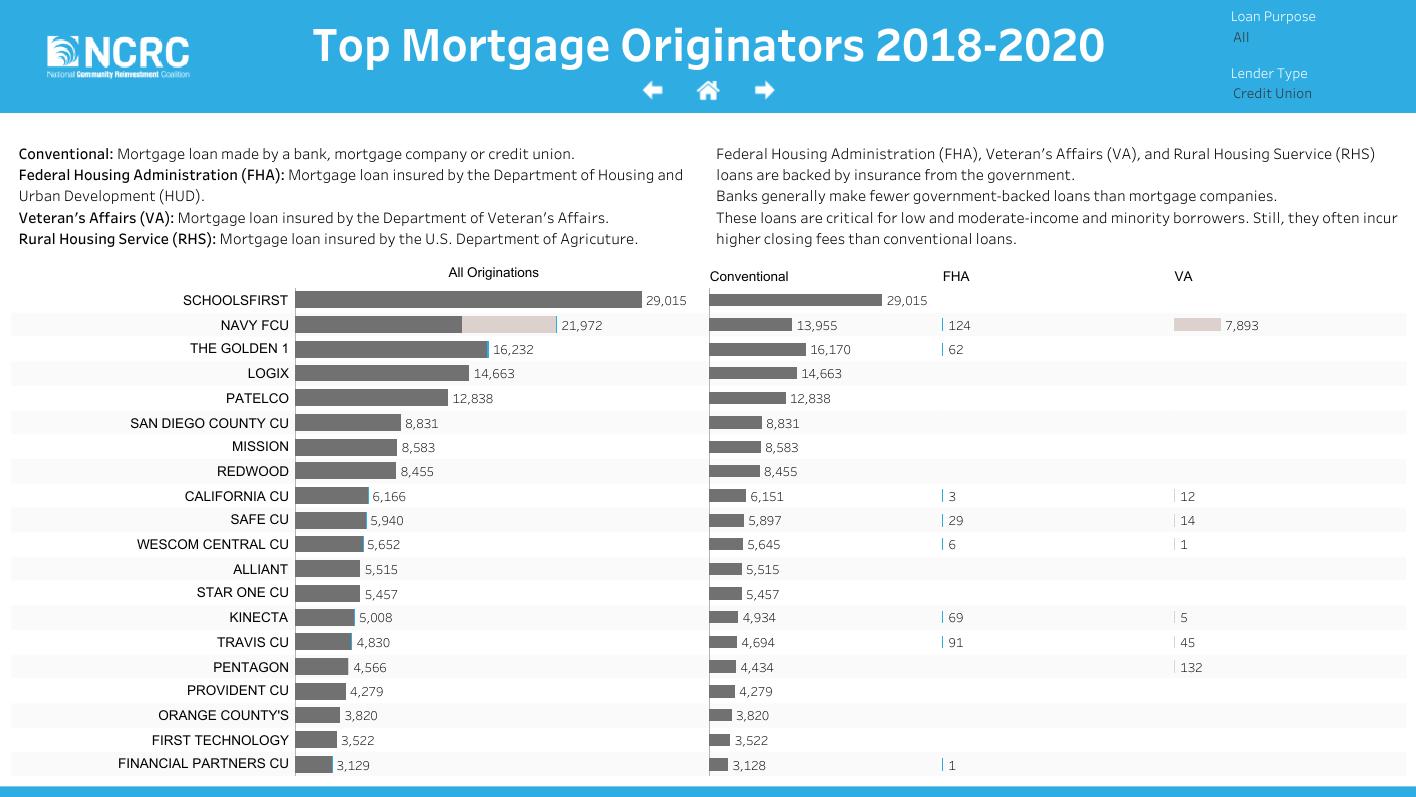
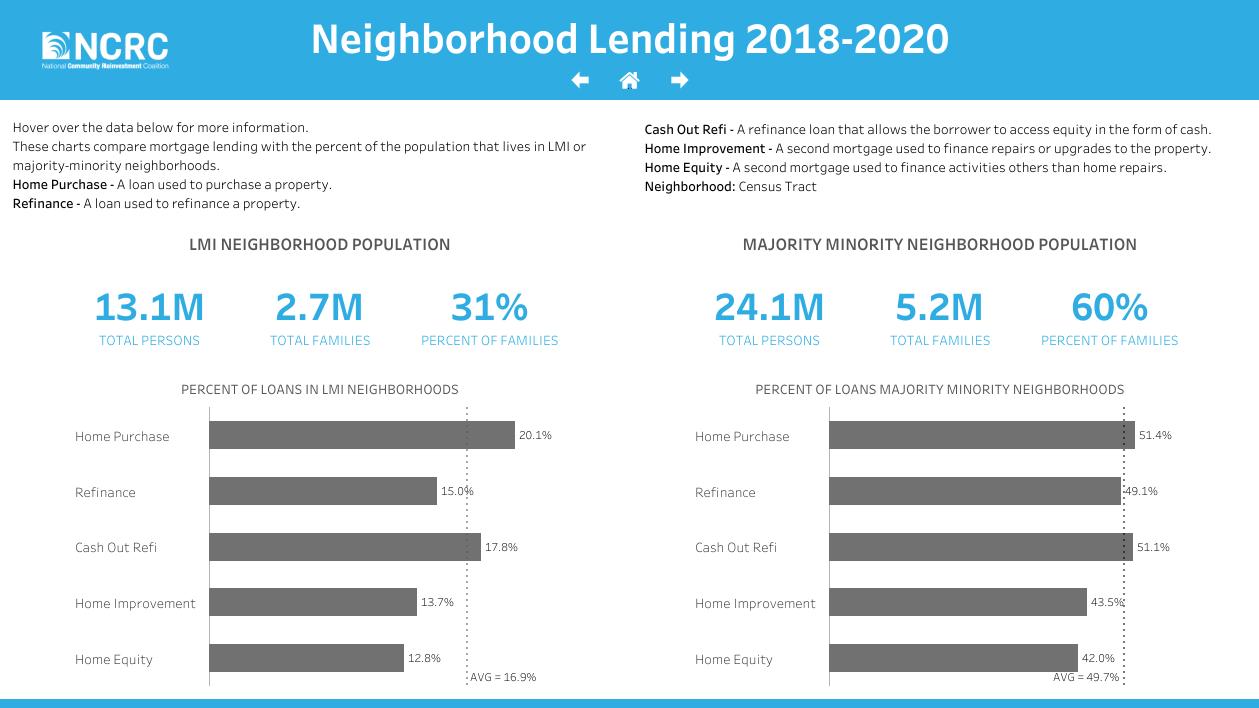
For CRC’s purposes, the Fair Lending Tool is helpful in its analysis of lending patterns and top lenders across institution types. The top 20 banks, mortgage companies, and credit unions originated 67% of total lending across a three-year period (2018 - 2020).3 An average of 49.7% of those loans went to majority-minority neighborhoods across the two-year time period, despite 60% of CA households living in these tracts. Similarly, while 31% of families live in LMI neighborhoods, an average of only 17% of loans went to these neighborhoods.4
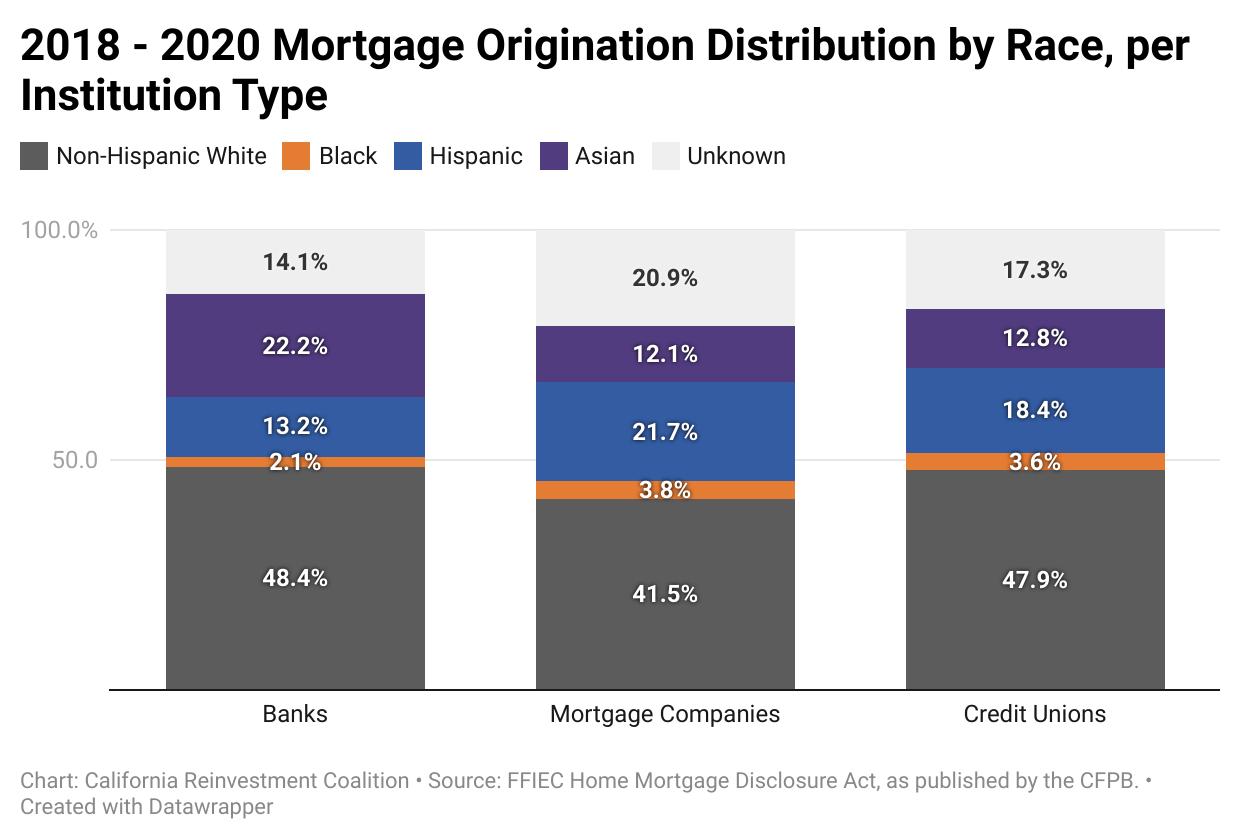
LENDING BY RACE ACROSS INSTITUTION TYPES
Native Americans and Hawaiian or Pacific Islanders both make up less than one percent of lending for all institutions. Asian borrowers make up a larger amount of the top 20 banks’ lending, while Hispanic5 borrowers have a lower share of bank lending compared to their mortgage company and credit union
3 See Appendix, table I for a list of the top 20 banks, credit unions, and mortgage companies and their respective loan volumes. This report limits its analysis to these listed institutions.
4 See Appendix, table II.
5 CRC as an organization prefers the term Latine, however data sources such as the U.S. Census and HMDA use the term “Hispanic”. To remain consistent and accurate to the data, this report will use the term “Hispanic” when referencing individuals from Latin and Central America.
Exploring Mortgage Trends in California 7
counterparts. Of particular note, mortgage companies have the largest share of mortgages with missing race data. Banks and credit unions, who originate loans in person with loan officers working directly with borrowers, are mandated by HMDA to identify a borrower’s race based on observation of the borrower. By nature of being a wholly online business, online mortgage companies and other fintech lenders escape this requirement. Further investigation into the actual makeup of these unknown borrowers is needed to adequately understand the full portfolio of mortgage companies. This is especially important considering mortgage companies’ ever-growing presence in the mortgage market, and the larger share that BIPOC borrowers have within mortgage companies’ portfolios. Because of the missing race data, community groups and researchers alike are incapable of knowing the full scale of mortgage companies lending to BIPOC borrowers, as they may make up a large amount of the loans lacking race information. On the other hand, non-Hispanic white borrowers may make up a large amount of this loan sample, which could negate the observation that mortgage companies have a higher share of loans going to BIPOC borrowers.
RACIAL AND ETHNIC SUBGROUPS IN HMDA
In addition to general racial and ethnic groups (i.e. white, Black, Asian, or Hispanic) mortgage borrowers can identify themselves as part of various Asian and Hispanic subgroups. This data point, added to HMDA in 2015 as a result of advocacy by CRC, national CAPACD and other groups, is a very useful data point and yet often underutilized by researchers, policymakers and industry leaders. Asians Americans have varied root causes of immigration and experiences of displacement from their country of origin, yet are often lumped together as cultural and economic equivalents. This is simply not the reality. There are at least 20 different nationalities and countries of origin comprising the larger, reductive “Asian American” umbrella; all of these different nationalities have their own rich culture as well as their own economic condition. The “model minority” myth reduces all Asian groups to one hegemonic identity, and prescribes a well-off financial condition which is often untrue for many Asian Americans. The median net worth among Asian Americans in Los Angeles, for example, has great variation – Koreans, have the lowest wealth at $23,400 while Japanese Americans in LA have a median wealth of about $592,999. Asian subgroups like Koreans, Cambodians, Bangladeshis, and Laotians all have homeownership rates below that of white Americans in California. The ability to analyze lending patterns among specific Asian nationalities, therefore, is imperative to dispelling such “model minority” myths and to prevent the masking of discrimination that may be occurring within Asian American communities.
A much larger percentage of mortgage company borrowers did not report a specific Asian country of origin. Perhaps this is due to mortgage companies’ online nature, wherein there are no loan officers in person to report a specific nationality of origin, though the real reason is unclear. More research is needed, and indicative of the importance of disaggregated race analysis.
Exploring Mortgage Trends in California 8
While Asian Indians make up 14% of California’s Asian population6, they represented 23% and 22% of the top 20 banks’ and credit unions’ respective origination volumes. Chinese borrowers, who represent 27% of California’s Asian population, were most represented among banks compared to the other two institution types. Filipinos, who are the second largest Asian nationality and represent 22% of the Californian population, were best served by credit unions. Vietnamese and Korean Californians were largely underserved by all institutions compared to their share of California’s Asian population (12% and 8% respectively). Among all institution types, Filipino borrowers had the highest usage of government-insured loans.
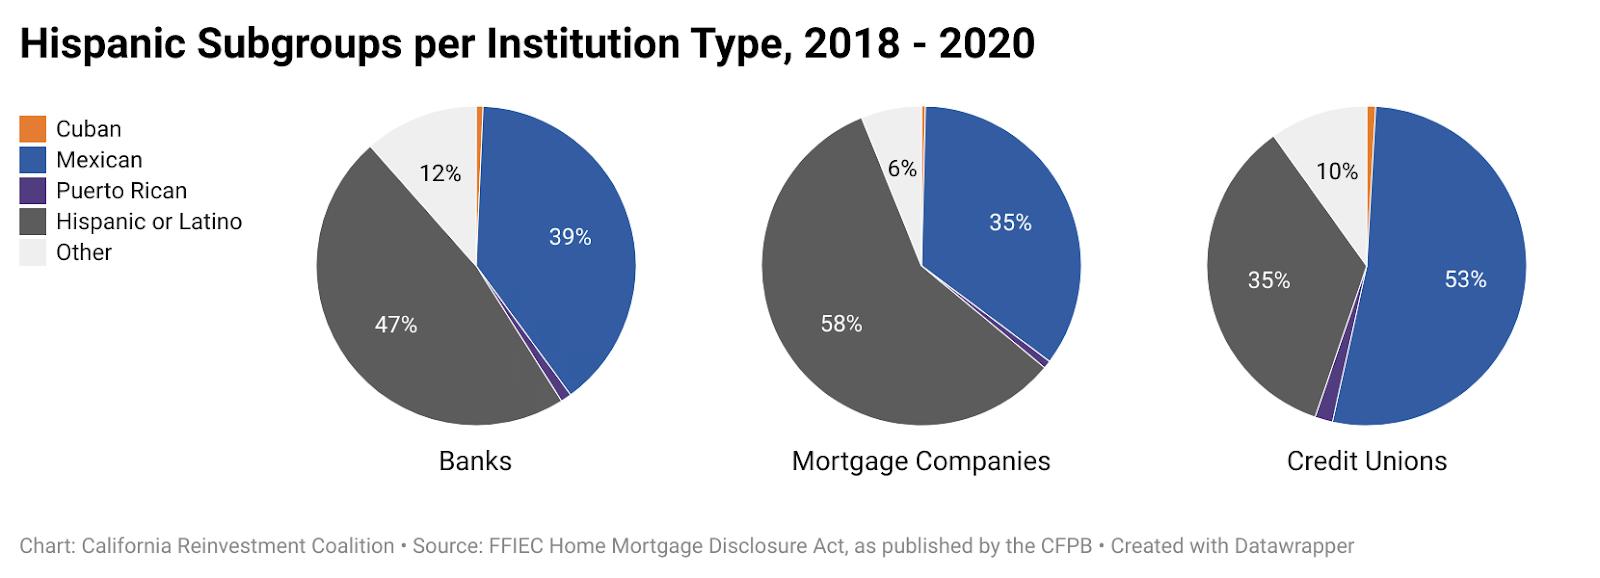
Similarly, Hispanic Americans come from over 20 countries of origin and have varied financial conditions. Puerto Ricans and Mexicans in California have homeownership rates of 48% and 46.5%, respectively, compared to the larger “Hispanic” ethnic group’s homeownership rate of 48.5%. Similar to Asian Americans and their varied nationalities, Hispanic subgroups have varied levels of wealth, educational attainment, and economic hardships such as food insecurity. For instance, Cubans report a median household wealth of $92,700 while Puerto Ricans have a median household wealth of $35,770. It is therefore important to analyze lending patterns among Hispanic borrowers according to national origin to provide further context on economic inequality and wealth gaps, and how mortgage lending patterns may or may not contribute to such divides. Subsequent publications will take a pointed look at lending by institution type.
The top 20 credit unions have a higher number of Hispanic borrowers identifying with a nation of origin, with Mexican being the highest. Continued exploration into the reasons why the majority of the top 20 credit unions’ lending is to Mexicans could illustrate any unique qualities of these financial institutions that particularly attract Mexican homebuyers to credit unions over other institutions, especially since Mexicans are the largest Hispanic nation of origin in California, continued exploration into the reasons why Mexicans are the majority of the top 20.
Puerto Ricans had the highest usage of government-insured loans among all institution types. Further research should examine any unfair steering of Hispanic borrowers into government-insured loans, if any.
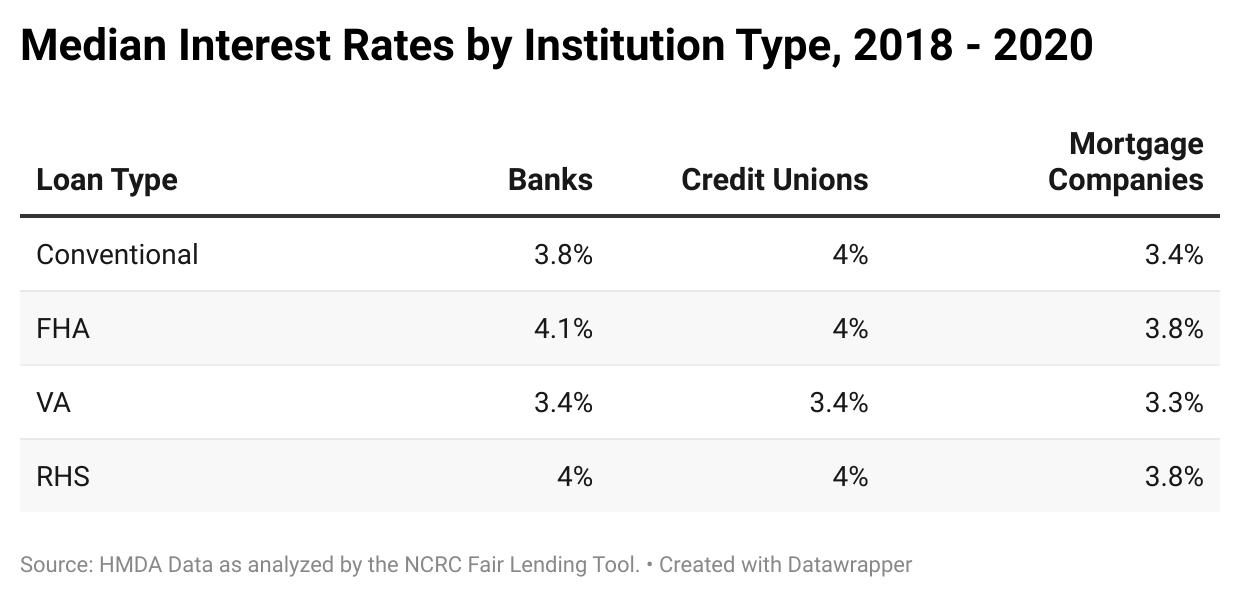
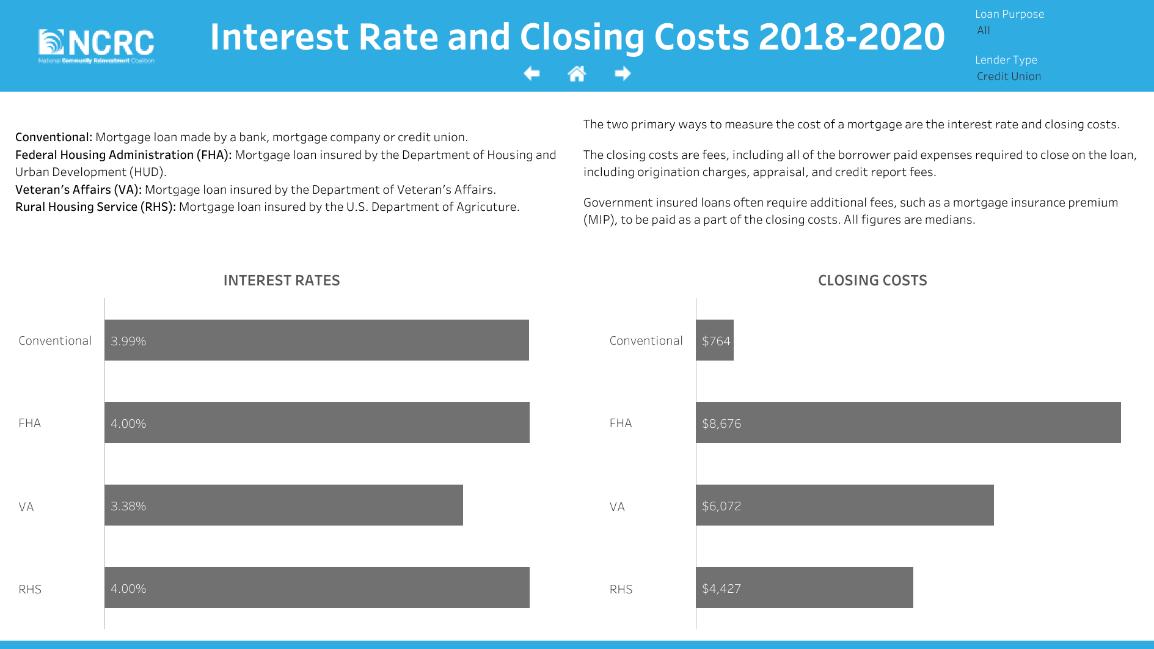
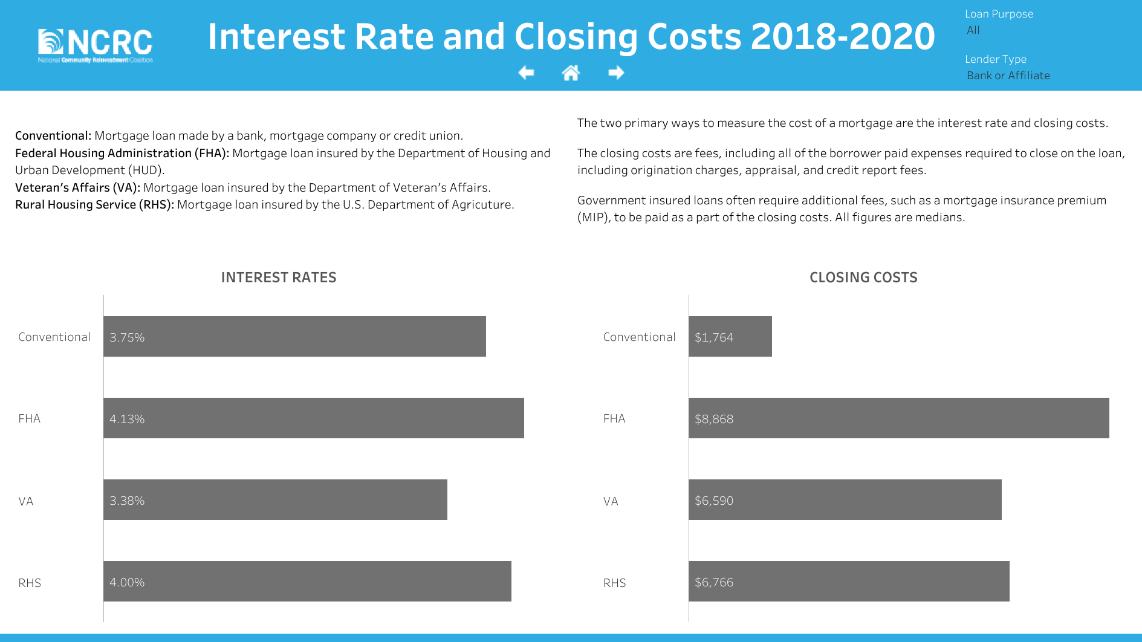
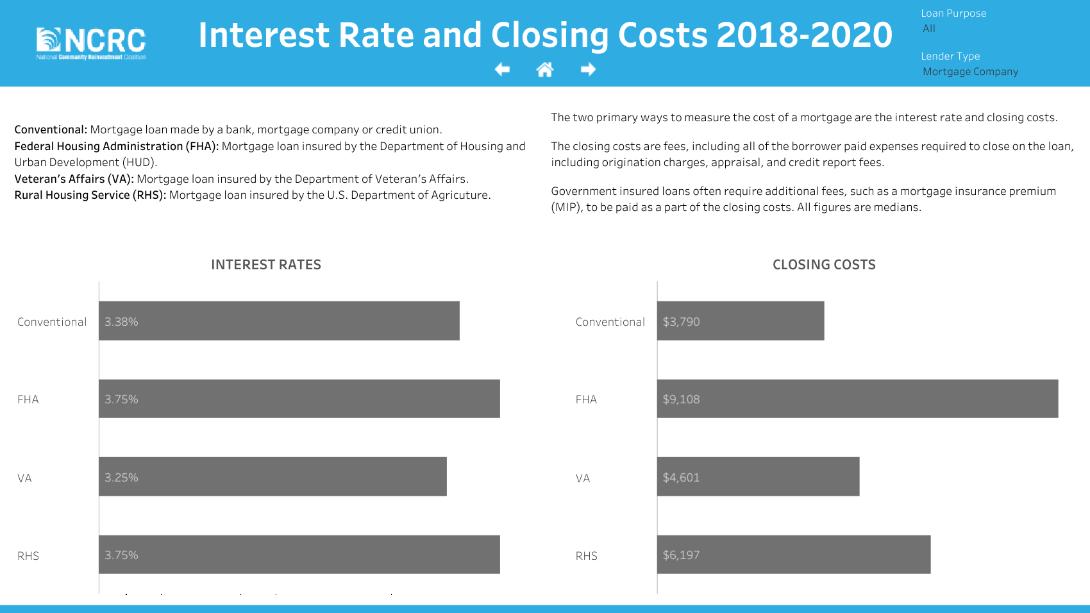
INTEREST RATES AND CLOSING COSTS, BY LOAN TYPE AND INSTITUTION
While interest rates may be slightly lower for mortgage companies lending as compared to banks and credit unions, closing costs for mortgage companies skew higher. Considering mortgage companies’ higher share of loans to BIPOC borrowers coupled with higher closing costs – among conventional and government-insured loans – further research and scrutiny are needed to understand this discrepancy and any origins of such higher closing costs.
Exploring Mortgage Trends in California 9
6 Population estimates from the U.S. Census Bureau’s 2020 American Community Survey, 5 year estimates. Table DP05 “DEMOGRAPHIC AND HOUSING ESTIMATES”.
2021 HMDA ANALYSIS
As previously mentioned, HMDA data is a critical tool for communities to evaluate whether housing needs are being met, to help localities see where more resources are needed in communities, and to help enforce fair housing law.
Exploring Mortgage Trends in California 10
Loan Type Banks Credit Unions Mortgage Companies Conventional $1,764 $764 $3,790 FHA $8,868 $8,676 $9,108 VA $6,590 $6,072 $4,601 RHS $6,766 $4,427 $6,197
Median closing costs, 2018 – 2020
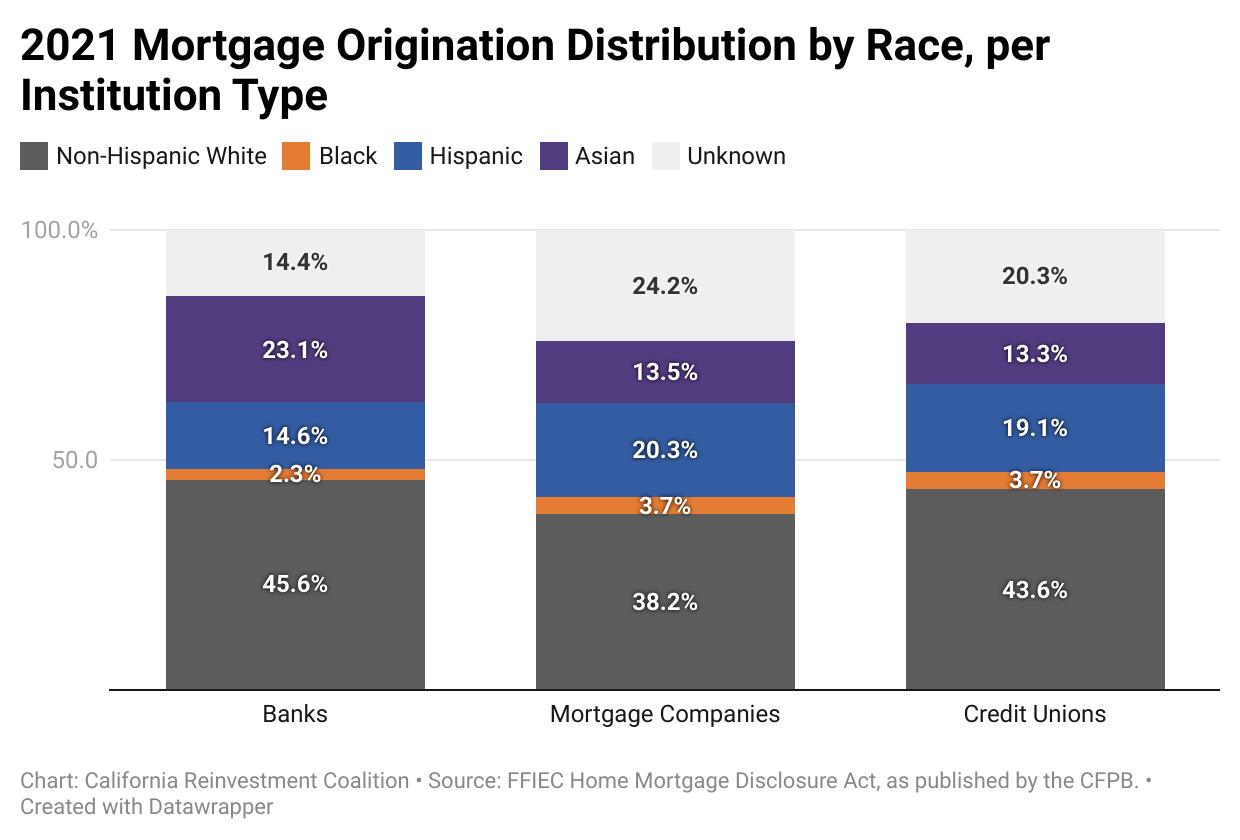
MISSING RACE DATA INCREASES AND LENDING TO RACIAL GROUPS FLUCTUATE
The percentage of loans missing race data increased in 2021, perpetuated by mortgage companies and credit unions increasing their percentage of loans lacking race data from the previous year (24.2% and 20.3% of their respective portfolios had unknown race data). This unknown racial data could skew mortgage companies’ loan distribution in favor of BIPOC borrowers, or in favor of non-Hispanic white borrowers. A large amount of missing race data makes it hard to know if financial institutions, mortgage companies in particular, are properly serving the whole market in all communities and ensuring that fair housing and fair lending laws are being followed.
For loans that did have race data, the story of lending is not linear for racial groups or institution types. The Asian share of mortgage companies and banks’ loan distribution increased roughly 1 percentage point from the prior year, and the percentage of bank loans that went to Hispanics increased 1.4 percentage points from the previous year. On the contrary, the percentage of mortgage companies’ loans that went to Hispanic borrowers decreased. The percentage of credit unions’ loans to nonwhite borrowers hardly changed from 2020 to 2021.
Notably, no institution type’s lending to Black borrowers is on parity with Black households’ CA population share, which is 6.5%. Banks continue to underperform among nonwhite borrowers.
Origination charges are the source of compensation to the loan originator and are borrower-paid. Interestingly, in 2021, the top 20 mortgage companies charged their borrowers an average of $616 more than the top 20 banks and $970 more than the average origination charge for the top 20 credit unions. This discrepancy in origination charges worsened when compared by race. Black, Hawaiian, and Native American borrowers were charged the most for originator compensation. Further research and oversight are needed relating to how these compensation charges are calculated, and why there may be disparate outcomes across institution types as well as among borrower demographics and loan types.
ACCESS TO HOMEOWNERSHIP FOR THOSE WHO NEED IT MOST – BUT AT WHAT COST?
Government-insured loans can serve the needs of those who are locked out of the conventional mortgage market, such as LMI and BIPOC borrowers who may not qualify for a conventional loan. Government-insured loans are a crucial vehicle to get LMI and BIPOC households who cannot qualify for conventional financing into homeownership; however, are mortgage companies steering these groups
Exploring Mortgage Trends in California 11
Race Bank Credit Union Mortgage Company White 1175 995 1595 Black 1380 995 2228 Hispanic 1380 995 1949 Asian 1175 995 1290 Hawaiian 1378 995 1835 Native American 1337 995 1864 Unknown 1130 995 1595 Total median 1175 995 1595
Median Origination Charges for conventional loan per borrower race, by institution type ($’s)
into higher-cost government-insured loans when they could qualify for a conventional loan? Mortgage companies’ reliance on government-insured loans, particularly among Black, Hispanic, and other borrowers of color, is concerning because if steering is at play, lower-wealth borrowers are being pushed to pay higher costs for a loan when they could otherwise qualify for a conventional loan. As previously stated, government-insured loans are an important product and institutions should continue offering them. Yet, in light of mortgage companies’ increasing market share of the mortgage industry, and their higher rates of lending to BIPOC borrowers, greater scrutiny and regulation of mortgage companies is needed to ensure that this lending is fair and accurately priced.
BLACK HOMEBUYERS MORE OFTEN RECEIVE GOVERNMENT-INSURED LOANS FROM MORTGAGE COMPANIES, REGARDLESS OF INCOME
Take the example of LMI Black home purchasers in 2021: These home buyers do receive FHA loans by both banks and mortgage companies at higher rates, yet banks are still able to originate conventional loans to these borrowers. Conventional loans represented 90% of the loans LMI Black borrowers received from the top 20 banks; this is 34 percentage points higher than mortgage companies’ loan distribution.
Notably, the trend still exists for middle-to-upper income Black home purchasers – who may be able to qualify for a conventional loan more easily thanks to a higher income – and the disparate closing costs across loan types are even higher. If traditional banks can lend conventional mortgages to both LMI and middle-to-upper-income Black borrowers, why can’t mortgage companies? The disparities in lending by loan type as well as closing costs raise concerns of steering conventional-qualified borrowers into FHA loans. This points again to the need for greater regulation and scrutiny of such institutions.
Exploring Mortgage Trends in California 12
Loan Type Home
Borrowers by the Top 20 Banks Home purchase loans to LMI Black Borrowers by the top 20 mortgage companies Conventional 90.38% 55.92% Median Closing Costs $2,737 $4,604 FHA 5.7%% 31.7% Median Closing Costs $9,818 $9,641 USDA N/A .09% Median Closing Costs N/A $8,865 VA 3.85% 12.2% Median Closing Costs $7,925 $6,621
Purchase loans to LMI Black
Loan Type
Home Purchase loans to mid-toupper Black Borrowers by Banks
Conventional 92.35% 58.66%% Median Closing Costs $4,632 $5,455 FHA 4.11% 25.8% Median Closing Costs $10,742 $12,291 USDA 0.1% 0.24% Median Closing Costs $6,099 $7,257 VA 3.44%% 15.29% Median Closing Costs $4939 $9,973
Home purchase loans to midto-upper Black Borrowers by mortgage companies
Government-insured loans are an important product that in themselves are not problematic to the borrower. The concern illustrated by mortgage companies’ disproportionate lending of government-insured lending to BIPOC borrowers is rather the higher closing costs, as well as the potential fair housing concerns relating to steering that may be at play. These trends, in light of mortgage companies’ greater prevalence among individuals and communities of color, need further research. Greater scrutiny and evaluation must be placed on mortgage companies, entities that skirt so many of the regulations banks must adhere to, all while mortgage companies surpass the lending volume of regulated financial institutions by leaps and bounds.
CFPB CONSUMER COMPLAINTS AGAINST MORTGAGE LENDERS
The Consumer Financial Protection Bureau collects complaints against financial companies, which are then sent directly to the company for assistance and resolution. The CFPB publishes a robust amount of complaint information with consent from the consumer, including the consumer’s complaint narrative. This information is helpful in understanding a greater picture of a company’s conduct that can not be illustrated through quantitative data like HMDA data, such as their responsiveness to customer complaints and interpersonal business conduct.
CONSUMER COMPLAINTS AGAINST MORTGAGE COMPANIES AND BANKS MAKE UP ABOUT HALF OF ALL MORTGAGE-RELATED COMPLAINTS IN CALIFORNIA
From January 2018 to the end of 2021, the period of this report’s analysis, the top 20 mortgage companies received a total of 2,306 mortgage-related complaints filed against them out of a total of over 10,000 mortgage-related complaints in the state
¤ A majority of these complaints (1,646) were concerning conventional mortgages.
¤ Most complaints (979) were related to trouble during the payment process. Struggling to pay the mortgage was the second-highest reported issue among these institutions, with 668 complaints.
¤ Complaint narratives outline issues related to completed payments being marked as late or never received; miscalculations of property taxes, escrow payments, insurance costs, or wrongful notice of default.
¤ Nationstar mortgage received a substantial 1093 of complaints against mortgage companies. That is almost half of all complaints against the top 20 mortgage companies. Many of the complaints were related to Nationastar’s loan servicing affiliate, Mr. Cooper.
¤ Nearly all of these complaints (855) were related to a conventional mortgage.
¤ The largest amount of complaints were related to struggling to pay the mortgage. Most of the narratives from complaints filed in the past two years speak to issues of deception, lack of clarity, and unfair treatment related to mortgage forbearance and modifications during the pandemic.
Across the same time period, the top 20 banks received a total of 3,715 mortgage-related complaints.
¤ A majority of these complaints (2399) were concerning conventional mortgages.
¤ Most complaints (1,497) were related to trouble during the payment process. Struggling to pay the mortgage was the second-highest reported issue among these institutions, with 1037 complaints.
¤ Complaint narratives outline issues with a lack of transparency or misleading guidance related to loan deferment, loan modifications, and the application process.
Exploring Mortgage Trends in California 13
LAWSUITS AND HUD COMPLAINTS AGAINST BANKS AND MORTGAGE COMPANIES
Another useful qualitative data source reflecting on fairness in the mortgage market is fair housing complaints filed to the U.S. Department of Housing and Urban Development (HUD) and fair housing lawsuits filed against financial institutions. Interpersonal discrimination is a pervasive issue that, similar to CFPB complaints, cannot always be seen in mortgage data.
Fair housing and fair lending complaints often use some sort of matched pair or “mystery shopping” testing, which adds a comparative aspect that can prove discrimination that cannot be done in quantitative data without statistical analysis. HUD complaints can be filed against “property owners, property managers, developers, real estate agents, mortgage lenders, homeowners associations, insurance providers, and others who affect housing opportunities.” In the Fiscal Year 2021, HUD reported 2,480 complaints filed on the basis of racial discrimination. Fair housing lawsuits and HUD complaints are ways for individuals to rectify wrongdoings and financial institutions’ violation of fair lending laws, especially when bank CRA performance evaluations sometimes fail to capture the full extent of a bank’s fair lending violations, and mortgage companies largely escape regulatory measures and examinations like CRA performance evaluations7. These two data sources, however, are incomplete, and HUD only publishes press releases regarding resolutions to complaints. The complete breadth of HUD complaints and their details is not public, except for brief summary statistics in annual reports.
CONTINUED APPRAISAL BIAS FROM LOANDEPOT.COM
Loandepot.com was the subject of a fair housing lawsuit after a Black family received an appraisal of $472,000 from loandepot.com’s appraiser. After re-applying and “whitewashing” their home, they received a valuation of $750,000 – a $278,000 gap between valuations. The filed complaint states that “The couple is seeking damages and relief from Lanham, 20/20 Valuations LLC, and loanDepot for violations of the Fair Housing Act, the Equal Credit Opportunity Act, the Civil Rights Act of 1866, and Maryland Fair Housing Laws, according to the complaint”. Not only was the appraisal far below what the whitewashed household received, but the appraiser’s valuation was even lower than Loandepot’s initial “conservative” valuation.
In 2018, Loandepot.com received complaints filed through HUD for similar appraisal issues, in both North Dakota and in California. Homeowners alleged that Loandepot.com refused to refinance their homes due to being on American Indian lands. In one case, the appraisal company used by Loandepot.com informed the company that they would not appraise the home because it was on “Indian land”. Though the companies deny any discrimination, Loandepot.com and the complainants reached a conciliation agreement, in which Loandepot.com agreed to the following:
¤ Pay the complainants $30,000 each
¤ Fund a loan subsidy program in the amount of $40,000 to benefit prospective owners of American Indian Reservations
¤ Provide $240,000 to support outreach programs for housing conditions, financial literacy, and homeownership education in and around reservations
¤ Revise policies regarding the underwriting of mortgages on and around Indian reservations
Exploring Mortgage Trends in California 14
7 See Calvin Bradford (2022), “Violating Your Way to an Outstanding CRA Rating: The Treatment of Race Discrimination Law Violations in the Community Reinvestment Act Examinations and Ratings”. Working Paper from The Woodstock Institute.
CITY NATIONAL BANK’S LENDING IN LOS ANGELES RESULTS IN THE DEPARTMENT OF JUSTICE’S LARGEST REDLINING SETTLEMENT
The Justice Department filed a complaint against City National Bank for its avoidance of mortgage lending to majority-Black and Hispanic neighborhoods, while discouraging residents in those communities from obtaining mortgages. In addition to alleged mortgage lending discrimination, the bank shockingly only opened one branch in majority-Black and Hispanic neighborhoods over the past 20 years, despite having opened or acquired 11 total branches during that time period in Los Angeles. The sole branch opened in majority-Black and Hispanic neighborhoods were not staffed with a mortgage loan officer.
The settlement, part of the DoJ’s Combating Redlining Initiative, amounted to over $31 million to reinvest in impacted communities. This includes the following:
¤ At least $29.5 million invested into a loan subsidy fund for residents of majority-Black and Hispanic communities in Los Angeles County. This fund includes carve-outs for advertising and outreach, consumer financial education, and the development of community partnerships.
¤ The bank will open one new branch in impacted LA communities, with at least four mortgage loan officers dedicated to serving the impacted residents, and a full-time community lending manager
¤ A Community Credit Needs Assessment conducted to identify gaps and needs in financial services for impacted majority-Black and Hispanic census tracts within Los Angeles County.
City National received a satisfactory rating in its most recent CRA performance evaluation from the OCC, in which the evaluation period overlaps with the time period of the DoJ’s lawsuit. Furthermore, in California specifically, the bank received a “high satisfactory” rating under the lending test, and the OCC states its lending in the Los Angeles CSA was “good”. As extensively outlined by a working paper from Calvin Bradford and published by the Woodstock Institute titled “Violating Your Way to an Outstanding CRA Rating: The Treatment of Race Discrimination Law Violations in the Community Reinvestment Act Examinations and Ratings”, CRA performance evaluations often miss the full extent of an institution’s discriminatory and unfair practices. Ninety-six percent of banks get a passing CRA rating. With new CRA rules soon to be announced, the rules must ensure that financial institutions are robustly scrutinized for the full scope of their service to both low-to-moderate income communities, and communities of color.8
POLICY RECOMMENDATIONS
Robust and proactive legislation is needed to rectify past and continued harms against BIPOC groups, as well as to make homeownership attainable for those in most need in the future. Here is what we recommend should be done at the federal and state levels.
Federal CRA must include:
¤ A race-conscious analysis of whether financial institutions are meeting the credit needs of BIPOC borrowers and communities.
¤ CRC’s comment letter in response to the interagency notice of proposed rulemaking on CRA outlines the legacy of redlining and racial exclusion in financial services that still exists today. The CRA statute, legislative history, regulations, and implementation argue for a greater and more explicit CRA focus on race. How can a race-neutral law remedy redlining and racial discrimination in housing and financial services? The federal CRA rule, therefore, must evalu-
8 See CRC’s comment letter on Proposed Community Reinvestment Act Modernization Rules for further information about the legal grounds and statutory authority for CRA to be race-conscious: https://calreinvest.org/wp-content/uploads/2022/08/CRC_NPR-CRA-Letter_082022.pdf
Exploring Mortgage Trends in California 15
ate retail lending, community development finance, retail products and services, branch access and community development services to BIPOC consumers and in BIPOC communities, alongside such evaluations for LMI borrowers and communities.
¤ Greater incentives for banks to offer race-conscious financial relief and products, such as special-purpose credit programs.
¤ Special purpose credit programs (SPCP) are a way for financial institutions to design and market financial products for underserved individuals and groups.9 Such suggestions include granting positive impact points for activities that demonstrably close racial wealth gaps such as SPCP, and including an evaluation of SPCP offerings in the Retail Services and Products Test.
¤ More robust fair housing and fair lending exams in CRA performance evaluations which include various sources of discrimination evidence, such as: court cases, regulatory actions, investigations, fair housing and consumer complaints or community contact/comments, as well as an evaluation of disparities in closing costs, and steering of protected classes into higher cost products instead of others they could qualify for.
¤ Potential steering into mortgages with higher closing costs and/or interest rates is grounds for discrimination and has been historically proven to be a problem. CRA Performance evaluations should treat it as such.
¤ Coverage and regulation of independent mortgage companies and credit unions.
¤ As banks’ share of mortgage lending continues to decline, the efficacy of the federal CRA does as well. The higher proportion of lending to BIPOC and LMI individuals among mortgage companies and credit unions illustrates a need for accountability and scrutiny to ensure that their lending to BIPOC populations is fair and equitable. These institutions, furthermore, should be obligated to reinvest in the communities they serve in the same way that banks are.
HMDA rules and enforcement should:
¤ Promote more robust reporting of race and ethnicity among all borrowers.
¤ Lower reporting thresholds for lending institutions.
¤ A Trump-era 2020 HMDA rule raised the reporting threshold for institutions from 25 to 100 loans, resulting in 35% of mortgage lenders not being required to report their HMDA data, a crucial tool for communities and advocates to hold financial institutions accountable. NCRC, represented by Public Citizen, led a challenge to this regressive rule and filed suit against the CFPB. In September 2022, a federal judge sided with NCRC’s claim that the CFPB acted unlawfully in exempting nearly 35% of mortgage lenders from data reporting obligations. HMDA rules must continue to have a low threshold, ensuring that communities and advocates have the full breadth of information needed to evaluate if their communities are being fairly and adequately met by financial institutions.
¤ Include a field for the language preferred and spoken by applicants.
¤ Include a data field on whether or not the borrower is a corporate or LLC borrower.
Exploring Mortgage Trends in California 16
9 See CRC’s CRC comment letter on the interagency notice of proposed rulemaking on CRA, which outlines recommendations to incentivize the creation of SPCP.
¤ Currently, HMDA data only provides information on if the loan was used for a primary residence, second residence, or investment property. While this hypothetically can be used as a proxy to understand the landscape of lending to corporate or LLC investors, it does not provide exact information as to whether or not a loan is being given to a small mom-and-pop landlord or a large real estate investment company. This information is important and much needed for analysis, especially as corporate ownership of the rental market increases over time.
Financial institutions should:
¤ Create special purpose credit programs, an ECOA-compliant way to create race-conscious credit products, to make homeownership for first-time borrowers more affordable and accessible.
¤ Offer Fannie Mae’s HomeReady mortgage, Freddie Mac’s HomeOne or HomePossible mortgage, products created for first-time homebuyers offering low down payment, lower credit score minimums, and higher loan-to-value ratio eligibility. These programs also offer borrower education as a critical component of the product and accept alternative credit scoring when necessary and beneficial.
¤ Adopt CRC’s Anti-Displacement Code of Conduct to stop the financing of problematic landlords and real estate companies and the acceleration of displacement and gentrification.
The State of California should:
¤ Pass a state-level Community Reinvestment Act which is race-conscious, ensures robust regulation and oversight, and expands coverage to institutions ignored by the federal CRA. In addition to state chartered banks, a state level CRA should cover independent mortgage companies, state-chartered credit unions, and financial technology firms.
¤ The lack of oversight of non-bank lenders such as mortgage companies may be allowing for fair housing issues to slip through the cracks, such as the potential steering of LMI and/or BIPOC borrowers into higher-cost government-backed loans. For example, loandepot.com’s alleged discriminatory practices against indigenous borrowers were only resolved because it was brought to the attention of HUD via a complaint – how many other cases of discrimination are going unnoticed? Furthermore, as independent mortgage companies’ share of the mortgage market increases, especially amongst BIPOC borrowers, the lending patterns and community investment of nonbank financial institutions must be scrutinized.
¤ Invest a larger sum into CalHFA Loan, a state-level affordable housing lender, to make mortgage financing more accessible to a larger number of LMI Californians.
¤ Pass SB 594 (Durazo), “LLC Owner Transparency”, which would enable the Secretary of State’s office to publicize Beneficial Owner information of real property in California.
¤ The ability of owners of rental property to shield their identities from public scrutiny and accountability presents a host of challenges to protecting access to decent, safe, and affordable housing. Without transparency, the public and policymakers cannot document and assess the extent to which homes are concentrated in the hands of a few large corporations or identify other trends that would assist them in making informed policy decisions.
¤ LLCs and REITs already must register with the Secretary of State’s office upon creation and provide certain information, which is publicly accessible and submitted to local assessors. This legislation would require that the publicly available registration information include the beneficial owner of the property or company.
Exploring Mortgage Trends in California 17
¤ Preserve affordable housing and promote housing co-ops and shared equity models as an affordable entry in homeownership and long-term solution to housing instability.
¤ AB 919 (Kalra) - The Stable Homes Act, which would establish a statewide Tenant Opportunity to Purchase or Community Opportunity to Purchase Act (TOPA/COPA), would be a transformative step in this direction. TOPA/COPA policies give tenants and eligible entities, including local public agencies and mission-driven nonprofits, the first opportunity to purchase rental housing when the owner decides to sell the property and the right to match an offer on those properties made by a third party. These policies would combat displacement and increase the stock of permanently affordable housing in CA by helping tenants stay in their homes and preserving at-risk unsubsidized affordable rental housing on the private market from entering the speculative market.
¤ SB 225 (Caballero) - Community Anti-Displacement and Preservation Program (CAPP) would create a new state program to provide the resources that community organizations, affordable housing developers, and local jurisdictions need to acquire unsubsidized rental housing from the private market where tenants are at risk of displacement and to preserve the housing as affordable rental housing or homeownership opportunities. CAPP would prevent displacement and homelessness by stabilizing low-income families in their communities, while also growing California’s supply of deed-restricted affordable homes for the future.
¤ Robust and accurate implementation of SB 1079 (Skinner), its implementation bill AB1837 (Bonta), and the $500 million Foreclosure Intervention Housing Preservation Program (FIHPP).
¤ SB 1079, “Homes for Homeowners, Not Corporations Act”, was passed in 2020 to prevent investor corporations from potentially capitalizing on a foreclosure crisis, as they did in 2008, by providing residents and eligible non-profits a special window to match the bid of investors at foreclosure auctions.
¤ FIHPP provides a critical funding source to eligible nonprofits by making $500 million in loans and grants available to purchase and rehabilitate buildings at foreclosure auction, in the foreclosure process, or at risk of foreclosure.
Exploring Mortgage Trends in California 18
APPENDIX
I. Top 20 Institutions in California, by lending volume (2018 – 2020)
II. Total Lending by Neighborhood Characteristics (2018 – 2020)
III. Share of top 20 banks’ and mortgage companies’ loan originations that were government-insured (2018 – 2020)
IV. Median Interest Rates and Closing Costs, per institution type (2018 – 2020)
V. Top Mortgage Companies vs. Banks, by Neighborhood Performance (2018 – 2020)
Exploring Mortgage Trends in California 19
I. Top 20 institutions CA Lending 2018 – 2020
Exploring Mortgage Trends in California 20
a. Banks
b. Credit Unions
Exploring Mortgage Trends in California 21 c. Mortgage companies
II. Total Lending by Neighborhood Characteristics (2018 – 2020)
III. Share of top 20 banks’ and mortgage companies’ loan originations that were government-insured
Exploring Mortgage Trends in California 22
Bank Name % of 2018 – 2020 originations that were Government Insured Mortgage Company Name % of 2018 – 2020 originations that were Government Insured Wells Fargo 1.6% Quicken Loans 11% Bank of America .4% United Shore 15% JP Morgan Chase Bank .5% Loandepot.com 18.5% U.S. Bank 1.1% Freedom Mortgage 25.8% Flagstar Bank 13% Finance of America Mortgage 18.3% MUFG Union Bank 2.5% Caliber Home Loans 30% Citibank .1% American Pacific Mortgage Corporation 25% First Republic 2.5% Broker Solutions 25% Pennymac 0% Home Point Financial Corporation 24% Fremont .4% Nationstar 35% Bank of the West .7% Guild Mortgage Company 24% TCF National Bank 0% Homebridge Financial Services 37% PNC Bank .5% Stearns Lending 27.5% Primelending 19.6% Fairway Independent Mortgage Company 23% Umpqua Bank 3.6% Sierra Pacific Mortgage Company 17.5% USAA Federal Savings Bank 66% Guaranteed Rate 14.7% Third Federal S&L of Cleveland 0% Crosscountry Mortgage 27.5% BBVA 1% American Financial Network 45% City National Bank 0% Golden Empire Mortgage 25% Charles Schwab Bank 0% Paramount Residential 32%
IV. Interest Rates and Closing Costs, per institution type
Exploring Mortgage Trends in California 23
a. Banks
b. Credit unions
Exploring Mortgage Trends in California 24 c. Mortgage companies
V. Top Mortgage Companies vs. Banks, by Neighborhood Performance (2018 – 2020)