88 830 795.1 12 915.0
502 578.5 288 924.0 593 666.4 701 677.3 10 588.8 354 097.0 11 430.0 3 785 833.9
421 340.2 244 143.9 501 292.5 583 202.5 7 543.1 290 505.2 9 936.1 3 199 852.2
401 606.7 11 386.8 4 128 261.6
14 090.2
852 473.6
635 259.4
307 325.0
544 514.7
2009 208 632.8 212 319.9 606 539.2 97 765.5 264 528.1
513 795.1 12 669.2 4 974 319.4
12 000.3
1 015 204.2
747 031.6
363 982.5
642 201.1
2010 247 275.2 304 240.0 718 728.8 120 147.5 301 044.4
581 559.7 330 965.7 5 763 653.2
8 071.4
1 134 509.8
824 307.7
390 457.3
703 163.9
2011 271 174.4 328 517.0 748 386.8 131 954.6 326 727.7
4 028.4 8 823.3 7 234.4 1 661.6 4 659.6
Transporte, almacenamiento y comunicaciones
Intermediación financiera, actividades inmobiliarias, empresariales y de alquiler
Administración pública, defensa, seguridad social obligatoria, enseñanza, servicios sociales y de salud, y otros servicios comunitarios, sociales y personales
Servicios de intermediación financiera medidos indirectamente (SIFMI)
Impuestos a los productos menos subvenciones a los productos
Producto interno bruto (PIB)
52 424.1
92.2
9 446.6
Comercio al por mayor y al por menor, reparación de bienes, y hoteles y restaurantes
Discrepancia estadística del PIB por sector de origen
3 903.5
Construcción
975.3
3 501.9
Industrias manufactureras
Suministro de electricidad, gas y agua
9 527.5
Explotación de minas y canteras
2006 1 892.9
(En millones de dólares / Millions of dollars)
58 225.8
109.2
5 243.0
1 925.0
8 043.0
9 901.8
4 795.6
10 231.7
4 274.7
1 120.9
3 798.7
10 737.8
1 894.5
2007
66 434.1
71.1
5 532.4
2 169.6
9 117.6
10 321.8
4 756.7
11 254.4
5 088.3
1 206.7
4 101.4
15 027.7
2 125.4
2008
55 987.2
71.3
5 156.3
2 101.3
9 016.2
9 823.8
4 528.4
10 339.2
4 583.7
1 186.3
3 831.9
7 386.0
2 165.5
2009
59 198.3
144.7
5 562.4
2 239.2
9 167.7
10 233.6
4 526.6
10 526.0
4 009.3
1 311.4
4 009.0
9 691.8
2 255.1
2010
63 889.2
-12.9
5 765.6
2 348.3
9 566.2
10 800.2
4 876.4
11 027.9
4 041.9
1 365.5
4 396.9
11 980.7
2 429.2
2011
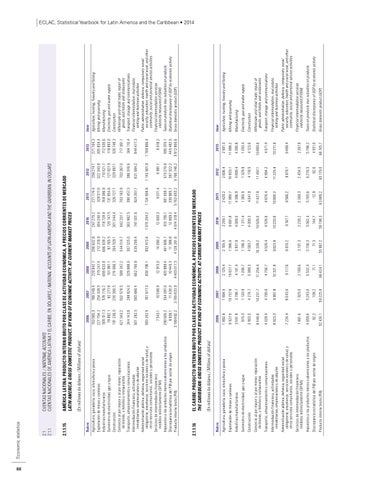
EL CARIBE: PRODUCTO INTERNO BRUTO POR CLASE DE ACTIVIDAD ECONÓMICA, A PRECIOS CORRIENTES DE MERCADO THE CARIBBEAN: GROSS DOMESTIC PRODUCT BY KIND OF ECONOMIC ACTIVITY, AT CURRENT MARKET PRICES
420 989.4 10 440.3 4 403 017.3
662 700.9
329 888.0
589 347.2
2007 188 349.4 254 339.5 578 776.2 92 277.8 230 306.5
2006 153 585.3 227 754.2 505 517.3 78 882.1 191 236.0
Agricultura, ganadería, caza, silvicultura y pesca
Rubro
2.1.1.16
Rubro Agricultura, ganadería, caza, silvicultura y pesca Explotación de minas y canteras Industrias manufactureras Suministro de electricidad, gas y agua Construcción Comercio al por mayor y al por menor, reparación de bienes, y hoteles y restaurantes Transporte, almacenamiento y comunicaciones Intermediación financiera, actividades inmobiliarias, empresariales y de alquiler Administración pública, defensa, seguridad social obligatoria, enseñanza, servicios sociales y de salud, y otros servicios comunitarios, sociales y personales Servicios de intermediación financiera medidos indirectamente (SIFMI) Impuestos a los productos menos subvenciones a los productos Discrepancia estadística del PIB por sector de origen Producto interno bruto (PIB)
2008 220 942.7 315 247.4 659 633.8 101 881.1 274 066.3
65 179.0
82.6
6 276.5
2 454.5
9 970.1
11 225.9
4 994.2
11 497.1
4 118.5
1 329.9
4 699.4
10 833.1
2 606.4
2012
573 270.8 397 322.2 5 766 746.2
8 981.1
1 143 901.9
821 084.2
386 916.6
703 367.0
2012 259 274.1 322 343.8 710 421.7 127 927.9 329 897.1
AMÉRICA LATINA: PRODUCTO INTERNO BRUTO POR CLASE DE ACTIVIDAD ECONÓMICA, A PRECIOS CORRIENTES DE MERCADO LATIN AMERICA: GROSS DOMESTIC PRODUCT, BY KIND OF ECONOMIC ACTIVITY, AT CURRENT MARKET PRICES
2.1.1.15
(En millones de dólares / Millions of dollars)
CUENTAS NACIONALES / NATIONAL ACCOUNTS CUENTAS NACIONALES DE AMÉRICA LATINA Y EL CARIBE, EN DÓLARES / NATIONAL ACCOUNTS OF LATIN AMERICA AND THE CARIBBEAN, IN DOLLARS
2.1 2.1.1
Economic statistics
66 745.7
4 551.0
5 796.2
2 267.9
9 499.4
10 211.9
4 571.4
10 893.6
4 123.6
1 293.4
4 395.8
11 086.2
2 591.3
2013
595 070.7 445 482.5 5 912 800.6
8 618.2
1 199 906.4
844 477.3
384 110.4
717 061.1
2013 271 104.3 305 934.4 712 530.6 118 993.0 326 748.3
Gross domestic product (GDP)
Statistical discrepancy of GDP by economic activity
Taxes on products less subsidies on products
Financial intermediation services indirectly measured (FISIM)
Public administration, defence, compulsory social security, education, health and social work, and other community, social and personal service activities
Financial intermediation, real estate, renting and business activities
Transport, storage and communications
Wholesale and retail trade, repair of goods, and hotels and restaurants
Construction
Electricity, gas and water supply
Manufacturing
Mining and quarrying
Agriculture, hunting, forestry and fishing
Item
Item Agriculture, hunting, forestry and fishing Mining and quarrying Manufacturing Electricity, gas and water supply Construction Wholesale and retail trade, repair of goods, and hotels and restaurants Transport, storage and communications Financial intermediation, real estate, renting and business activities Public administration, defence, compulsory social security, education, health and social work, and other community, social and personal service activities Financial intermediation services indirectly measured (FISIM) Taxes on products less subsidies on products Statistical discrepancy of GDP by economic activity Gross domestic product (GDP)
ECLAC, Statistical Yearbook for Latin America and the Caribbean • 2014