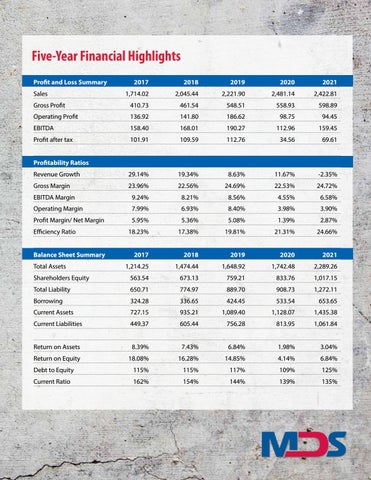
Five-Year Financial Highlights Profit and Loss Summary
2017
2018
2019
2020
2021
1,714.02
2,045.44
2,221.90
2,481.14
2,422.81
Gross Profit
410.73
461.54
548.51
558.93
598.89
Operating Profit
136.92
141.80
186.62
98.75
94.45
EBITDA
158.40
168.01
190.27
112.96
159.45
Profit after tax
101.91
109.59
112.76
34.56
69.61
Sales
Profitability Ratios Revenue Growth
29.14% 19.34% 8.63% 11.67% -2.35%
Gross Margin
23.96% 22.56% 24.69% 22.53% 24.72%
EBITDA Margin
9.24% 8.21% 8.56% 4.55% 6.58%
Operating Margin
7.99% 6.93% 8.40% 3.98% 3.90%
Profit Margin/ Net Margin
5.95%
Efficiency Ratio Balance Sheet Summary
5.36%
5.08%
1.39%
2.87%
18.23% 17.38% 19.81% 21.31% 24.66% 2017
2018
2019
2020
2021
1,214.25
1,474.44
1,648.92
1,742.48
2,289.26
Shareholders Equity
563.54
673.13
759.21
833.76
1,017.15
Total Liability
650.71
774.97
889.70
908.73
1,272.11
Borrowing
324.28
336.65
424.45
533.54
653.65
Current Assets
727.15
935.21
1,089.40
1,128.07
1,435.38
Current Liabilities
449.37
605.44
756.28
813.95
1,061.84
Total Assets
Return on Assets
8.39%
7.43%
6.84%
1.98%
3.04%
Return on Equity
18.08%
16.28%
14.85%
4.14%
6.84%
Debt to Equity
115%
115%
117%
109%
125%
Current Ratio
162% 154% 144% 139% 135%
2021 Annual Report - Medical Disposables & Supplies Limited
39


