Bus Stop Safety Improvement Plan
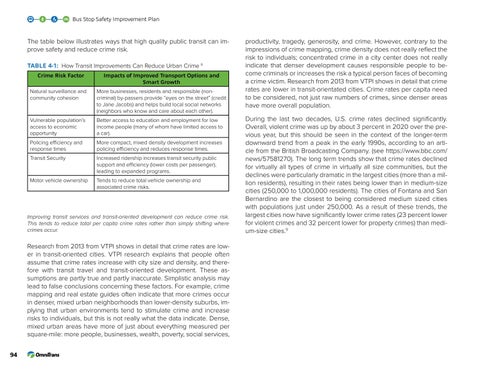
The table below illustrates ways that high quality public transit can improve safety and reduce crime risk. Table 4-1: How Transit Improvements Can Reduce Urban Crime 6 Crime Risk Factor
Impacts of Improved Transport Options and Smart Growth
Natural surveillance and community cohesion
More businesses, residents and responsible (noncriminal) by-passers provide “eyes on the street” (credit to Jane Jacobs) and helps build local social networks (neighbors who know and care about each other).
Vulnerable population’s access to economic opportunity
Better access to education and employment for low income people (many of whom have limited access to a car).
Policing efficiency and response times
More compact, mixed density development increases policing efficiency and reduces response times.
Transit Security
Increased ridership increases transit security public support and efficiency (lower costs per passenger), leading to expanded programs.
Motor vehicle ownership
Tends to reduce total vehicle ownership and associated crime risks.
Improving transit services and transit-oriented development can reduce crime risk. This tends to reduce total per capita crime rates rather than simply shifting where crimes occur.
Research from 2013 from VTPI shows in detail that crime rates are lower in transit-oriented cities. VTPI research explains that people often assume that crime rates increase with city size and density, and therefore with transit travel and transit-oriented development. These assumptions are partly true and partly inaccurate. Simplistic analysis may lead to false conclusions concerning these factors. For example, crime mapping and real estate guides often indicate that more crimes occur in denser, mixed urban neighborhoods than lower-density suburbs, implying that urban environments tend to stimulate crime and increase risks to individuals, but this is not really what the data indicate. Dense, mixed urban areas have more of just about everything measured per square-mile: more people, businesses, wealth, poverty, social services, 94
productivity, tragedy, generosity, and crime. However, contrary to the impressions of crime mapping, crime density does not really reflect the risk to individuals; concentrated crime in a city center does not really indicate that denser development causes responsible people to become criminals or increases the risk a typical person faces of becoming a crime victim. Research from 2013 from VTPI shows in detail that crime rates are lower in transit-orientated cities. Crime rates per capita need to be considered, not just raw numbers of crimes, since denser areas have more overall population. During the last two decades, U.S. crime rates declined significantly. Overall, violent crime was up by about 3 percent in 2020 over the previous year, but this should be seen in the context of the longer-term downward trend from a peak in the early 1990s, according to an article from the British Broadcasting Company. (see https://www.bbc.com/ news/57581270). The long term trends show that crime rates declined for virtually all types of crime in virtually all size communities, but the declines were particularly dramatic in the largest cities (more than a million residents), resulting in their rates being lower than in medium-size cities (250,000 to 1,000,000 residents). The cities of Fontana and San Bernardino are the closest to being considered medium sized cities with populations just under 250,000. As a result of these trends, the largest cities now have significantly lower crime rates (23 percent lower for violent crimes and 32 percent lower for property crimes) than medium-size cities.9


