3 minute read
8.4 The reasons why environmental sustainability is of importance to Australia and globally


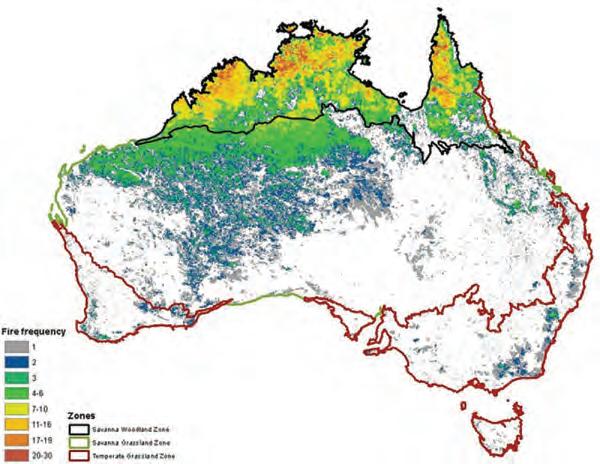
Emissions into the environment that cause climate change come from various sources associated with the production, use and disposal of goods or services. Trends in the levels of these emissions from each source also helps to throw some light on whether economic activity is becoming more sustainable. • Emissions by origin: Figure 8.8 shows historical and projected changes in emissions originating from different sources (i.e. waste, industrial processes, agriculture, combustion, power, and transport). Of these, electricity generation, direct combustion and agriculture have been mostly responsible. While overall levels are coming down for electricity because of the switch from coal to renewables, there is little change in most other areas. FIGURE 8.8 Trends in Australia’s actual and projected CO2 emissions (metric tonnes) by their source 20052006200720082009201020112012201320142015201620172018201920202021202220232024202520262027202820292030 100 –100 200 300 400 500 600 700 Historical emissions Projected emissions Waste Industrial processes Fugitives Agriculture Direct combustion Transport Electricity LULUCF Source: Australian government, ‘Prospering in a low-emissions world: An Updated Climate Policy Toolkit For Australia’, March 2020, page 36, see https://www.climatechangeauthority.gov.au/sites/default/files/2020-09/ Prospering%20in%20a%20low-emissions%20world.pdf. • Number of hot days and bushfires: Climate change has made living in Australia more challenging. For example, Figure 8.9 (part 1) shows the sharp increase in the number of days with extreme temperatures. Note the rise especially since the 1980s. Figure 8.9 (part 2) reveals that frequency of bushfires by region. For instance, on the map, the grey shaded areas along Australia’s east coast have bushfires annually or every couple of years. Many are sparked by high temperatures and extreme weather events linked to climate change. 0 UNCORRECTED PAGE PROOFS
Graph 1 – Frequency of extreme heat events in Australia 1910–2020
Advertisement
30
1910 1920 1930 1940 1950 1960 1970 1980 1990 2000 2010 2020 5 10Number of days each year where the Australian daily area-averaged mean temperature is extreme 15 20 25 Sources: Temperature data, BOM; graph from Australian Government, Climate Change Authority Report, 2020, page 2, see https://www.climatechangeauthority.gov.au/prospering-low-emissions-world-updatedclimate-policy-toolkit-australia#:~:text=The%20report%20presents%2035%20recommendations,and%20 land%2C%20and%20waste%20sectors. Graph 2 – Frequency of bushfires by region, Australia (average number of years between fires) Source: Australian government, Department of Industry, Science, energy and Resources (figure 1), see https://www.industry.gov.au/data-and-publications/estimating-greenhouse-gasemissions-from-bushfires-in-australias-temperate-forests-focus-on-2019-20 0 UNCORRECTED PAGE PROOFS Resources
Resourceseses
To come
Students, these questions are even better in jacPLUS
Receive immediate feedback and access sample responses Access additional questions Track your results and progress
Find all this and MORE in jacPLUS
8.3 Exercise 8.3 Quick quiz 8.3 Exercise 1. Explain how each of the following measures can tell us something about whether economic growth is environmentally sustainable: a. Global surface temperatures (1 mark) b. CO2 emissions per capita (1 mark) c. Ecological footprint. (1 mark) 2. Rapid increases in real GDP per person has led to environmental damage. a. Explain how GDP growth has led to global environmental damage. (2 marks) b. Referring to Figure 8.10, identify the countries that are mostly responsible for environmental damage. (1 mark) FIGURE 8.10 Changes in GDP per capita across global regions GDP per capita, 1820 to 2018 GDP per capita adjusted for price changes over time (inflation) and price differences between countries – it is measured in international-$ in 2011 prices. Western offshoots United States, Canada, Australia and New Zealand Western Europe Eastern EuropeSource: Our World in Data, see https://ourworldindata.org/grapher/gdp-per-capita-maddison-2020. UNCORRECTED PAGE PROOFS Middle East East Asia World Latin America
South and South-East Asia
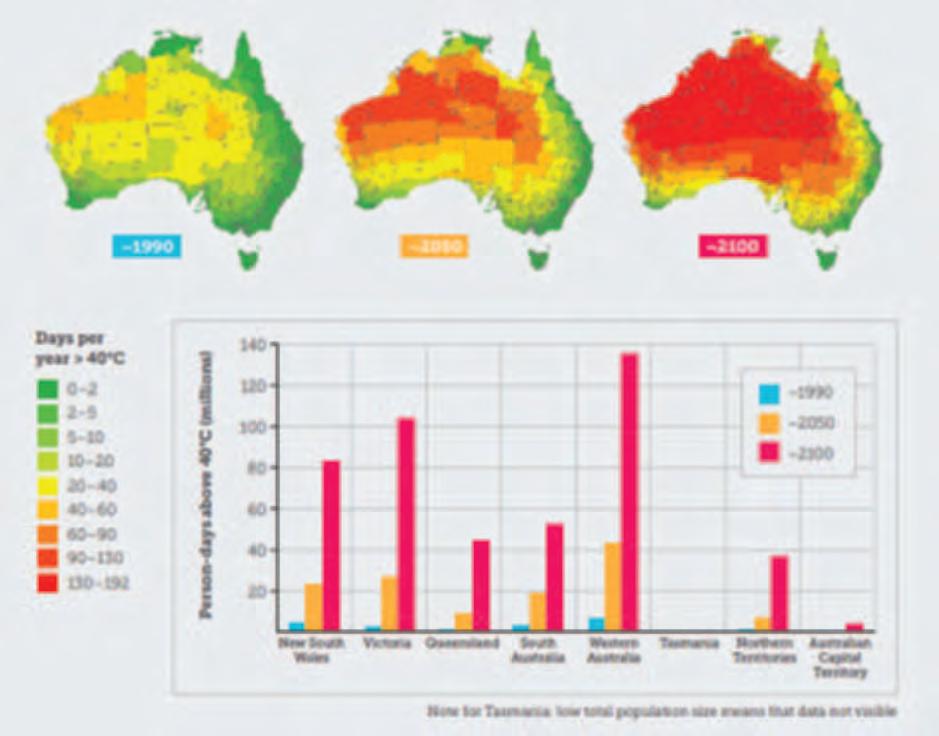
c. The rise in global surface temperature can be an indicator that economic growth has not been sustainable. Identify and outline four problems that rising global surface temperature has created. (4 marks) d. If the growth rate in global GDP slowed (e.g. 2020) and, at the same time, the rate of population growth also slowed by the same percentage, explain how this would be likely to affect: • the level of environmental damage (2 marks) • average material living standards. (2 marks) 3. Examine Figure 8.11 showing actual and forecast rises in the number of days each year in Australia, with temperatures over 40 degrees Celsius. FIGURE 8.11 Forecast changes in the number of days each year in parts of Australia with temperatures over 40 degrees Celsius (1990, 2050, 2100) Source: Climate Council, Figure 11, page 21, see https://www.climatecouncil.org.au/uploads/7579c324216d1e76e8a 50095aac45d66.pdf. a. Looking at the three maps of Australia and the column graph, describe the forecast changes, given a high emissions scenario and the failure to limit global emissions. (2 mark) b. Looking at the column graph, identify the two states that are expected to suffer most, and the two states that are expected to suffer least from days of high temperatures if emissions are not limited. (2 marks) Fully worked solutions and sample responses are available in your digital formats. UNCORRECTED PAGE PROOFS