23 minute read
8.3 Measures of the environmental sustainability of economic activity


We will examine some of these serious environmental impacts of economic growth that economists call, negative externalities. These are costs associated with the production and consumption of goods and services that are not paid by those involved with these economic activities. Instead, they are unfairly passed on to other third parties who must bear the consequences. Negative externalities are an example of market failure — a situation where the free operation of demand and supply and the price system has not directed resources efficiently into areas that help to maximise the general long-term wellbeing of society. In response to mounting environmental challenges and the worry of resource depletion caused by global economic growth, the question of environmental sustainability has become a hot topic for discussion. Given vital and scarce environmental resources (for example, stable climatic conditions, clean air, unpolluted oceans and rivers, vigorous natural forests, wild fish stocks, biodiversity, and the natural ecosystems needed to process waste and maintain the planet’s health) the question now arises — can economic growth be sustainable into the future? Because environmental issues are getting worse, momentum for change has recently strengthened. It is in this area that environmental economics can make valuable contributions to help shape policy responses designed to ease the problem. 8.1.2 What you will learn KEY KNOWLEDGE Use each of the following points from the VCE Economics Study Design as a heading in your summary notes. • the definition of the selected economic issue, including relevant measures and statistical indicators • the reasons the issue is of importance to the economy at a local, national and international level • the economic factors influencing the extent of the selected economic issue • the different perspectives of households (consumers and workers), business, government and other relevant economic agents regarding the selected economic issue • the economic responses undertaken by relevant economic agents at a local, national and international level, to address the economic issue, including government policies KEY SKILLS • define key economic concepts and terms and use them appropriately • gather, synthesise and use economic information from a range of sources to analyse economic issues • identify trends, patterns, similarities and differences in economic data and other information to draw conclusions • evaluate the economic responses undertaken to address economic issues Source: VCE Economics Study Design (2023–2027) extracts © VCAA; reproduced by permission. Resources UNCORRECTED PAGE PROOFS
Resourceseses
Advertisement
Digital document Key terms glossary (doc-37981)
8.2 Definition and general nature of environmental sustainability
KEY KNOWLEDGE
• the definition of environmental economics and relevant measures and statistical indicators
Source: VCE Economics Study Design (2023–2027) extracts © VCAA; reproduced by permission. For many years now, governments both here and around the world have been keen to increase material living standards by growing GDP at a faster rate than the population. While strong economic growth has lifted many out of poverty, it has come at a great cost to the environment on which it ultimately depends. Figure 8.1 uses a variation on the basic two-sector circular flow model to illustrate the main relationships between economic activity and the environment. FIGURE 8.1 Using a simple circular flow model to show the interaction between economic activity and the environment Flow 4 = The supply of finished goods and services or GDP Flow 2 = The nation’s flow of all incomes paid Flow 1 = The supply of labour and capital resources Flow 5 = The natural and environmental sector = The common or collective ownership of environmental resources (e.g. climate, air, oceans, rivers, forests, wild fish stocks, biodiversity, and ecosystems) means that without regulation, they are free and have no price, even though they are valuable and needed to sustain a healthy planet, process wastes, and enable economic activities. Flow 3 = The value of household consumer spending on goods and services Consumer/ Household sector Disposal of household waste Environmental inputs that are used up Envir onmental inputs that ar e used up Disposal of business waste Producer/ Business sector Referring to this new version of the circular flow model, you might notice the following features: • There are two main sectors — the consumer or household sector, and the business or producer sector. • Essentially, there are four main flows that are interdependent and equal in value: • Flow 1 — the total value of capital and labour resources supplied by the household sector UNCORRECTED PAGE PROOFS • Flow 2 — the total value of incomes paid to the people selling resources • Flow 3 — the total value of household or consumer spending on goods and services • Flow 4 — the total value of finished goods and services supplied or produced (GDP). • However, an additional sector has been added called the natural and environmental sector. This part shows the two-way interactions between economic activity and the natural environment. Here,
environmental resources needed for survival are used by both households and businesses. For example, there are renewable resources found in nature that can be replenished or replaced over a fairly short period of time. Here we think of some plants and animals, and solar and wind energy. There are also nonrenewable resources or inputs that cannot be readily replaced once they have been used up. They take millions of years and special geographic conditions for their formation, and might include minerals like oil, coal and iron ore, old growth forests and natural beauty spots. And then there are environmental resources that make the earth unique and support life and economic activities. These comprise of stable climatic conditions, clean air, unpolluted oceans and rivers, vigorous natural forests, wild fish stocks, biodiversity, and the natural ecosystems needed to process waste and maintain the planet’s health. • Importantly, too, the environment is also a dumping ground where all waste and rubbish ends up. Indeed, everything that has ever been produced (total world GDP over time) will end up here; although, of course, it may change its form. Over a lifetime the average Australian, for example, generates over 60 tonnes of waste. • Unlike other resources shown in Fllow 1, environmental resources are usually seen as free inputs that have no price and are there to be used by all. This makes them very attractive and leads to their overuse and eventual depleted quality. • For economic growth to be sustainable so future generations do not have reduced opportunities, the use and disposal of natural and environmental resources need to be managed very carefully. Armed with a general background about the relationship between economic activity and the environment, it is now possible to define the central focus of this option — environmental sustainability. There are many definitions of environmental sustainability, but here are just five: • Sustainable economic growth is commonly defined as ‘a method of expanding the economy’s production levels to meet the needs for goods and services of the present population, without undermining the ability of future generations to meet their needs’. • Put yet another way, environmental sustainability is ‘an economy where production is in equilibrium or balance with the environment and its ecological support systems’. • Environmental sustainability would mean that ‘the rates of harvesting renewable resources, creating pollution, and depleting non-renewable natural resources as a result of increasing economic prosperity, can be continued indefinitely into the future’. • Environmental sustainability can be defined as the ‘responsible interaction with the environment to avoid depletion or degradation of natural resources and allow for long-term environmental quality’. • Finally, environmental sustainability is ‘the practice of interacting with the planet responsibly, so as not to deplete natural resources that would undermine the future generation’s ability to meet their daily needs’. We now know what environmental sustainability involves. However, some of you are probably wondering, what level of economic activity or GDP might be seen as sustainable? This is a tricky question to answer since, as we shall see, it depends on many things including: • the rate of population growth • the types of goods and services that are produced and, at the end of their life, how they are disposed • advances in technology. In 1972, a group of economists called The Club of Rome pointed out that the world’s natural resources are finite or limited. They hence recommended a ‘zero rate of economic growth’. Pursuing zero GDP growth would have had massive and often negative effects on our lives, given the rapid growth in global population. It would have been especially disastrous for people in low-income countries already struggling to survive. Today, this environmental debate has shifted in at least three main ways: • First, it is less focused on stopping economic growth. Instead, there is a drive toward renewable energy. UNCORRECTED PAGE PROOFS
This is to reduce our reliance on the burning of fossil fuels that generate CO2 emissions linked with global warming, and more frequent and severe weather events that, in turn, seriously threaten material and nonmaterial living standards.
• Second, there is now a gradual shift towards making greener products that can be recycled at the end of their useful life, creating a circular economy. This helps to slow the demand for scarce, non-renewable resources. It also reduces waste that often pollutes waterways and destroys ecosystems. • Third, greater importance is being attached to slowing population growth by empowering women through education and family planning. This helps to ease the pressure on resources.
Whilst these changes are a welcome step in the right direction and can help promote more sustainable economic growth, underlying challenges remain. For example, there is growing inequality in the way the benefits of higher output are shared between nations. The small minority of the world’s 7.9 billion people living comfortably in high-income countries consume most of the available resources. They also produce the greatest damage to the planet including climate change from CO2 emissions. In these rich countries, there is a general obsession with materialism — that is, the mindless consumption of even more goods and services. At the same time, these societies often neglect the satisfaction that can be gained from non-material cultural and social aspects that can enhance society’s wellbeing and happiness, with far less environmental damage.
Resourceseses
Resources
To come 8.2 Activities
Students, these questions are even better in jacPLUS
Receive immediate feedback and access sample responses Access additional questions
Track your results and progress Find all this and MORE in jacPLUS 8.2 Exercise 8.2 Quick quiz 8.2 Exercise 1. a. Describe the two main ways in which economic activity depends heavily on the environment. (2 marks) b. Explain why most governments have been keen to promote strong economic growth and increase GDP. (2 marks) c. Identify and outline the likely environmental impacts for an economy of increasing the level of GDP. (3 marks) 2. Giving examples of each, distinguish the terms, renewable resources and non-renewable resources. (2 marks) 3. If there is equilibrium between the environment and the economy, economic activity can go on forever. a. Explain the meaning of environmental sustainability. (2 marks) b. Explain why the Club of Rome suggested that there should be a zero rate of global economic growth. (2 marks) c. Outline how the use of renewable energy, rather than the burning of fossil fuels, can substantially reduce the problems associated with climate change. (2 marks) d. Outline how a circular economy could work to help reduce environmental problems. (2 marks) Fully worked solutions and sample responses are available in your digital formats. UNCORRECTED PAGE PROOFS
KEY KNOWLEDGE
• measures of the environmental sustainability of economic activity
Source: VCE Economics Study Design (2023–2027) extracts © VCAA; reproduced by permission. As the following extract from a book written in 1971 vividly explains, the world’s environmental decline is a phenomenon that people have created.
To emphasise the effect of man on the earth, let’s condense the 4.5-billion-year age of earth into just one year. On this scale, the earth came into being at precisely midnight on December 31st. We know almost nothing about what went on during the next eight months. It was not until December the 15th on the twelfth month of this condensed year, that plants and dinosaurs became established. Man appeared on the scene at about 8.00 pm on December 31st, animals were extensively domesticated by about 35 seconds to midnight on the 31st December, Columbus arrived in America about 3 seconds to midnight and the Industrial Revolution began around one second to midnight! Yet the environmental damage man has wrought in this last second of our year, is almost unbelievable! Source: E. E. Inyden, Please Stop Killing Me, New American Library, NY, 1971, pp. 117–8. It is especially important to track changes in environmental sustainability in order to identify problem areas and evaluate the success or otherwise of the government policies to reduce damage. So how should we assess whether economic activity is environmentally sustainable? 8.3.1 Measures of the environmental sustainability of global economic activities Trends in environmental sustainability are usually measured by looking at a range of statistical indicators that reveal changes in the extent of harm caused by economic activity. Table 8.1 lists some of the data available and what to expect if global environmental sustainability is improving or deteriorating. However, like many measures, indicators do not always tell the whole story and the quality of data is variable.
TABLE 8.1 Some possible indicators of changes in the environmental sustainability of economic growth
Some indicators of increasing environmental sustainability Some indicators of decreasing environmental sustainability
1. A fall in the total number of tonnes of global CO2 emissions and a smaller carbon footprint 1. A rise in the total number of tonnes of global CO2 emissions and a bigger carbon footprint 2. A fall in the total level of global CO2 emissions for each dollar of GDP produced
2. A rise in the total level of global CO2 emissions for each dollar of GDP produced 3. A fall in the average global surface temperature 3. A rise in the average global surface temperature 4. Reduced electricity consumption per capita 4. Increased electricity consumption per capita UNCORRECTED PAGE PROOFS 5. A rise in the Environmental Performance Index 5. A drop in the Environmental Performance Index
6. An increase in rates of waste recycling 6. A decrease in rates of waste recycling
(continued)
Some indicators of increasing environmental sustainability Some indicators of decreasing environmental sustainability
7. A decrease in the ecological footprint measured in terms of the number of earths required for resources to sustain current living standards 7. An increase in the ecological footprint measured in terms of the number of earths required for resources to sustain current living standards
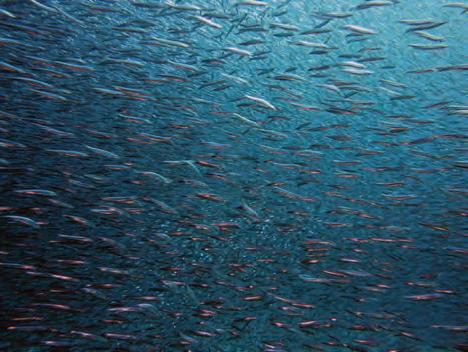
Changes in total world CO2 emissions and the link with global warming and reduced crop yields Changes in global CO2 emissions that result from the burning of fossil fuels like coal and oil and the production of cement, is a starting point for assessing environmental sustainability. As shown in Figure 8.2 (part 1), CO2levels are measured in tonnes so the changes can be plotted over time. Notice that with very few exceptions (other than during the 1930s Great Depression and the COVID-19 pandemic in 2020 when economic activity slowed) CO2 emissions have increased exponentially (especially from the golden age of economic growth starting in the 1950s). Scientists believe that the increase in CO2 emissions into the atmosphere act like a blanket. They limit the escape of heat into space and hence explain the worrying rise in average global temperatures that are shown in Figure 8.2 (part 2). In other words, economic activity has led to climate change with its negative effects. These include problems associated with the 20 centimetre rise in sea levels since 1900. It is also linked with an increased frequency and severity of weather events like cyclones, drought, extreme temperatures, bushfires, and floods that destroy life and property. Furthermore, climate change has been blamed for the 21 per cent fall in agricultural productivity worldwide over the last 40 years, partly offsetting the advances in farming. The decline in average crop yields is shown in Figure 8.2 (part 3). This means that for many in low-income countries, there is an increased risk of poverty and reduced food security.
FIGURE 8.2 Changes in global CO2 emissions and average global temperature, linked with economic activity Part 1 – Change in global CO2 emissions resulting from the burning of fossil fuels for energy to power economic and other activities 35 billion t 30 billion t 25 billion t 20 billion t 15 billion t 10 billion t
Annual CO2 emissions Carbon dioxide (CO2) emissions from the burning of fossil fuels for energy and cement production. Land use change is not included. World UNCORRECTED PAGE PROOFS
5 billion t
0
1750 1800 1850 1900 1950 2020
Part 2 – Charges in the average global surface temperature that has added to the frequency and severity of extreme weather events largely reflects human activities 1.0
0.8 Difference from 1901–2000 average (ºC) –0.6 –0.4 –0.2 0 0.2 0.4 0.6 –0.8 –1.0 1880 1900 1920 1940
Years Yearly surface temperature compared to the 20th-century average from 1880–2020. Blue bars indicate cooler-than-average years; red bars show warmer-than-average years. NOAA Climate.gov graph, based on data from the National Centers for Environmental information. 1960 1980 2000 2020 Source: Climate Change: Global Temperature, by Rebecca Lindsey and Luann Dahlman, Reviewed by Jessica Blunden, Published March 15, updated August 12, 2021. Change in growth duration (days) 10 5 Maize Winter wheat –5 –10 Change in growth duration (days) 10 5 Spring wheat Soybean 0 –5 –10 1980 1985 1990 1995 2000 2005 2010 2015 2020 Year
0
Part 3 – Declining agricultural crop yields 1980–2020 UNCORRECTED PAGE PROOFS
Rice Annual global area-weighted change in growth duration The running mean over 11 years (5 years forward and 5 years backward) in growth duration 10 5Change in growth duration (days) 1980 1985 1990 1995 2000 2005 2010 2015 2020 Year 0 –5 –10 Note: Change in the number of crop growth days is relative to the 1981–2010 global baseline average and is used as a substitute for productivity. The red line on each graph represents the annual global area-weighted change in the days of crop growth. The blue line represents the running mean change in crop growth duration. Source: Lancet, Vol 398, Oct 30, 2021, The 2019 Lancet Countdown on health and climate change, P1632, https://www.thelancet.com/pdfs/journals/lancet/PIIS0140-6736(21)01787-6.pdf Environmental Performance Index (EPI) The Environmental Performance Index (EPI) is a general measure that uses data relating to environmental health (i.e. based on air quality, water quality, heavy metals, biodiversity, forests and fisheries), as well the vitality of ecosystem (i.e. based on CO2 and other greenhouse gas emissions, treatment of water waste, and nitrogen management in agriculture). These measures from 180 countries are weighted according to their relative importance and then combined to produce a single index where a score of 100 points shows perfect environmental sustainability. The approach used for this index is similar to that first used by the UN in 2002, as part of its sustainable environmental target for its Millennium Development Goals. The map shown in Figure 8.3 displays the updated results for 2020. While Australia scores relatively well, there are clearly severe humaninduced environmental problems in South America, Africa, the Middle East, and Asia (the brown areas). Here, a low index suggests that economic activity is not sustainable. FIGURE 8.3 Countries grouped by their Environmental Performance Index (EPI). UNCORRECTED PAGE PROOFS

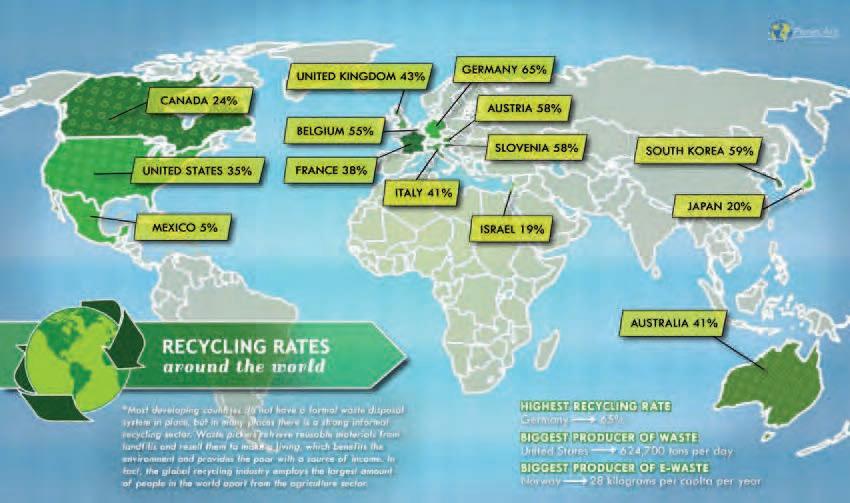
Waste from households and businesses normally ends up in the environment. Degradable items will eventually be broken down by natural environmental processes. However, some waste is not easily degradable and may poison waterways, destroy ecosystems, and end up in the food chain. Recycling of waste helps to reduce the impact of economic activity on the environment and biosphere, where it would otherwise end up. Figure 8.4 illustrates the huge differences in waste recycle rates between countries, with Germany leading the way. In addition, some businesses are making their products so that a higher proportion of materials can be recycled. This is helping to create a more sustainable circular economy, reducing the stress on the environment. FIGURE 8.4 Comparisons of waste recycling across selected countries FPO UNCORRECTED PAGE PROOFS

Source: Planet Aid Organisation, see https://www.planetaid.org/blog/global-recycling-rates.
Coal is the biggest source of energy to power homes and enable the growth of industry and economic activity. As such, it is the largest source of CO2 emissions and other greenhouse gases, making it a significant driver of climate change.
Figure 8.5 shows the actual change in the world’s energy dependence on coal, from 2010 and 2020. Notice the fall from 41 per cent in 2014 to 35 per cent in 2020. Interestingly, the graph also shows the projected decline in reliance on coal-fired electricity for the period, 2020–2050, along with a dramatic rise in non-fossil, renewable power from 33 per cent in 2010 to an expected 99.6 per cent by 2050. Indeed, without a switch from coal to renewables, the widely adopted net zero CO2 emissions target will not be reached by 2050.
FIGURE 8.5 The actual and forecast change in the global energy mix away from fossil power towards non-fossil power 0 2010 2020 2030 2040
Non-fossil power Unabated coal 2050 20 40 60 80 100 % Source: International Energy Agency (IEA), see https://www.iea.org/reports/coal-fired-power. Ecological footprint — how many earths are needed to provide the resources? Resources are needed as inputs to enable the growth in the output of goods and services. With the explosion of global population and a desire to enjoy higher material living standards, the demand for renewable and nonrenewable natural and environmental resources has increased. This has depleted the available supply and there is competition for those that remain. Around 30 years ago, the concept of the world’s carrying capacity was developed although it was later renamed the ecological footprint. Putting it simply, the ecological footprint relates to the quantity of environmental resources needed to produce the quantity of goods and services to support a particular lifestyle or living standard. Based on United Nations data (e.g. carbon use, and land area used for cities, cropping, fishing, forests, grazing etc.) it is updated annually. Calculations simply add up the human demands for environmental resources that compete for the earth’s ability to regenerate and remain sustainable into the future. The concept of the ecological footprint is illustrated in Figure 8.6 (part 1). Despite having some shortcomings, the ecological footprint does help to shape government policy at the national and international level. It helps to make people far more aware of the extent to which their lifestyle and material UNCORRECTED PAGE PROOFS living standards could be replicated by others. As shown in Figure 8.6 (part 2), comparisons between countries of ecological footprints highlight the huge inequalities in the consumption of the world’s scarce resources. By way of example, for everyone to enjoy Australian living standards we would need the resources of 4.1 earths. Clearly, there is a shortfall or an environmental deficit (i.e. the demand is greater than the available supply) where the earth’s ecosystems and biosystems are unable to remain in balance. In contrast, if everyone had a lifestyle of the average Indian, we would need just 0.7 earths.
Part 1 – The concept of an ecological footprint relates to how much nature we have (the supply of resources that are also needed to absorb our waste, especially CO2) and how much nature we use (the demand for resources). The ecological footprint Measures how fast we consume resources and generate waste

Energy Settlement Timber & paper Food & fiber Seafood Compared to how fast nature can absorb our waste and generate new resources. Carbon footprint Built-up land Forest Cropland & pasture Fisheries
Source: Global Footprint Network, see https://www.footprintnetwork.org/our-work/ecological-footprint/. Part 2 – The environmental footprint of selected countries (in terms of the environmental resources of the planet required) How many Earths do we need If the world’s population lived like... U.S.A. Australia South Korea Russia Germany Switzerland U.K. France Japan Italy Spain China Brazil India World

5.0 4.1 3.5 3.3 3.0 2.9 2.9 2.8 2.8 2.6 2.3 2.2 UNCORRECTED PAGE PROOFS 1.8 0.7 1.7

Sources: Original data from Global Footprint Network, National Footprint Accounts, 2018, but above image copied from Wikipedia, see https://en.wikipedia.org/wiki/Ecological_footprint
2
1.5
Number of earths 1
0.5
0 196119631965196719691971197319751977197919811983198519871989199119931995199719992001200320052007200920112013201520172018 Ecological footprint Biocapacity Ecological deficit Ecological reserve Source: Global Footprint Network, 2022, National Footprint and Biocapacity Accounts, see https://data.footprintnetwork.org/?&_ ga=2.86826584.1590359106.1651877490-908330195.1651617156#/countryTrends?cn=5001&type=earth It is also possible to track trends in the world’s overall environmental footprint. Figure 8.6 (part 3) shows that since 1961, the environmental footprint of humanity (see the red line) has increased by around 2 per cent a year. It has switched from having a surplus or spare capacity in 1961 (see the green shading), to a growing deficit since 1971 (see the red shading) in terms of the number of earths (shown on the vertical axis) required for biosystems and ecosystems to remain in balance. We now need about 1.75 earths at current average material living standards. 8.3.2 Measures of the environmental sustainability for Australia There are many measures of the extent to which Australia’s economic activities are environmentally sustainable. Here are just a few: Changes in Australia’s per capita CO2 emissions and emissions per dollar of GDP In most countries, the growth in GDP and economic activity are linked with higher CO2 emissions, although some countries are starting to break this relationship by burning less fossil fuels (e.g. coal, oil and gas) that cause climate change. In this regard, Figure 8.7 (part 1) shows that since 1990, Australia appears to have made substantial progress in improving its environmental sustainability. Despite the rapid increase in Australia’s population over the period, CO2 emissions per person have come down by around 45 per cent and, even more impressively, despite strong GDP growth CO2 emissions per dollar of GDP have fallen by about 65 per cent! This represents an increase in how efficiently goods and services are produced — more environmentally sustainable output from fewer inputs.UNCORRECTED PAGE PROOFS
Part 1 – The general downward trend in CO2 emissions per person (LHS) and CO2 emissions per dollar of real GDP (RHC)
35
t CO -e per person 15 20 25 30 10 1990 1995 2000 2005 2010 2015 2020 0.7 0.6 0.5 0.4
kg CO 2 0.3 -e per $ of real GDP 0.2
Emissions per capita Emissions per dollar of real GDP Source: Australian government, Department of Industry, Science, Energy and Resources, 2021, Australia’s latest greenhouse gas emissions, quarterly update, August 2021, https://www.industry.gov.au/data-and-publi cations/national-greenhouse-gas-inventory-quarterly-update-march-2021. Part 2 – Countries with the highest CO2 per capita emissions resulting from the burning fossil fuels 30 25 20
Africa Americas Asia Eurasia Europe Oceania Global average 15 10 5 0 QatarKuwaitGibraltarBahrain UAEBruneiCanadaAustraliaLuxembourgSaudi ArabiaUnited States OmanCuraçaoTrinidad andTobagoTurkmenistan Metric tons of CO 2 Source: Union of Concerned Scientists, 2021, see https://www.ucsusa.org/resources/each-countrys-share-co2emissions However, despite this progress, Figure 8.7 (part 2) shows that relative to other countries, Australia is still the eighth highest emitter of CO2 per capita. Clearly, we are not pulling our weight and further action is needed to make economic growth more sustainable. 2 UNCORRECTED PAGE PROOFS


