14 minute read
7.5 Economic factors affecting income and wealth inequality in Australia


Graph 1 Inequality in Australia’s mean equivalised weekly disposable income by quintile
Australia’s income cake, purchasing power, consumption and material living standards are distributed very unevenly
Advertisement
Quintile 1 = $399
Quintile 2 = $664 Quintile 3 = $902
Quintile 5 = $2 142 Quintile 4 = $1 204 0.0 Slovak republicSlovenia Czech republicIcelandNorwayBelgiumDenmarkFinlandAustriaSwedenPolandHungaryGermanyFranceIreland NetherlandsCanadaEstonia LuxembourgGreecePortugalSwitzerlandRussiaSpainAustraliaItalyJapanRomaniaLatviaKoreaIsrael Lithuania United KingdomUnited StatesTurkeyBulgariaMexicoChile Costa RicaSouth Africa 0.1 0.2 0.3 0.4 0.5 0.6 0.7 Graph 2 Australia’s Gini coefficient compared with other countries UNCORRECTED PAGE PROOFS
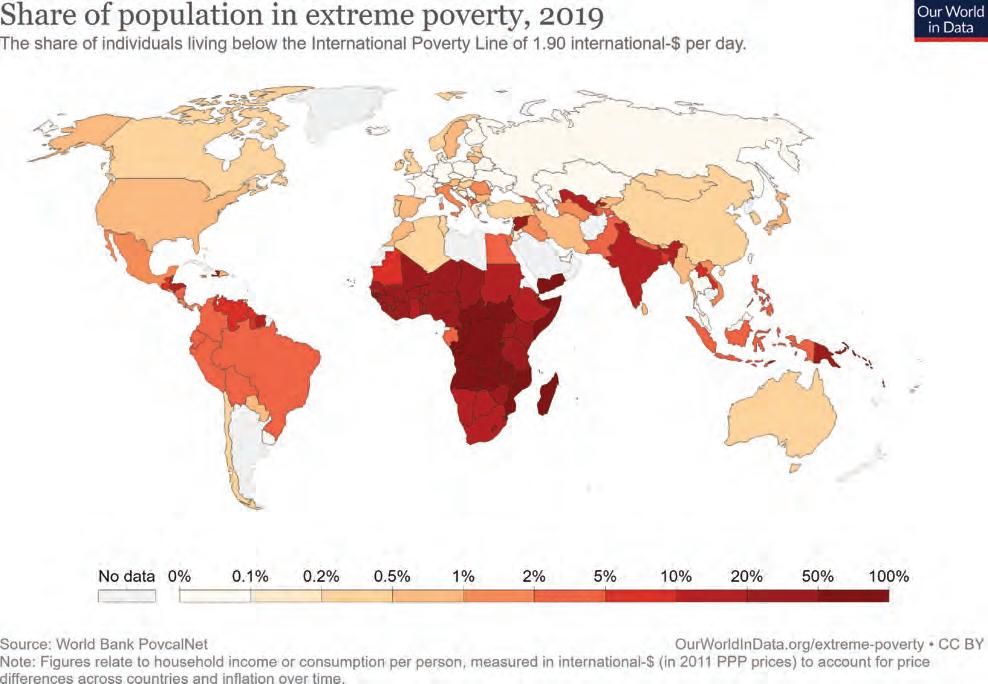
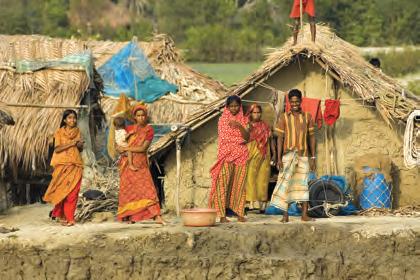
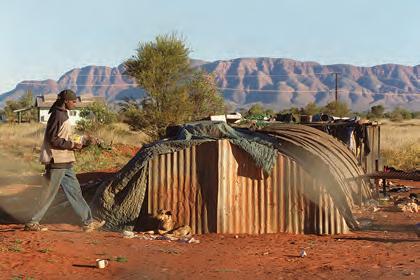
Sources: Graph 1, data derived from ABS, see https://www.abs.gov.au/statistics/economy/finance/household-income-and-wealth-a ustralia. Graph 2, data downloaded from OECD Data, Income inequality, see https://data.oecd.org/inequality/income-inequality.htm. Graph 3, downloaded from Our World in Data, 2019, https://ourworldindata.org/extreme-poverty. Referring to figure 7.16, several points can be made about the effects of inequality: • Graph 1 shows that for Australia the income cake is cut up or distributed very unevenly. Those in quintile 1 on median weekly incomes of $399 per week would struggle to buy basic goods and services like food, housing, electricity and medical care needed for survival. Most would have incomes below the poverty line. In contrast, those in quintile 5 on $2142 per week would do far better and have money left over to afford luxury items including nice clothes and holidays in exotic locations. Clearly material living standards would differ widely. • Graph 2 shows that Australia’s distribution of income, based on our Gini coefficient of 0.33, is not as equal as the Slovak republic with 0.22. However, it is not as lopsided as in some countries like Mexico, Chile, Costa Rica, and South Africa where the Gini rises to 0.62. Clearly in these highly unequal societies where incomes are relatively low in the first place, many would be unable to enjoy reasonable living standards, while the minority at the top is able to live very comfortably. • Graph 3 shows the distribution of extreme poverty around the world where people try to survive on an income of less than $1.90 per day. Here, life would be most uncertain with few opportunities for improvement. • Adequate food and nutrition cannot be purchased, and individuals are commonly unnourished and have a UNCORRECTED PAGE PROOFS short life expectancy. • Because of the cost and the lack of educational facilities, few children attend school. Restricted or no access to education (especially for young females) causes limited employment and income opportunities. It also depresses productivity and cuts the country’s productive capacity. • There is a lack of affordable medical treatment available for serious illnesses. Life expectancy is low, perhaps around 50 years, and infant death rates are high.
• Without much money, housing is basic and overcrowded, with an average of more than four people living in each room. Sanitation and access to safe drinking water are non-existent.
On a brighter note, over the last 10–15 years recent government policies to reduce inequality and promote increased production have helped to halve the number living in poverty.
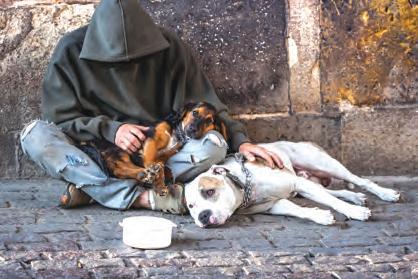
7.4.2 The importance and effects of poverty and inequality on non-material living standards, locally and internationally Most people don’t choose to be poor and live in poverty. Why would they? Having little money not only limits consumption and leads to poverty, it also significantly undermines non-material living standards and contributes to sadness, violence, crime, a lack of opportunity, wasted talent, and a short life-expectancy. In addition: • Low income and poverty mean that finding affordable housing is an impossible challenge for some. Many individuals (including children) are homeless and live with insecurity on the streets or are forced to reside on the outskirts of cities where there is no public transport, little to do and few jobs available. • When people look shabby, lack personal grooming, or have few skills, it is hard to gain employment. This can begin the cycle of poverty and welfare dependency. In addition, at the macroeconomic level, the exclusion of potential workers slows the economy’s productive capacity and limits future living standards. • Children from poor families are often reluctant to go to school without a lunch, books, uniform or shoes. They cannot afford to play sport, go on excursions or camps like the others, and frequently experience bullying. The likelihood of completing VCE and especially a tertiary course is greatly reduced in such circumstances. At the macroeconomic level, this lowers Australia’s future labour productivity and limits our productive capacity, potential GDP and living standards. UNCORRECTED PAGE PROOFS • The self-esteem of both parents and children is destroyed and there are feelings of despair and failure, resulting in mental illness, possibly substance and alcohol abuse, and violence. Poverty also results in reduced health outcomes and, according to the ABS, perhaps increased crime.

• There is isolation and reduced social contact, often because of a disreputable appearance and reluctance to mix with other people or groups. This leads to unhappiness and a lower quality of life. • Poverty and extreme inequality alienate people. It erodes social cohesion needed for a workable society, and it poses a serious threat to democracy, freedom, and stability.
7.4 Activities
Students, these questions are even better in jacPLUS
Receive immediate feedback and access sample responses Access additional questions
Track your results and progress Find all this and MORE in jacPLUS 7.4 Exercise 7.4 Quick quiz 7.4 Exercise 1. Explain how poverty and low incomes affect material and non-material living standards in Australia and low-income countries in Africa, India, Asia and South America. (4 marks) 2. a. Imagine you are a single unemployed parent, with two children aged 12 and 14, wanting to rent a flat. Use the Centrelink weblink in the Resources tab to research what you would receive as your welfare benefit per fortnight. Also use the internet to research the cost of renting a flat in your area or city and paying other bills. (2 marks) b. Prepare a fortnightly budget using the following format: (4 marks) Your income (money coming in) per fortnight $ $ $ Total income per fortnight Your expenses (money going out) per fortnight $ $ $ $ $ $ $ Total expenses or costs per fortnight $ c. Use your fortnightly budget to describe how your financial position effects your material and non-material living standards of your income. (3 marks) d. Identify not-for-profit private welfare agencies that may be able to assist you. (2 marks) Fully worked solutions and sample responses are available in your digital formats. $ UNCORRECTED PAGE PROOFS
7.5 Economic factors affecting income and wealth inequality in Australia
KEY KNOWLEDGE
• the economic factors influencing the extent of the selected economic issue
Source: VCE Economics Study Design (2023–2027) extracts © VCAA; reproduced by permission. As we shall see, there are many factors (including those shown in figure 7.17), causing poverty and inequality in Australia’s distribution of income and wealth, which in turn impacts living standards.
FIGURE 7.17 Some causes of income inequality and poverty in Australia 1. Factors affecting the operation of the labour market causes wage inequality 5. Personal and other factors including luck, work 2. Employment, ethic, age, overseas unemployment, conditions, inflation casualisation, and and the application hours worked of technology. 4. Inheritance 3. Education, training of wealth and skills
Factors influencing inequality in the distribution of income and wealth UNCORRECTED PAGE PROOFS
7.5.1 The operation of forces in the labour market cause wage inequality
The most important cause of wage inequality in Australia is the normal operation of the labour market. In a free or unregulated market, wages simply represent the equilibrium price paid for labour. This is determined at market equilibrium by the conditions of demand for labour (i.e. the D by businesses and indirectly by consumers who buy goods and services), relative to the conditions of supply of labour (S by members of the household sector). As a result, wage rates will be either higher or lower so as to reflect the relative scarcity of each occupation in that area or region of the country. Figure 7.18 shows, hypothetically, how wage rates for high-paid labour (graph 1) and for low-paid labour (graph 2) are determined in an unregulated labour market, through the operation of D and S.
FIGURE 7.18 How the demand and supply of labour in an unregulated labour market cause wage inequality, that reflects the relative scarcity of different occupations Graph 1: The market for high-paid labour Supply of labour (S)
Wage = 3000 Weekly wage ($) Demand for labour (D) Quantity (Q) Quantity of labour
Weekly wage ($) Quantity of labour Supply of labour (S) Demand for labour (D) Graph 2: The market for low-paid labour Wage = 400 Quantity (Q) Graph 1 — High-paid labour: High-paid jobs (e.g. $3000 per week) are those where there is a strong demand relative to a low supply of labour at a given wage. Here we might think of successful AFL footballers, pop stars, CEOs, lawyers or ICT innovators. • The limited supply of labour at a given wage could reflect: • the need for special talent to perform the work • high educational or training qualifications and skills • a low likelihood of success in mastering the required skills • substantial on-the-job experience is required • unattractive working conditions (e.g. long hours, dangerous or unpleasant environment) • very high levels of personal responsibility and care (e.g. brain surgeons, air traffic controllers). • The relatively strong demand for labour at a given wage may be the result of: • the high level of efficiency or value of the output produced by the worker • a robust demand driven by current fashions and tastes (e.g. some pop stars and sporting heroes) • technological advances that cause increased demand for a new good or service • effective advertising or promotion of a good or service • rises in average disposable incomes UNCORRECTED PAGE PROOFS • generally improved economic conditions where spending is strong.
Graph 2 — Low paid labour: For low-paid work (e.g. $400 per week), wages are depressed by a big supply of labour relative to a smaller demand for labour at a given wage. Low paid FIGURE 7.19 Jobs that require high educational or training qualifications generally have a more limited supply of occupations include part-time junior workers at a takeaway labour and therefore command higher food outlet, casual staff and cleaners. wages. • The relatively large supply of labour at a given wage could reflect: • the absence of special job requirements • experience is not required • low levels of education, skill and training • the work may be relatively easy. • The relatively weak demand for labour at a given wage may be the result of: • low levels of efficiency and output • softer spending and economic conditions generally • technical change has made some jobs redundant • fewer consumers want to purchase a product that has become less fashionable. Whatever the specific reason, wage differences due to the operation of the labour market cause inequality in income, consumption and material living standards. 7.5.2 Unemployment and reduced hours of work cause income inequality One of the most obvious and important causes of inequality in both income and wealth is high unemployment (e.g. over 30 per cent in the Great Depression of 1929–33, and a monthly high of 11.7 per cent in June 2020 without the JobKeeper wage subsidy during the COVID-19 recession). As we know, unemployment can follow a drop in aggregate demand which occurs in a recession. It may also be the result of structural change (e.g. firms restructure operations using new technology, closing unprofitable branches, relocating overseas, or a mismatch of worker skills with the jobs available). Whatever the case, when individuals lose their job and cannot sell their labour resources, they are forced onto government welfare benefits. Typically, their income drops sharply from full-time adult average weekly earnings of over $1750, to perhaps only $300 to $350 a week on welfare. For some, this means poverty. Part-time and casual workers also face a greater likelihood of lower incomes than full-time employees. In addition, the unemployed run down their wealth. They cash in their assets, such as savings or shares, just trying to make ends meet. With less interest and dividends received from savings, this also causes their income to fall. In addition, if they are unable to meet home mortgage and other interest repayments, their assets can be repossessed, lowering their share of wealth. As a result, material living standards fall. 7.5.3 Low educational attainment causes income inequality Educational attainment has a powerful influence on income, poverty and living standards. As shown in figure 7.20, those with no formal education, or who leave school at or before the end of Year 11, usually have incomes about 40+ per cent lower than those with university qualifications. This is because the labour market usually values educated people more highly than those without such training — they are less scarce. UNCORRECTED PAGE PROOFS In addition, other data suggests that highly educated individuals with post-graduate qualifications are unlikely to experience poverty (just 3.3 per cent), while those who leave school in Year 8 or earlier are very likely (56.3 per cent) to end up in poverty.

FIGURE 7.20 Median annual income and median income from wages and salaries for 30- to 64-year-olds not currently studying, by highest level of educational attainment $53 829$47 318 $43 967 Year 11 and below (incl. Cert I-II)


$61 208 $60 605 $50 000 $63 805 $76 731 $72 768 $88 486 $102 977 $84 072 $48 000$38 281 Year 12 Cerificate III-IV Median total income Median income from wages and salaries Diploma Undergraduate Masters Doctorate Source: Australian government, Department of Education, skills, and employment, see https://www.dese.gov.au/integrated-dataresearch/benefits-educational-attainment/income. 7.5.4 Ownership and inheritance of wealth cause inequality Income is not only earned by selling one’s labour. Income such as interest, rent, dividends and profits can also come from the ownership and sale of assets or wealth such as property, shares, bank deposits, superannuation and businesses. Because Australia’s wealth is distributed very unevenly, it is not surprising that income from these assets also leads to inequality. In addition, the existence of inherited wealth, leads to inequality in income and wealth. Here, assets are handed down from older to younger generations. Nowadays, there is little to prevent inheritance, given that death duties UNCORRECTED PAGE PROOFS or taxes on the value of estates were abolished some decades ago. Although perhaps 80 per cent of Australia’s wealthiest 200 have accumulated self-made fortunes, inheritance certainly gives the lucky few a start financially. Figure 7.21 shows the value of wealth inherited varies greatly between quintiles 1 and 5. For instance, the average value of wealth inherited by quintile 5 was around three times higher than that for quintile 1.
200 180 Median Average 200 180
160 140 160 140
$’000 120 120 100 100 80 80 60 60 40 40 20 20 0 0 1 Wealth quintile
$’000 2 4 5 Source: Australian government, Treasury, 2020, Retirement Income Review final report; data from Melbourne Institute HILDA surveys from 2001–2017, see https://povertyandinequality.acoss.org.au/wp-content/uploads/2020/12/Inequalityin-Australia-2020-Part-2-Who-is-affected-and-why_FINAL.pdf. Recipients of inherited wealth can use it to invest, enabling them to further increase their income and generate even more wealth. Here we might think of individuals who inherited substantial wealth including Gina Rinehart (mining), Blair Parry-Okeden (media), James Packer (media), and Warwick Fairfax (media). 7.5.5 Personal and other influences There are many other causes of income and wealth inequality that we see in Australia. Here are just a few: Age can cause income inequality For most people, the peak in their income-earning capacity occurs when they are in the 35–49-year-old age group. In contrast, there are two age groups that often suffer low incomes and a lack of wealth. The very young sometimes find it hard to get their first job, mostly because of a lack of work experience, training, skill or, in a few cases, possibly a poor ‘work ethic’. Consequently, youth unemployment is relatively high (around 9 per cent in mid-2022), and their share of income is low. In addition, most of these young people have not yet had time to accumulate assets or wealth. At the other end of life cycle, there are the aged who can no longer work. They often depend on welfare benefits 3 UNCORRECTED PAGE PROOFS (e.g. the age pension), past savings and, for the lucky few, superannuation. Because they are income poor (although may be asset rich), seniors often endure lower living standards. In addition, those over 50 often find it harder to gain employment, thereby reducing their average income.