33 minute read
6.7 Economic responses and government policies involving international trade


2. Comparative cost advantage. Some countries have no product where they have an absolute cost advantage. However, this is not a problem since all countries have areas of production where they have a comparative cost advantage. This means that they should mostly specialise in selected areas of production where their cost disadvantages are least. By focusing on the things they produce best (and stopping production of the goods they are poor at producing), countries will minimise their opportunity cost and thus maximise their production, incomes and material living standards.
Let us use a simple example to help illustrate the differences between these two concepts. Table 6.6 shows hypothetical data for Country A and Country B, both of which can produce two goods, beef and computers. It indicates the total number of hours that it takes a worker in each country to produce each unit of these goods. This gives an indication of relative efficiency in each country in the production of these two goods.
Advertisement
TABLE 6.6 The average number of hours of work for two countries to produce each unit of beef and computers
Country Beef (number of hours per unit produced)
Computers (number of hours per unit produced) 100 100 B 120 200 From the data, Country A clearly has an absolute cost advantage in producing both beef and computers because it is more efficient. It can produce both goods more cheaply with fewer hours of work. By contrast, Country B has no absolute cost advantage in either good, so at first sight it might seem that Country B could never sell its goods to Country A, or be involved in international trade. However, this need not be the case. Beneficial international trade can occur if both countries specialise in areas of comparative cost advantage. That is, they concentrate on producing the good where they have the greatest relative cost advantage, or the least disadvantage. So country A should specialise in the production of computers (where its advantage is greatest) and country B should specialise in the production of beef (where its disadvantage is least). Through international trade, both countries would be better off materially by minimising their opportunity costs and maximising their output from their available resources. One important reason for international specialisation in production is that often countries have different types of resources (i.e. different natural, labour and capital resources) that are wanted by other nations. For instance, countries with warm tropical climates often produce crops such as rubber, tea, coffee, sugar or cocoa. Some of these nations also specialise in tourism. The surplus output of these items can then be exported to countries with cooler climates that cannot produce these things. Trade is mutually beneficial. Additionally, free trade allows nations to export more goods and services by opening up new markets abroad. In turn, this means that local businesses can produce on a bigger scale. Firms can gain economies of large-scale production where, in the short term, their fixed production costs per unit — such as product design, equipment, advertising and perhaps management — can be spread more thinly over greater output volumes, allowing the good or service to be sold more cheaply. As a result of this, some consumers at home and overseas should now prefer to purchase the local item. This leads to increased production, higher incomes and better living standards. A UNCORRECTED PAGE PROOFS Increased international trade
Freer trade (involving more FTAs, lower tariffs both here and overseas, and less protection) should help to grow the markets for a country’s exports and thus boost its sales. Indeed, Australian and international experience has shown that trade liberalisation has meant that our exports have increased between two and four times faster than our GDP. This has increased our export incomes and average material living standards.
If, as argued, freer trade leads to greater efficiency, more exports, business expansion and stronger economic growth in the long run, it should also lead to the creation of more jobs and income. Indeed, it has been estimated that one in four Australian jobs depends directly or indirectly on our sales of exports. However, on its own, trade liberalisation is not enough to guarantee that all will benefit. To ensure that the advantages of higher output and income are shared by all, it is essential that the government also uses a range of policies including the re-training and re-skilling of those whose jobs and incomes were lost due to increased competition from imports.
Lower inflation, increased purchasing power and more choice Inflation refers to generally rising consumer prices that must be paid for goods and services. Without protection and tariffs, domestic inflation rates should be much lower due to stiffer competition from imports. Research has shown that following widespread trade liberalisation by governments, the world’s average inflation rate has fallen from 24 per cent a year in 1990 to less than 4 per cent in more recent decades. This impressive slowdown in prices leading to rises in purchasing power largely reflects the powerful effects of stronger international competition. Free trade also means there is more consumer choice. This too can lead to greater satisfaction, and more affordable and better quality goods and services. As a result of freer trade, the purchasing power of our incomes is greater and so material living standards should be higher.
Resourceseses Resources Weblinks The big ideas of trade Foreign trade — an introduction How beneficial is world trade? Comparative advantage and terms of trade Division of labour specialisation, trade comparative advantage Arguments against international trade Why do countries restrict trade? 6.6.2 A second perspective: The advantages of protectionism Supporters of trade protection usually focus on four main advantages or reasons for using tariffs, subsidies and import quotas. These are summarised in figure 6.19:
FIGURE 6.19 Some advantages of trade protection Advantages of trade protection
Helps to grow new infant industries growing output and employment Helps to strengthen national defence and encourage self-sufficiency in the event of war, pandemics and interruptions to supply chains Might improve economic stability by reducing dependence of exports
Can create some jobs in the short term and reduce unemployment UNCORRECTED PAGE PROOFS
• Protection helps grow infant industries. The infant industry argument, used by some to justify protection, is based on the assumption that new industries just getting started will have higher production costs than those that are well established. In the case of these industries, tariffs supposedly provide a helping hand for a few years, until firms get established and become more efficient. While there are some success stories justifying this use of tariff protection (indeed all industries in Australia were once infants), there are also failures (e.g. in the past, Australia’s car industry) where the so-called infant remains uncompetitive, even in old age! In fact, sometimes tariffs and subsidies reduce efficiency in resource allocation. • Protection strengthens our independence, self sufficiency, and national security. During wartime and pandemics (e.g. COVID-19), countries are often isolated without access to imports. The use of tariffs during peacetime can help maintain inefficient or uncompetitive industries so that there is an assured supply of essential goods and services in an emergency. This argument has been used in Australia by a number of industries including the pharmaceutical drugs and medical equipment, oil, car and shipbuilding industries. However, a likely cost of this policy is lower material living standards (except perhaps during wartime or pandemics). • Protection improves economic stability. Some critics of free trade argue that open, exporting economies are more likely to experience booms and recessions in the level of economic activity caused by the business cycle in overseas countries. While this is partly true, the same sort of reasoning could also be used to stop or limit interstate or intrastate trade, since potentially there could be instability here as well — a suggestion that could not be taken seriously. • Protection creates jobs and reduces unemployment. One of the most frequently heard reasons for keeping tariffs is that they help protect local jobs and employment from destruction by imports coming from low-wage countries such as Indonesia or China. Tariff protection, especially of infant industries over the short-term, is necessary so they can start up and overcome their natural cost disadvantage until they get established. While there may be some basis for this argument especially, several counterpoints can be made Firstly, we cannot expect other nations to allow our exports into their country if we use tariffs to repel competition. It is likely that a move by Australia to raise tariffs would cause retaliation overseas, lower our exports, and would perhaps result in a loss of jobs and income. This would reduce our living standards. Secondly, although tariffs may help protect one industry, in doing so they can cause the production costs of others that use imported materials and equipment to be higher than otherwise. This makes them less profitable. Tariff protection of one industry can lead to other businesses closing down and the destruction of jobs. Finally, over the long-term, it is hard to see how more jobs can be created by using tariffs that are designed to encourage industries that are both inefficient and unprofitable. Logically, we should create more jobs and have higher living standards if Australia specialises in the things we make best — that is, we should concentrate on selecting areas of production where we have a comparative cost advantage (or the least disadvantage). 6.6 Activities Students, these questions are even better in jacPLUS UNCORRECTED PAGE PROOFS
Receive immediate feedback and access sample responses Access additional questions Track your results and progress
Find all this and MORE in jacPLUS
6.6 Exercise
1. Distinguish protectionism as a government policy from that of free trade. (4 marks) 2. Discuss the claimed advantages and disadvantages of free trade and protectionism. (6 marks) 3. a. The price at which goods and services are bought and sold is important in international trade. Nations tend to export goods or services where they have an advantage, and import goods and services where they have a disadvantage. Distinguish between an absolute cost advantage and a comparative cost advantage in international trade. (2 marks) b. Using the internet for research, write a paragraph about David Ricardo’s economic theory of international specialisation and trade based on the concept of comparative cost advantage. (4 marks) c. Examine table 6.7 before answering the questions that follow. This table shows hypothetical data for Portugal and England. It indicates the number of hours that a worker in each country must work in order to produce each unit of wine or cloth, giving an indicator of relative efficiency in each country in the production of these two goods. TABLE 6.7 The average number of hours of work for two countries to produce each unit of cloth and wine
Country Cloth (number of hours per unit produced)
Wine (number of hours per unit produced) Portugal 90 80 England 100 120 i. Giving reasons, explain which country has an absolute cost advantage in producing: (2 marks) • cloth • wine. ii. Giving reasons, explain which country has a comparative cost advantage in producing: (2 marks) • cloth • wine. iii. Would it be possible and beneficial for these two countries to trade with each other? Explain. (2 marks) 4. a. Identify and outline the main types of trade protection sometimes used to support local industry. (2 marks) b. Supporters of protectionism usually raise four main justifications for its use. Explain. (4 marks) 5. a. Select any two of the following industries where you believe that Australia’s comparative cost advantage is greatest (or disadvantage is least) in our region. Explain your reasoning. (2 marks) i. Making cars ii. Biomedical research iii. Producing wool iv. Producing minerals such as bauxite and gold v. Selling environmental tourism vi. Producing oil vii. Making video equipment viii. Making movies ix. Making twin-hulled ferries x. Making textiles and clothing b. Explain how freer international trade (i.e. without protecting local industry) can bring the following benefits for a country: (10 marks) i. increase efficiency in production and resource allocation ii. increase the rate of economic growth and raise incomes iii. reduce inflation iv. boost exports v. increase the number of jobs, lowering unemployment. UNCORRECTED PAGE PROOFS c. There is an index that measures the extent to which different countries have open economies and encourage freer trade. One index is called the Enabling Trade Index (ETI) where the scores range from a low of 0 up to a high of 7 (here the country is very open to and encourages free trade). Based on research, figure 6.20 shows the relationship between countries that enable trade and the yearly level of their GDP per capita.
FIGURE 6.20 The relationship between countries with open economies and high scores (nearer 7) on the Enabling Trade Index (ETI) and the average yearly level of GDP per person (US$)
7 7
6 Singapore 6
5 5 Kuwait 4 4 Russian Federation Algeria Libya 3 Mongolia Angola 2 2 1 1 1 10 100 1000 10 000 100 000 1 000 000
Gabon Iran, Islamic Rep. VenezuelaETI 2014 score (1−7) ETI 2014 score (1−7) GDP per capita (US$, log scale), 2012 Source: Graph copied from the World Economic Forum, ‘The Global Enabling Trade Report 2014’, figure 2, p. 8, see http://www3.weforum.org/docs/WEF_GlobalEnablingTrade_Report_2014.pdf. Note: The horizontal scale uses a logarithmic scale that compresses GDP per capita as it increases, making it look less impressive. i. Describe the apparent general relationship between the Enabling Trade Index (ETI) and a country’s annual GDP per head. Illustrate your response by selecting two countries named on this graph. (2 marks) ii. Explain why many economists believe that free trade and specialisation in areas of comparative cost advantage should allow the countries involved to enjoy higher levels of production (GDP), incomes and material living standards. (4 marks) Fully worked solutions and sample responses are available in your digital formats. 6.7 Economic responses and government policies involving international trade KEY KNOWLEDGE • the economic responses of governments and others to address the issue of international trade Source: VCE Economics Study Design (2023–2027) extracts © VCAA; reproduced by permission. Overwhelmingly, governments both here and abroad have adopted the policy of trade liberalisation. This involves a gradual reduction in levels of protection and a move towards freer international trade. 6.7.1 The Australian government’s policy on international trade 3 UNCORRECTED PAGE PROOFS Starting in the early 1970s and accelerating from the early 1990s, the Australian government gradually shifted towards a policy of freer trade or, as it is also called, trade liberalisation. This entailed reducing the levels of industry protection through changes in five key policies: 1. cutting the general rate of tariffs to less than 1 per cent 2. abolishing all import quotas
3. slashing producer subsidies 4. greatly easing local content laws and imposing restrictions on foreign capital and dumping goods below cost 5. increasing the number of bilateral free trade agreements with particular countries.
Some of these policy changes by the Australian government are illustrated in the table and graph making up figure 6.21.
FIGURE 6.21 Indicators of the Australian government’s adoption of trade liberalisation, 1970–71 to 2020–21 40 35 30 25 20 15 10 5 0 1970–71 1980–81 1990–91 2000–01 Year
Tariff rate (percentage), subsidies ($ billions) and cumulative number of FTAs 2010–11 2020–21 2030–31
Indicators of trade liberalisation by the Australian government **Cumulative number of free trade agreements General rate of manufacturing tariffs (percentage) Rate of agricultural tariffs (percentage) *Estimated value of gross subsidies and industry assistance ($ billion)
Year 1970–71 **Cumulative number of free 0trade agreements 36 28 25
0 23 12 20
1 16 13 18 1 5 8
7 5 0 11
1980–81 1990–91 2000–01 2010–11 2020–21 2030–31 15
General rate of manufacturing 0.7 tariffs (percentage)
Rate of agricultural tariffs 0(percentage) *Estimated value of gross subsidies and industry 14 assistance ($ billion) *Note: Excluding the massive temporary increase in emergency subsidies provided during COVID-19, 2020–21–22. **Note: There were 15 FTAs in 2020–21, but by mid-2022, this had increased to 17. In addition, in 2022, there were three other agreements that had been signed (with India, the UK and the Trans-Pacific Partnership, with another four under negotiation with the EU, Gulf States, India and UAE. Sources: Data rounded and estimated using information derived from AGPS; Industry Commission; Report by the government, 2002 Trade Policy Review; Productivity Commission, Trade and Assistance Review, 2015 (see also www.pc.gov.au/research/ongoing/trade -assistance/2013-14/trade-assistance-review-2013-14.pdf); DFAT; budget review 2006–07, budget papers 2008–09 to 2022–23; CIE report 2017, Australian Trade Liberalisation, prepared for the Department of Foreign Affairs & Trade, www.dfat.gov.au/sites/default/fil es/cie-report-trade-liberalisation.pdf; Trading Economics, https://tradingeconomics.com/australia/tariff-rate-applied-simple-mean-allproducts-percent-wb-data.html. From this it can be clearly seen that the Australian government accepts the principles of freer trade and largely rejects protectionism of local industry. Now for a closer look at each of these policy areas. Lower tariff protection Tariffs are a tax added onto the price of imports to make them less attractive to local consumers. Figure 6.22 shows that the move towards lower tariffs started at different times in different industries. • In the case of ‘general’ tariffs on manufactured items, protection was gradually reduced from the early 1970s, from an average rate of 36 per cent to less than 1 per cent in recent years. • Special higher rates of tariff protection were given to the textile, clothing, footwear and automotive industries until a decade ago. • In 2005, car tariffs were cut to only 10 per cent (down from 125 per cent in 1985–86) and then to just 5 per cent from 2010 onwards.
6 UNCORRECTED PAGE PROOFS
Clearly, the Australian government believes that there are great benefits in exposing local businesses to strong international competition and free trade — benefits like greater efficiency, increased exports, higher incomes, faster economic growth, lower inflation, more jobs in the long term and higher material living standards.
FIGURE 6.22 How the Australian government has recently cut tariffs
1970–71 1980–81 1990–91 2000–01 2010–11 2020–21 Industry area General rate of manufacturing tariffs 36 (percentage) 50 91 55 2.5 28 23 96 140 30 12 16 60 176 8 13 5 15 5 25 10 2.5 2.5 6 0
Effective rate of tariff protection (percentage) 0 20 40 60 80 100 120 140 160 180 200
2030–31 1970–71 1980–81 1990–91 2000–01 2010–11 2020–21 2030–31 0.7 Passenger motor 5vehicles tariffs (%) Clothing apparel 0tariffs (%) Whitegoods tariffs (%) Agricultural tariffs (%) 0
Changes in Australian tariff rates (effective percentage) by industry General rate of manufacturing tariffs (percentage) Clothing apparel tariffs (%) Agricultural tariffs (%) Passenger motor vehicles tariffs (%) Whitegoods tariffs (%) Sources: Data rounded and estimated using information derived from various sources including AGPS; Industry Commission; Report by the government, 2002 Trade Policy Review; Productivity Commission, Trade and Assistance Review, 2015 (see also www.pc.gov. au/research/ongoing/trade-assistance/2013-14/trade-assistance-review-2013-14.pdf); DFAT; budget review 2006–07, budget papers 2008–09 to 2022–23; CIE report 2017, Australian Trade Liberalisation, prepared for the Department of Foreign Affairs & Trade, www.df at.gov.au/sites/default/files/cie-report-trade-liberalisation.pdf; Trading Economics, https://tradingeconomics.com/australia/tariff-rateapplied-simple-mean-all-products-percent-wb-data.html.
5 UNCORRECTED PAGE PROOFS
Reduced subsidies to local businesses
Subsidies are government cash payments made to local producers to help them cover some of their production costs. They can enable Australian firms to export at lower, more competitive prices. Figure 6.22 (earlier in this section) shows us that there was a general reduction in gross subsidies from around $25 billion in the early 1970s, down to an estimated $14 billion by 2020–21 (but this excludes the temporary emergency
subsidy packages provided during the COVID-19 recession, 2020–21–22 worth over $150 billion). Overall, the government’s policy has again been fairly consistent with the belief that trade liberalisation improves competition, efficiency, incomes and living standards.
Abolition of import quotas and licences
Import quotas are designed to restrict the supply or quantity of specific types of imports allowed into the country. In order to achieve a stated volume target, prospective importers must obtain a licence that gives them permission to bring in a certain maximum number of articles of a particular description. Quotas were commonplace in the 1970s and early 1980s, especially on cars, textiles, footwear and clothing. However, these have been progressively abolished. The last quotas, which applied to cheese, were terminated in 2000–01. Clearly, the government believes that, in the long term, removal of import quotas results in greater efficiency in the allocation of resources, lower prices, improved international competitiveness, stronger economic growth, and ultimately better living standards. Increased number of free trade agreements (FTAs) As part of trade liberalisation, Australia has negotiated bilateral free trade agreements (FTAs) with two or more countries. Essentially, FTAs involve the removal of local industry protection by the countries involved. This includes abolishing most tariffs. In addition to exposing local firms to more intense foreign competition, and forcing them to become more cost efficient and improve their competitiveness, FTAs help Australian producers gain access to much bigger export markets abroad. This allows our businesses to grow their export income. Table 6.8 shows that by mid-2022, Australia had 17 FTAs in operation, with another three signed and ready to come into force, and a further four under negotiation: TABLE 6.8 Australia’s free trade agreements Year of operation Name of Australia’s FTA 1983 1. Australia–New Zealand (ANZCERTA or CER) 2003 2. Singapore–Australia (SAFTA) 2005 3. Australia–United States (AUSFTA) 4. Thailand–Australia (TAFTA) 2009 5. Australia–Chile (ACl-FTA) 2010 6. ASEAN–Australia-New Zealand (AANZFTA) 2013 7. Malaysia–Australia (MAFTA) 2014 8. Korea–Australia (KAFTA) 2015 9. Japan–Australia (JAEPA) 10. China–Australia (ChAFTA) 2018 11. Comprehensive and Progressive Agreement for Trans-Pacific Partnership (CPTPP) 2020 12. Australia–Hong Kong (A-HKFTA) and associated Investment Agreement (IA) 2020 13. Peru–Australia (PAFTA) UNCORRECTED PAGE PROOFS 14. Indonesia–Australia Comprehensive Economic Partnership Agreement (IA-CEPA) 15. Pacific Agreement on Closer Economic Relations (PACER) Plus
2022 16. Regional Comprehensive Economic Partnership Agreement (RCEP) 17. Republic of Korea
Agreements but not yet in operation by mid-2022 ◦ Australia–India Economic Cooperation and Trade Agreement (AI-ECTA)
◦ Australia–United Kingdom Free Trade Agreement (A-UKFTA)
◦ Trans-Pacific Partnership (TPP)
Agreements under negotiation in mid-2022 ◦ Australia–European Union Free Trade Agreement ◦ Australia–Gulf Cooperation Council (GCC) Free Trade Agreement ◦ Australia–India Comprehensive Economic Cooperation Agreement ◦ Australia–UAE Comprehensive Economic Partnership Agreement Source: Data derived from Australian Government, Department of Foreign Affairs and Trade, see https://www.dfat.gov.au/trade/ agreements/trade-agreements. Apart from these FTAs, Australia also participates in multilateral trade agreements where there are many other countries involved. For instance: • We are part of the Asia–Pacific Economic Cooperation (APEC). This is a regional forum aimed at promoting freer trade among 21 member countries (see figure 6.23) around the Pacific rim, accounting for almost 60 per cent of global GDP. It includes Australia, Brunei Darussalam, Canada, Chile, Indonesia,
Japan, Malaysia, Mexico, New Zealand, Papua New Guinea, the People’s Republic of China, the
Philippines, Republic of Korea, Singapore, Thailand and the United States. Together, there are around 2.8 billion people in this market or over 38 per cent of the world’s population! Currently, these countries buy about 70 per cent of Australia’s exports. Clearly, what happens to our exports in this region is of national economic and political importance to Australia. In 1994, members of APEC signed an agreement that abolished intercountry tariffs by late 2020.
FIGURE 6.23 Map showing APEC nations A R C T I C O C E A N A T L A N T I C O C E A N I N D I A N O C E A N P A C I F I C O C E A N
A T L A N T I C O C E A N APEC Key Source: Map copied from Wikipedia, the free encyclopaedia, en.wikipedia.org/wiki/File: APECMitgliedsstaaten.png. N UNCORRECTED PAGE PROOFS
• The Association of South-East Asian Nations (ASEAN) brings together ten countries from the South-East Asia region — Indonesia, Cambodia,
Vietnam, Laos, Burma (Myanmar), Brunei Darussalam, Malaysia, the
Philippines, Singapore and Thailand (see figure 6.24). These countries accept the principle that freer international trade will help their economic development, so their governments have been gradually cutting tariffs.
Although Australia is not a member of ASEAN, it is a dialogue partner, and the region has great importance to us (e.g. the ASEAN–Australia–
New Zealand FTA was signed in 2009). For instance, the region now offers a large and growing market for Australian firms because of its population of around 662 million (about 8 per cent of the world’s population), rising GDP (now about US$4 trillion per year) and the closeness or accessibility of the member countries. We export about $53 billion (2020), around 11 per cent of our total exports, to these countries. Collectively, the ASEAN member countries are our third biggest customer after China and Japan (which together take over 46 per cent of our total exports). In fact, our exports to ASEAN members have risen more than 40-fold since 1970, and Australian investment in the
ASEAN group has also risen quickly.
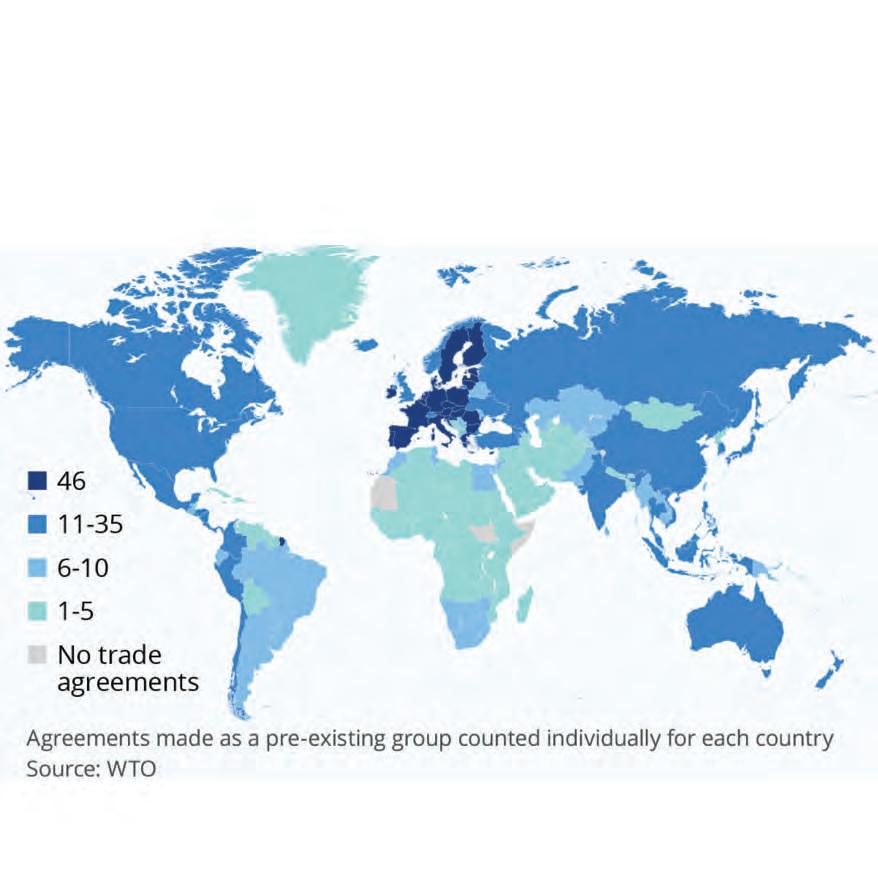
FIGURE 6.24 Map showing ASEAN nations Key ASEAN Source: Map copied from Wikipedia, the free encyclopaedia, en.w ikipedia.org/wiki/File :Association_of_Southeast_Asian _Nations_(orthographic_projection).svg. 6.7.2 Overseas government policy on international trade Around the world, most governments have adopted the policy of trade liberalisation and have been reducing protectionism. For instance, in 1990 the average global tariff rate was 34 per cent, but by 2021 this had fallen to around 3 per cent. Clearly, most governments believe that freer trade is beneficial. Figure 6.25 shows the extent to which governments around the world have adopted the principles of trade liberalisation and free trade. • Map 1 shows that governments in high-income countries, including Australia, NZ, USA, Canada, European nations, must believe in the benefits of freer trade (e.g. greater efficiency in the use of resources, higher incomes, lower consumer prices) and therefore have very low tariff rates. However, there are still many low-income countries in parts of South America, Africa, Russia, and the Middle East, where tariff rates are still relatively high. • Map 2 groups countries or regions according to the number of free trade agreements that are operational.
Again, this indicates the extent to which their governments see free trade as valuable. Apart from some
African countries, the Middle East and parts of South America, most countries have more than 11 FTAs, especially amongst the EU nations.
N UNCORRECTED PAGE PROOFS
FIGURE 6.25 A snapshot of the extent to which governments have adopted the principles of trade liberalisation and free trade.
Tariff rate, applied, weighted mean, all products (%) 0% 20% Source: Map 1 copied from the World Bank, weighted mean tariff (all products), see http://data.worldbank.org/ indicator/TM.TAX.MRCH.WM.AR.ZS/countries/1W?display=map. Map 2- Number of active free trade agreements by country
N UNCORRECTED PAGE PROOFS
Source: Map 2 copied from Statista, May 2021, and quoting the World Trade Organisation as the original source, see https://www.statista.com/chart/18991/countries-with-most-trade-agreements/
Resourceseses
Weblinks AUSTRADE: Benefits of trade and FTAs Potential FTA with India Video case study: Aaco Beef Video case study: Ausab Video case study: ACPET Video case study: Burch Family Wines Video case study: Burra Foods Export Council of Australia (ECA) 6.7.3 Actions taken by governments and businesses following the adoption of trade liberalisation policies Once a government has made the decision to liberalise its international trade and reduce industry protection, there are knock-on effects — other policies must also be changed so that firms become more internationally competitive and don’t collapse. International competitiveness means that local businesses are able to profitably sell good quality goods and services at relatively low prices here and overseas, without government assistance (e.g. subsidies). Policies by government and business to improve our international competitiveness With stronger competition from imports, the Australian government has used various efficiency-promoting supply-side policies to help local businesses and workers meet the challenges of import competition. Businesses have had to make structural changes in the way they operate. We will take a quick look at a couple of these measures that are designed to improve Australia’s international competitiveness. Reductions in the company tax rate The rate of company tax affects the level of after-tax profits of firms. It also affects the price that businesses must charge consumers to make a profit. Unfortunately, compared with rates of corporate tax in many overseas countries, Australian firms are at a disadvantage. Rates are higher than in most comparable nations so profits are lower and selling prices must be higher. By making local firms less internationally competitive, high company tax rates have forced some firms to close or relocate overseas, discouraged new industry start-ups, limited our exports and GDP, caused workers to lose jobs, and meant lower incomes and living standards. With this problem in mind, the Australian government cut rates of company tax from 49 per cent in 1988 to 30 per cent in 2002, and from July 2021 small-medium sized firms (SMEs) had rates cut down to 25 per cent if they have an annual turnover of less than $50 million. However, the size and speed of these reductions have been less than those in many other countries. For instance, as shown in figure 6.26, the average rate of company tax in the OECD group of nations was just 20.7 per cent against the standard rate in Australia of 30 per cent, or 25 per cent for small and medium companies. Investment in national infrastructure projects Infrastructure provides the services used by businesses like roads, railways, water, power, airports, and seaports. With increased competition from cheap imports, it becomes more important than ever to have an efficient and competitive system of national infrastructure. This helps to lower production costs for businesses and grows our country’s productive capacity. It enables Australian-made products and services to be sold competitively at home and abroad. Unfortunately, Australia’s infrastructure has been allowed to deteriorate UNCORRECTED PAGE PROOFS and age. It has not kept pace with population growth, causing bottlenecks or barriers to supply and resulting in a local cost disadvantage.
Standard company tax rates in selected countries (percentage of profits)
Cayman Islands Bermuda Ireland 0 0
12.5
Hong Kong 16.5
Country or region
34 33 30.6 30 30 28 28 26.5 25.2 25 25 25 24 23.6 21 21.4 20.7 20 20 20 19 17 0 5 10 15 20 25 30 35 40 Brazil France Japan Australia (large companies) Germany NZ NZ France India Australia (small & medium companies) South Korea China Malaysia Global average USA Asia average OECD average Taiwan Vietnam Thailand UK Singapore Company tax rates (percentage of profits) Sources: Data derived from KPMG, https://home.kpmg/xx/en/home/services/tax/tax-tools-and-resources/tax-rates-online/ corporate-tax-rates-table.html; Trading Economics, see https://tradingeconomics.com/country-list/corporate-tax-rate. Hence, in recent times, we have seen the Australian government making more money available to invest in national road (e.g. work on the M1 motorway), rail (e.g. the inland rail projects including the airport rail link to Melbourne airport, the fast rail link from Melbourne to Brisbane, and the Port Botany rail line), electricity (e.g. pumped hydro power in the Snowy Mountains Scheme), airports (e.g. a new airport for Western Sydney), telecommunications (e.g. the NBN), and water supply infrastructure projects. For instance, the 2022–23 budget committed $120 billion in funding towards the ten-year rolling infrastructure plan for the period to 2031–32. The Victorian government has also invested heavily in infrastructure like the West Gate tunnel project, roads and rail, to help UNCORRECTED PAGE PROOFS alleviate some of the congestion bottlenecks, reduce production costs for local firms, and allow them to become more internationally competitive.

Following trade liberalisation, exposure to international competition necessitates improving the education and skills of our labour force. More than ever, Australian workers need to be creative, innovative and efficient. In turn, this can help lower production costs, create new industries, build our international competitiveness, lift exports, and raise incomes and living standards. Understanding this, the Australian government has increased the overall level of its spending on education to $45 billion in the 2022–23 budget, along with over $1.8 billion in funding of the JobTrainer program for the period 2020–21 to 2022–23. In addition, there has been ongoing funding of research and development (R&D) including money for space and scientific research, energy, medical research and the work of the CSIRO and universities to develop a COVID-19 vaccine. Here, the 2022–23 budget committed $12 billion R&D outlays. Deregulation and reform of the labour market Wage and labour costs in many businesses make up 60–70 per cent of the total cost of production. So, if these costs are too high, they make Australian firms and workers less internationally competitive and unable to survive against cheaper imports from low-wage countries. Hence, to be internationally competitive, our wage costs need to be kept down and worker efficiency (GDP per hour worked) must be raised. On this count, during the 1960s, 70s and 80s, some economists became highly critical of Australia’s centralised minimum wage fixing system where the pay and conditions of many workers was determined by the Australian Fair Work Commission (or its many predecessors). Here, there was little connection between worker productivity and wage rates, union pressure was considerable, and Australian labour costs rose to become some of the highest in the world. One solution used by the government to slow wage costs was partial deregulation of the labour market by encouraging enterprise bargaining as an alternative to centralised wage fixing. Under this newer system, which now covers over 85 per cent of all workers, wages and conditions are largely set by the forces of demand and supply in the labour market on a firm-by-firm basis. Here, wage rises are usually closely linked to increases in worker efficiency (i.e. output or GDP per hour worked) and the relative value or scarcity of each type of occupation. Despite this partial deregulation of the labour market and wages, some protection is still offered to workers on enterprise agreements since these still need to meet minimum standards. This approach to wage fixing has certainly helped to slow rises in Australia’s wage costs. It has helped to make local firms more internationally competitive, boost our export sales and incomes, and improve our material living standards. Some responses by Australian businesses to trade liberalisation Following reductions in industry protection associated with trade liberalisation, Australian businesses have been forced to make structural changes to the way they go about producing goods and services. To be internationally competitive, firms need to be able to sell better products at lower prices. They must innovate with new ideas, and continually restructure the way they produce and sell their goods and services. This process of structural change is painful and often involves: UNCORRECTED PAGE PROOFS • finding ways of cutting wage and other production costs by using strategies that lift worker efficiency, innovation and motivation • closing down or selling off inefficient operations and non-performing branches of businesses • encouraging product innovation through research and development (R&D)

• expanding the use of the latest technology in production to lift efficiency, cut costs and improve product quality • workers and managers using the best and most innovative production practices available from around the world • marketing abroad to help grow the export volumes and gain cost savings through increased economies of large-scale production.
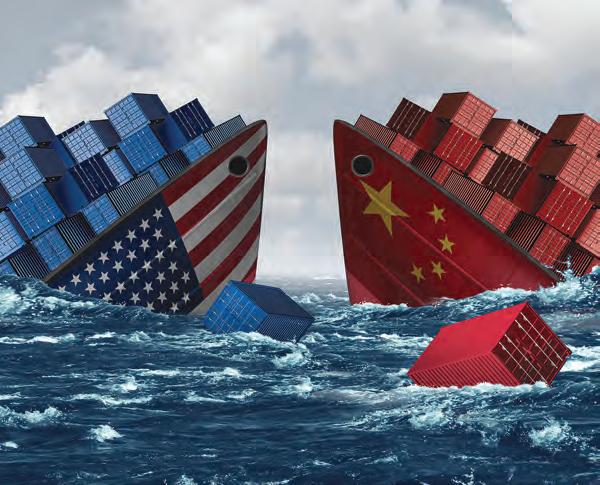
6.7.4 Are people and countries recently reassessing trade liberalisation? The dramatic growth of world trade has depended on peace, international specialisation, trade liberalisation, acceptance of global interdependence, and adherence to orderly trading rules that were set up at the end of World War 2. Four key events have caused some countries to modify their approach to the liberalisation of international trade. The UK’s Brexit The European Union or EU is an international organisation made up of 27 countries. It seeks to promote the wellbeing of its people by having some common economic, social and security policies. One important feature of this organisation is that it creates a single market within which all member countries have zero industry protection. There is free trade so there are no barriers to the movement of goods, services and investments across national borders. However, by 2016, there was growing resentment of this arrangement amongst some in Britain. Free trade and import competition were blamed for the destruction of industries, the loss of jobs and unemployment, depressed wages, growing inequality, a loss of Britishness, and reduced living standards. As a result, a referendum was held in 2016 and the question about whether to remain in the EU was put to a popular vote. The result was a small majority in favour of leaving the EU (52 votes to 48). Britain finally exited in February 2020 (called Brexit), after membership for 47 years. It meant that the country had greater independence in its economic and social policies, but it lost some of the advantages of belonging to this huge trading bloc with its single market. Trade tensions with China Today, China is an economic powerhouse. It produces around 10 per cent of global GDP and its exports are worth around $3 trillion a year. It joined the World Trade Organisation (WTO) in 2001 and since then has reduced many of its trade barriers and currently has 17 FTAs, including one with Australia. Even so, it still has average tariffs of around 7 per cent, and import quotas exist on over 150 items. In addition, the Chinese government has recently decided to adopt a far more assertive or, as some would say, a more aggressive and hard-line approach in its trade dealings with the rest of the world.UNCORRECTED PAGE PROOFS

• The US–China trade war 2018–20:
One trade tension that came to head in 2018 was the US–China trade war declared by then
President, Donald Trump. This dispute involved several issues.
Deteriorating economic conditions with high unemployment, depressed wages, and growing inequality in the US were blamed on fierce foreign competition from cheap Chinese imports, a problem worsened by the Chinese currency being undervalued. This allowed China to run huge trade surpluses at the US’s expense, making it a poor trading partner. There was also the serious claim that China disregarded long-held international trading rules and improperly accessed intellectual property belonging to the USA and other western nations worth an estimated $225–600 billion a year. In response to these issues and supposedly, ‘to make America great again’, Donald trump fired the first shot in the trade war. Whilst contrary to the principles of trade liberalisation and international specialisation in production, he imposed a 10 per cent tariff on $200 billion of Chinese goods imported to America. This prompted similar retaliation by China and so the President further raised tariffs to 25 per cent in May 2019 on $200 billion of goods. • Chinese restrictions on exports from Australia and some other countries: In response to what China saw as valid trade concerns with Australia, in 2020 and 2021, Beijing imposed restrictions on some Australian exports of goods including barley, cotton, beef, lamb, lobster, wine, timber and coal — worth around $25 billion or about 10 per cent of our exports to China. Some commentators believed that, in part, these trade barriers erected by China were in response to Australia calling for an international inquiry into the origins of the global COVID-19 pandemic that appeared to originate in China. In addition, there have also been Chinese government attempts to discourage its citizens from visiting Australia as tourists, or students for education. These strong-arm trade actions by the Chinese have hurt some local businesses and are contrary to trade liberalisation and our FTA. However, many exporters have been forced to broaden their markets, rather than depend overly on a single country like China. Whilst Australia has been hit hardest by Chinese coercive trade tactics, we are not alone. Other countries have also been punished including Japan, Canada, Norway, South Korea, the Philippines, and Taiwan. UNCORRECTED PAGE PROOFS