40 minute read
4.16 Review


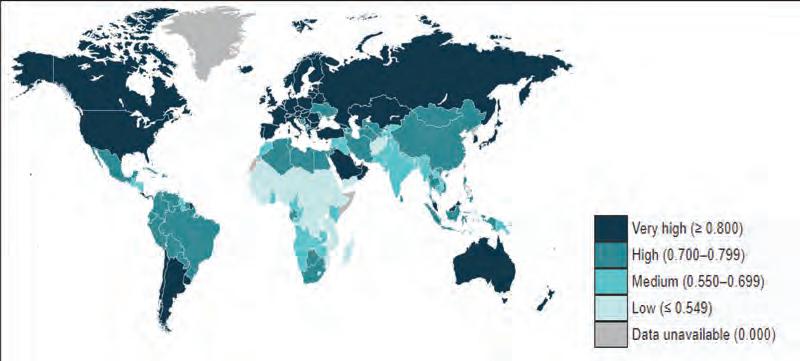
Source: Based on data from Human Development Report 2020, The Next Frontier: Human Development and the Anthropocene, United Nations Development Programme, pp. 343–346. 4.15.3 Green GDP as an indicator of living standards Another alternative measure of living standards is green GDP. This is calculated by using data for real GDP and subtracting the estimated value or cost of environmental damage (e.g. depletion of resources, the costs of climate change and the loss of biodiversity) in producing a nation’s GDP. One attempt at this measures the real value of goods and services or GDP produced (converted to common US$) per ton of carbon emissions. This also reveals information about a nation’s contribution to climate change. Not surprisingly, low-income countries usually have the greenest GDPs. Overall, the hope is to reveal a broader picture of our general wellbeing, rather than simply using real GDP. UNCORRECTED PAGE PROOFS
Advertisement
Starting in 2011, the United Nations invited member nations to measure their happiness. This was known as the World Happiness Report. Essentially, Gross National Happiness (GNH) is a composite index made up of several indicators including GDP per head, social support, health and life expectancy, freedom to make life’s choices, generosity, and trust. It is updated annually.
Figure 4.36 uses data to rank the highest and lowest countries based on their score (near 10 represents excellent happiness, near 0 represents great unhappiness). Notice that Finland ranks highest (7.632), Australia is in tenth place (7.272) and Burundi scores lowest (2.904).
FIGURE 4.36 Gross National Happiness (GNH) scores and ranks for the happiest and most unhappy countries Overall rank Country/region Score GDP per capita Social support Healthy life expectancy Generosity
Freedom to Perceptions make life of choices corruption
1 2 3 4 5 6 7 8 New Zealand 9 10 147 Malawi 148 Haiti 149 151 152 Rwanda 153 Yemen 154 155

Tanzania 150 Syria Finland Norway Iceland Switzerland Canada Netherlands Australia Sweden Liberia Denmark 7.324 3.587 3.582 3.408 3.355 3.303 3.462 7.632 7.594 7.495 7.487 7.328 7.441 7.272 7.314 3.495 7.555 1.268 0.315 0.455 0.689 0.332 0.442 1.305 1.456 1.343 1.420 1.330 1.361 0.186 1.340 1.355 0.076 1.351 1.601 0.541 0.714 0.991 0.382 0.896 1.073 1.592 1.582 1.644 1.549 1.532 1.488 1.573 1.501 0.858 1.590 0.876 0.306 0.289 0.381 0.539 0.400 0.343 0.874 0.861 0.914 0.927 0.896 0.878 0.910 0.913 0.267 0.868 0.669 0.531 0.025 0.481 0.088 0.636 0.244 0.681 0.686 0.677 0.660 0.653 0.638 0.647 0.659 0.419 0.683 0.365 0.210 0.392 0.270 0.376 0.200 0.083 0.192 0.286 0.353 0.256 0.321 0.333 0.361 0.285 0.206 0.284 0.389 0.080 0.104 0.097 0.144 0.444 0.064 0.393 0.340 0.138 0.357 0.291 0.295 0.302 0.383 0.030 0.408 UNCORRECTED PAGE PROOFS South Sudan 3.254 0.337 0.608 0.177 0.112 0.224 0.106 Central African 3.083 0.024 0.000 0.010 0.305 0.218 0.038 Republic 156 Burundi 2.905 0.091 0.627 0.145 0.065 0.149 0.076
to come
4.15 Activities
Students, these questions are even better in jacPLUS
Receive immediate feedback and access sample responses Access additional questions
Track your results and progress Find all this and MORE in jacPLUS 4.15 Quick quiz 4.15 Exercise 4.15 Exercise 1. Identify and outline the main weaknesses of using real GDP as an indicator of overall living standards. (4 marks) 2. Describe the main features of the HDI as an alternative measure of living standards, giving reasons why some prefer it to real GDP per head. (3 marks) 3. The ABS developed MAP as an alternative measure of changes in Australian living standards. Describe the main features of the approach developed by the ABS called Measures of Australia’s Progress (MAP, see ABS 1370.0). You may like to use the Measuring Australia’s Progress (MAP) weblink in the Resources tab to view the video about this measure. Identify the key areas within the four wellbeing categories of measure that Australia has seen progress or regression in. (4 marks) 4. Another alternative to real GDP per head as an indicator of wellbeing is Gross Domestic Happiness (GDH). This indicator attempts to compare the happiness of people living in different countries, since perhaps the bottom line of living standards is happiness. Figure 4.37 is a diagrammatic representation of what some economic research has discovered about the growth in national production and average incomes per head on the one hand, and the perceived wellbeing including happiness of people on the other. a. By reference to the graph, explain whether a continued rise in the level of real GDP per head leads to an equal rise in wellbeing including happiness. (2 marks) b. Outline why this relationship between increased GDP per head and happiness behaves like that shown on the graph. (2 marks) FIGURE 4.37 The apparent relationship between real GDP (GNP) per head and perceived level of wellbeing including happiness Level of wellbeing and happiness UNCORRECTED PAGE PROOFS
0 However, as GDP per head continues to rise to higher levels, improved wellbeing, happiness and living standards more closely reflect better lifestyle rather than GDP or incomes.
Initially, improved happiness and wellbeing are due to rising GDP per head and better material living standards.
Level of GDP per head per year
5. Examine table 4.23 showing hypothetical data for a country over a two-year period:
TABLE 4.23 Hypothetical data for a country
Indicator
1. Annual value of real GDP ($ million)
2023 2025
50 000 60 000
2. Population size (millions) 10 12 3. Estimated value of environmental damage including pollution ($ million) 1000 2000 4. Percentage of school age children completing Year 11 80 85 5. Number of serious crimes per 100 000 people 500 600 6. Index (on a base of 100 points) measuring the change in inequality in the way income is shared or divided
100 100 a. Explain which of each of these data might be used to determine how overall living standards might have changed during the two-year period from 2023 and 2025. (2 marks) b. Showing your working, calculate the change in average material living standards over the two-year period between 2023 and 2025. (2 marks) c. See if you can think of a way to calculate average non-material living standards in this country over the two-year period between 2023 and 2025. For example, could you use relevant data to construct some sort of an index of non-material living standards to arrive at an overall value? (3 marks) d. Describe how overall living standards in this country have changed during the two-year period from 2023 to 2025. (2 marks) Fully worked solutions and sample responses are available in your digital formats. UNCORRECTED PAGE PROOFS
Hey students! Now that it's time to revise this topic, go online to:
Review your results Watch teacher-led videos Practise exam questions
Find all this and MORE in jacPLUS 4.16.1 Summary The nature and purpose of economic activity • Economic activity is simply a term used to describe the process of making or selling goods and services. Scarce resources are used to produce and sell goods and services, in exchange for income. • Non-economic activities are generally not sold for money but are done for emotional reasons, concern for others, or on a volunteer basis. • The main purpose of economic activity is to use resources efficiently to produce and sell those goods and services that best help to maximise the general satisfaction of society’s wants and wellbeing. Consumption is the ultimate purpose or goal of economic activity. The meaning of material and non-material living standards • Living standards relate to our general level of wellbeing. There are two main elements that affect our general or overall living standards: • Material living standards are affected by the annual average level of income and consumption per person per year. • Non-material living standards reflect the quality of daily life. • Material and non-material living standards are affected by the level of economic activity. • When the pace of economic activity gets stronger this tends to increase material living standards, while some aspects of non-material living standards might suffer (e.g. environment, sustainability for future generations due to resource depletion). • Weaker economic activity tends to undermine material living standards because of lower employment, incomes, and consumption. Lower economic activity causing higher unemployment and reduced incomes mostly erodes the quality of life and non-material living standards (e.g. social isolation, reduced mental and physical health, unhappiness, possibly higher crime rate, increased stress). One possible upside of slower economic growth is reduced pollution and pressure on the environment. The five-sector circular flow model • The circular flow model is a diagram that simplifies the operation of the economy. It shows how the main parts of an economy interact to produce and distribute goods, services, and incomes. • The five-sector circular flow model is more realistic than the three-sector model introduced earlier, because it allows for saving and international trade. • The five sectors or key parts of the economic model include: • The consumer or household sector • The producer or business sector • The financial sector UNCORRECTED PAGE PROOFS • The government sector • The overseas sector. • The model has four main flows or streams that link the sectors of the economic model: • Flow 1 Resources • Flow 2 Incomes • Flow 3 Spending/AD (C + I + G + X – M)

• Flow 4 Production/GDP • It should also be closely noted that, according to this model, the values of these flows are equal and are interdependent — so if one changes, all change. • The model can be used to help explain why the level of economic activity moves up and down in a cyclical or wave-like manner. • A rise in leakages relative to injections causes AD (flow 3) and economic activity/GDP (flow 4) to slow. This reduces employment of resources, lowers incomes and undermines material living standards. • A fall in leakages relative to injections causes AD (flow 3) and economic activity/GDP (flow 4) to rise, causing increased employment of resources, higher incomes and improved material living standards. The business cycle and recent trends in Australia’s economic growth • Over a period of several years, the level of economic activity is unsteady — it speeds up and slows down in a cyclical or wave-like way. This is called the business cycle. We use the business cycle model or diagram to illustrate this. • The business cycle consists of four key phases — the expansion, the peak (possibly a boom), the contraction and the trough (possibly a recession). Each phase experiences different economic conditions of output/GDP, unemployment and inflation. • Domestic economic stability is the ideal situation and is somewhere midway between a boom and a recession. Here, there is strong and sustainable economic growth (where GDP rises annually by around 3 per cent without inflation), unemployment is low (at around 4.0–4.5 per cent) and inflation is slow (between 2–3 per cent a year). • The Australian economy recently experienced the COVID-19 induced recession in the first part of 2020 and a subsequent recovery during 2021–22. Types of economic indicators • There are three main types of indicators of economic activity that can shed light on conditions: • Lagging indicators of economic activity only tell the reader the level of activity that occurred some time ago (e.g. GDP figures, the unemployment rate) • Coincident indicators move very closely with actual changes in the level of economic activity (e.g. monthly retail sales) • Leading indicators can help to predict where the economy may be heading in the near future (e.g. consumer confidence, business confidence). • When examining statistical indicators related to changing economic conditions, economists look for patterns in the data. • The long-term trend refers to general direction of change in economic activity measured over 10 or 20 years or more. • The short- to medium-term cycles in economic activity are the wave-like changes in direction lasting perhaps 1–5 years. • Some data displays a seasonal pattern where peaks or troughs occur at the same month or time each year. • Erratic behaviour is where there is no obvious pattern because the data are reacting to one-off events. The relationship between the business cycle and economic indicators • As the economy travels along the business cycle from boom, to slowdown, recession and recovery, the level of economic activity changes. In turn, this alters economic conditions affecting the rate of economic growth/GDP, employment/ unemployment, inflation/purchasing power and living standards. UNCORRECTED PAGE PROOFS • In a recession caused by a drop in AD, there is a contraction of GDP over at least two consecutive quarters, unemployment rises sharply, and inflation slows/or there is deflation. • In a boom caused by a strong rise in AD beyond the economy’s capacity, there is an expansion of GDP, unemployment falls to very low levels, and inflation accelerates due to widespread shortages of goods and services (i.e. demand outstrips supply).

• The level of economic activity or growth rate is determined by two key sets of factors — aggregate demand and aggregate supply factors. • Aggregate demand factors or conditions. Over the short- to medium-term, changes in aggregate demand factors affect total spending on Australian goods and services (AD = C + I + G + C X – M) and hence the national level of economic activity (measured by GDP). These factors may strengthen AD or weaken AD by affecting the various components making up total spending. Key aggregate demand-side factors include the following: • changes in consumer confidence about future employment and income prospects can affect C and S • changes in business confidence about future sales and profits can affect I • changes in disposable income per head after tax can affect C and S • changes in interest rates • changes in taxes (T) can affect C while government spending directly affects G • changes in the exchange rate for the A$ affect X and M • changes in the level of economic activity overseas can affect X. • Aggregate supply factors or conditions. Most important for the medium- to longer-terms, the potential rate of economic activity is governed by aggregate supply-side factors. These factors can affect Australia’s level of AS, productive capacity, and size of our PPF. Over time, aggregate supply factors may become more favourable growing AS, or less favourable reducing AS. They often affect the ability and willingness of suppliers to produce. Examples of these factors include the following: • the quantity/volume and quality/efficiency of labour resources available (e.g. affected by immigration, birth rate, education, and skills) • the quantity/volume and quality/efficiency of capital resources available (e.g. affected by level of investment, interest rates, tax rates, and R&D) • the quantity/volume and quality/efficiency of natural resources available (e.g. affected by mineral exploration, land management, climate change and severe weather events) • the level of production costs for producers and after-tax profits (e.g. affected by wage rates, labour productivity, tax rates, adequacy of government infrastructure). The measurement of economic growth using changes in real GDP • The annual rate of change in real gross domestic product or GDP (also called chain volume GDP), is the most common general measure of economic growth or changes in the nation’s total output of goods and services. • There are three ways that the ABS calculates GDP. Referring to the circular flow model, we know that GDP is also equal in value to AD (C + I + G + X – M) and total incomes (e.g. wages + rent + interest + profits, etc.). • However, real GDP on its own, as a measure of the size of our economy, lacks accuracy because it excludes some production (e.g. the value of the cash and black market economies and DIY production), imputes or ‘guesstimates’ the value of some output that is included (e.g. the net rental value of owner-occupied dwellings). The potential benefits of economic growth • Economic benefits include more employment opportunities and jobs, and lower unemployment rates as firms expand production. Economic growth also helps to raise personal incomes, consumption and material living standards. • Economic growth helps to increase government tax revenue and lower welfare outlays, strengthening the UNCORRECTED PAGE PROOFS government’s financial position and making the provision of welfare benefits for the needy more affordable and sustainable. This supports better material living standards. • Economic growth can especially help improve some aspects of non-material living standards: • reduced unemployment can improve happiness, relationships, self-esteem, and health outcomes (mental and physical), and reduce social isolation, crime, and stress
• enable people to enrich their lives by travel and involvement in the arts • provide opportunities to exchange some reduction in work for more leisure time.
The potential costs of economic growth
Sometimes economic growth can bring economic, environmental, and social costs. For instance: • Economic costs might include: • reduced capacity of future generations to enjoy reasonable living standards due to resource depletion and environmental issues • an acceleration of the inflation rate where higher prices may erode the purchasing power on incomes • higher levels of structural unemployment resulting from the use of new technology like robotics in manufacturing and workers lacking the necessary skills to gain employment. • Environmental costs might include: • the creation of negative externalities (i.e. where costs associated with the production and consumption of goods are transferred to third parties not directly involved with the activities) such as pollution, global warming and climate change, destruction of native habitat, loss of life in weather events, food insecurity, displacement of island communities due to rising sea levels, urban over-crowding and waste disposal problems, all of which lower our quality of life • degrading of the quality of common access resources (e.g. air, water, forests, oceans) on which we depend. • Social costs might include: • reduced leisure time as people work more and pursue material goals • reduced health due to increased stress and effects of pollution and climate change • harm to families due to under-parenting caused by work • increased inequality in the distribution of goods, services, and incomes given government measures that make the tax system less progressive, provide tax cuts leading to underfunding of welfare, education and health • affluenza and an obsession with the pursuit of material goals at the expense of other important aspects that lead to happiness and fulfillment. Limitations of using real GDP and real GDP per head to measure living standards • Some people mistakenly assume that the value of chain volume GDP (i.e. real GDP that has been adjusted statistically to remove the effects on the value of output of changing prices) can be used as a standalone indicator of living standards. However, perhaps the most obvious weakness is it fails to allow for a country’s population size. What we really need to know is the annual real value of GDP per head (i.e. a nation’s real GDP divided by its population size). Even then, it tells us nothing about the quality of life or non-material wellbeing. • An improved indicator of living standards is the value of chain volume GDP per capita but even this does not look at all aspects of living standards. • Real GDP per capita is a poor measure of material living standards because: • it fails to consider how evenly or unevenly goods, services, and incomes are distributed — it’s only an average • real GDP statistics do not include the value of all economic activity such as do-it-yourself home production (e.g. including parenting and gardening), the cash economy and the illegal black market economy. This means GDP is an underestimation of the quantity of goods and services produced and available for consumption. • Real GDP per capita is a poor measure of material living standards because it does not capture or take UNCORRECTED PAGE PROOFS account of negative externalities that lower non-material living standards (i.e. costs imposed on third parties that result from growing the production and/or consumption of goods and services). These costs include climate change resulting from carbon pollution (CO2). This results in more severe and frequent weather events involving the loss of life, destruction of business, the displacement of communities, reduced leisure time for families to spend together, youth problems caused by under-parenting their children, increased stress levels and loss of job satisfaction due to pressure to be more efficient.
• Real GDP per head (chain volume GDP) is a very narrow and limited indicator of society’s wellbeing. It does not accurately reflect our material welfare, and it tells us almost nothing about our non-material living standards. • For this reason, alternative measures have been proposed that attempt to provide a more balanced picture of our wellbeing. These include: • Measures of Australia’s Progress (MAP) • Human Development Index (HDI) • Green GDP • Gross National Happiness (GNH) 4.16.2 Key terms Affluenza is a term used to describe a situation where making money and consuming goods and services is an obsession that hurts individuals and others around them. Aggregate demand (AD) represents the total value of all spending each year on Australian-made goods and services (AD = C + I + G + X – M). Aggregate demand factors are the conditions affecting total spending or demand for a nation’s goods and services and includes consumer or business confidence. Stronger aggregate demand factors boost spending, while weaker conditions slow spending. Aggregate supply (AS) represents the total volume of goods and services that the nation’s producers are collectively prepared to make available over a period. Aggregate supply factors can alter the total volume of goods and services supplied by affecting the general willingness and/or ability of individuals and businesses to produce goods and services, especially over the long term. These might include factors like labour productivity, tax rates on firms, and new discoveries of resources. More favourable aggregate supply conditions grow productive capacity/AS, while less favourable ones slow or reduce productive capacity/AS. Boom is a period of excessively strong economic activity and is shown as a peak on the business cycle. It is caused by spending rising faster than productive capacity, leading to widespread shortages of goods and services and hence inflation. Business confidence relates to the level of optimism or pessimism by firms about their future level of sales and profits. It affects upcoming levels of new private investment spending. Business cycle is used to describe how GDP changes upwards and downwards over a period of years. Typically, the economy passes through four main phases — a boom, slowdown, recession and recovery. In addition, the ideal economic situation is called domestic economic stability. It is located on the business cycle, midway between a boom and a recession. Circular economy is a more sustainable type of economic system where minerals and some other resources are used to make more durable goods of which when they have finished their useful life, can be recycled rather than thrown away as waste. Climate change in recent times relates to global warming caused by the release of greenhouse gasses resulting from the production, consumption and disposal of goods and/or services. Coincident indicators move very closely with actual changes in the level of economic activity (e.g. share prices, monthly retail sales). Common access goods are those things we all share and depend on like air, rivers and oceans. Consumer confidence relates to the level of household optimism or pessimism about future employment and income prospects. It affects upcoming levels of household consumption spending. Contraction is the downswing phase on the business cycle where the rate of growth in GDP is slowing. Typically, this is caused by a softer levels of national spending. Usually, as unemployment rises, inflation slows. Cyclical unemployment is when individuals lose their job due to weak AD and a slowdown or recession. Depression is a large economic downturn, such as those that occurred in 1889–93 and 1929–33. It is caused by UNCORRECTED PAGE PROOFS a significant fall in the level of aggregate demand. This results in large cutbacks in production, in turn resulting in high levels of unemployment and falling prices.
Disposable income is money available for spending after receiving welfare and paying tax.
Domestic economic stability is the ideal economic position for an economy to be in. Conditions do not get better than this, where simultaneously there is a strong and sustainable rate of economic growth (around 3 per
cent rise in GDP per year), full employment (around 4.0–4.5 per cent unemployment rate) and low inflation (an annual rise in general prices averaging 2–3 per cent). Economic growth exists when a country’s economy gets bigger and there is a rise in the volume of goods and services produced between one year and the next. Environmental sustainability would mean that economic prosperity and activity can be continued indefinitely into the future. Erratic indicators of economic activity show no pattern of change since their direction is caused by one-off events. Exchange rate for the A$ relates to the value of an $A when it is swapped for another currency in international transactions. Its value affects the values of exports and imports. Expansion or the recovery phase of the business cycle is where the level of real GDP is rising and growth rates are increasing towards 3 per cent per year. Export spending (X) represents overseas spending on Australian-made goods and services (e.g. cotton, wool, minerals, manufactured items and travel). This is an injection on the circular flow model. The five-sector circular flow model is a diagram that shows how the various parts of an economy interact. The five sectors include the household, business, financial, government and overseas sectors. The goal of full employment is a desirable situation when unemployment is low, at around 4.5–5 per cent of the labour force. The goal of strong and sustainable economic growth is an Australian government objective involving the fastest possible rate of growth in GDP each year that does not cause serious inflation nor undermine the achievement of other government economic or environmental goals. Some suggest that this represents an average growth in real GDP around 3 per cent a year. Government spending (G) represents public sector outlays that are designed to help satisfy the needs and wants of the community for goods and services (e.g. roads, water, schools, telecommunications). Green GDP is a measure of a nation’s economic growth adjusted downwards for the environmental impacts (e.g. the depletion of resources, environmental degradation and loss of biodiversity) of producing goods and services. Gross domestic product (GDP) is a quarterly or annual measure of the value of finished goods and services produced by a nation. It is also equal in value to AD and total incomes on the circular flow model. Gross domestic product per capita (GDP) is a quarterly or annual measure of the value of finished goods and services produced by a nation, divided by the population size. It is often used as a rough measure of average material living standards, although there are still limitations of this indicator (e.g. inequality in distribution of goods, services and incomes). Gross National Happiness (GNH) is a composite index made up of several indicators such as GDP per head, social support, health and life expectancy, freedom to make life’s choices, generosity and trust. Human Development Index (HDI) is one of the most widely used indicators of our economic development and wellbeing. It is an index created by combining a range of economic and social indicators. However, it does not incorporate environmental considerations. Import spending (M) is expenditure by Australians on foreign-made goods and services, which is designed to help satisfy our needs and wants (e.g. oil, electronics, travel). It is a leakage on the circular flow model, slowing AD. Income is the payment of money, generally to those who have sold productive resources to firms. Inflation refers to a situation where most prices paid for a basket of consumer goods and services are rising over a period, causing a drop in the purchasing power of money. It may be the result of higher production costs or general shortages of goods and services due to too much spending. Infrastructure represents capital resources like roads, ports, power, hospitals, railways, and water supply that enable businesses to produce other goods and services. Often this is provided by governments, sometimes in partnerships with private firms. There is economic infrastructure (e.g. the construction of the NBN, the new airport in Western Sydney) and social infrastructure (e.g. schools and hospitals). Injections are elements in the circular flow model (e.g. investment spending/I, government spending/G, and export spending/X), which act like an accelerator and add to the total value of spending on Australian-made goods and services. Interest rates are the price or cost of borrowing credit from banks. UNCORRECTED PAGE PROOFS Labour productivity or efficiency reflects the rise in the value of GDP produced per hour worked. It is seen as a favourable aggregate supply condition that grows a nation’s productive capacity and keeps prices lower. Lagging indicators only tell the level of activity that occurred some time ago (e.g. GDP figures, the unemployment rate)
Leading indicators can help to predict where the economy may be heading soon (e.g. consumer confidence, business confidence). Leakages are elements in the circular flow model (e.g. savings/S, taxes/T and spending on imports/M) that act like a brake and slow down the total value of spending in our economy. Long-term or run refers to changes in economic activity over perhaps 10 or 20 years, or more. Material living standards are dependent on a person’s level of income and consumption of goods and services measured over a period. Real GDP per head per year is often used as a rough indicator of material living standards. Measures of Australia’s Progress (MAP) is not a single statistical indicator of overall welfare, but is a collection of measures within four areas — society, the economy, governance, and the environment. It allows people to determine whether their wellbeing is progressing or regressing. Negative externalities are the costs transferred to third parties not directly involved in economic activities that result from the production and consumption of goods and services (e.g. global warming). Non-economic activities are generally not sold for money but are performed for emotional reasons, concern for others, or on a volunteer basis. Their value is not included in GDP. Non-material living standards are not related to the quantity of goods and services that we have, but instead are elements of our wellbeing that affect the quality of our daily lives, and may perhaps involve levels of freedom, happiness, quality of family life, justice, amount of leisure time, crime, health and life expectancy, pollution, and the state of the natural environment. Overseas economic activity relates to whether globally, demand and economic conditions abroad are strong or weak. Its level affects the sales of Australian exports or injections and, hence, AD. Peak is a phase on the business cycle diagram that occurs when GDP reaches its maximum level, and the rate of growth is strong. If there is a boom, inflation will rise and unemployment will fall to very low levels. Private consumption spending (C) represents household expenditure that is designed to help satisfy people’s immediate needs and wants for goods and services (e.g. food, holidays and clothing). It is the biggest component of AD. Private investment spending (I) is outlays by businesses for the purchase of machinery, technology and buildings (e.g. a tractor, a robot or a factory) used to help make other goods and services. It is designed to help grow efficiency and expand a firm’s productive capacity by growing its physical capital resources. Productivity is an aggregate supply factor that is a measure of efficiency — that is how much output is gained from a unit of resources or inputs used in production. GDP per hour worked is a measure of labour productivity. Recession is a period on the business cycle where there is very weak economic activity and GDP falls over at least two consecutive quarters. It is caused by a lack of spending, leading to much unused productive capacity. This results in high levels of unemployment, lower average incomes and depressed material living standards. Seasonal indicators are those that move in the same direction during the same month or time each year. Severe weather events include floods, cyclones, drought, and bushfires. They are unfavourable aggregate supply conditions that are linked with global economic activities, increased CO2 emissions, and global warming. Short-term refers to changes in direction of an economic variable lasting perhaps 1–5 years. Structural unemployment can occur when firms change their production methods and use new technology to become more efficient (such as robots on an assembly line, ATMs for banking, automated warehouses, online shopping and so on). It can also occur when firms relocate perhaps overseas, or there is a mismatch between the skills possessed by unemployed workers and the requirements of the jobs that are currently available. Total income is one of the four flows making up the circular flow model. It represents the value of payments to individuals selling resources used by firms to produce goods and services. It is equal in value to AD and GDP. Trough is the phase on the business cycle diagram that occurs when production reaches its lowest level. It may also represent a recession or depression, where GDP falls. Usually, unemployment is higher, and inflation is slower. Resourceseses Resources Digital document Key terms glossary (doc-37948) UNCORRECTED PAGE PROOFS
OUTCOME 1
Explain the purpose of economic activity, the distinction between material and non-material living standards and the factors that may affect levels of economic activity and growth, discuss the costs and benefits of economic growth and examine the impact of economic activity on living standards using alternative measures.
REPORT ON AN INVESTIGATION OR INQUIRY — Tracking Australia’s changing economic and other conditions affecting our living standards Background In the years leading up to mid-2008, the Australian economy experienced near-boom conditions. However, during 2008–09 this was suddenly interrupted by the global financial crisis (GFC) and there was a sharp contraction. Australia narrowly avoided a recession. This period was followed by a long and slow recovery till 2020. However, the last couple of years have seen considerable instability generated by the combined effects of sometimes volatile aggregate demand and aggregate supply conditions. For instance, in the first half of 2020, there was the COVID-19-induced recession where spending was weak, followed by a recovery. There were also bushfires, floods, cyclones, drought, the pandemic lockdowns, disruptions to supply chains, and war in Eastern Europe. Outline of the task As you know, when the level of economic activity and growth change, this has knock-on effects for jobs, unemployment, incomes and both material and non-material living standards. Your task here is to conduct research and then prepare and present a report about Australia’s changing macroeconomic conditions over recent years. The report has three parts: 1. Describe Australia’s changing macroeconomic and other conditions affecting living standards • Recent trends in material living standards: Consider three areas. ° Recent trends in economic growth: Using graphs, briefly describe the most recent trends in real or chain volume GDP (using annual or quarterly changes in real GDP as the measure) as an indicator of the level of economic activity and as a guide to changes in national incomes. ° Recent trends in unemployment: Using graphs, briefly describe the most recent trends in the unemployment rate (percentage of the labour force). ° Recent trends in inflation: Using a graph(s), briefly describe the most recent trends in the rate of inflation (use the annual or quarterly percentage change in the consumer price index or CPI as the measure). • Recent trends in non-material living standards: Using graphs, describe the most recent trends in two indicators of non-material living standards 2. Factors that have caused changes in economic activity and hence living standards • Aggregate demand factors: Select two important aggregate demand factors and explain how each has helped to shape recent economic conditions. Using two graphs, describe the most recent trends in these aggregate demand-side conditions. • Aggregate supply factors: Select two important aggregate supply factors and explain how each has helped to shape recent economic conditions. 3. Your forecast! • Given trends in economic growth over the last quarter (3 months), have a go at predicting the near-term future direction of the economy. A clue — recent trends in leading indicators might be useful here! Research resources There is much economic information available on the internet although not all sources are reliable. Often, quarterly or monthly data are useful for spotting changes in the economy’s direction since it is more up-to-date. As a start, you might like to check out some of the weblinks in the online resources. PresentationUNCORRECTED PAGE PROOFS Your report must include graphs and commentary. It could be presented in one of the following formats: • a PowerPoint presentation involving a series of illustrated slides, cartoons, pictures and of course graphs • a feature newspaper report or article • a wall poster for classroom display involving headings and a series of graphs with commentary beneath each.
Resources
Resourceseses
Weblinks Reserve Bank of Australia, RBA Chart Pack Australian Bureau of Statistics (ABS) – GDP Australian Bureau of Statistics (ABS) – Unemployment Australian Bureau of Statistics (ABS) – Inflation Trading Economics (data for Australia) Macrotrends 4.16 Exam questions
Students, these questions are even better in jacPLUS
Receive immediate feedback and access sample responses Access additional questions
Track your results and progress Find all this and MORE in jacPLUS 4.16 Section A: Multiple choice questions Question 1 MC Which of the following statements about economic activity is least correct? A. It refers to the actions of individuals involving the making and selling goods and services. B. To be included in GDP, goods and services usually need to be sold for money or income. C. The value of GDP is commonly used as a measure of economic activity. D. The value of work performed by volunteers is normally included in GDP. Question 2 MC In an economy, real economic growth always occurs when: A. there is more spending on goods and services between one year and the next. B. there is more production of goods and services between one year and the next. C. there are more resources available between one year and the next. D. business activity is steady between one year and the next. Question 3 MC Concerning chain volume GDP as a measure of total economic activity or the size of the economy, which statement is generally false? A. It measures the annual value of most goods and services produced. B. In the circular flow model, it can also be estimated by measuring AD or the total incomes paid to producers. C. It has had to be adjusted to help remove the effects that inflation or deflation have on the value of production. D. Its value includes all goods and services produced in the country (including washing the dog, home-grown UNCORRECTED PAGE PROOFS vegetables, trade in illegal guns) and it makes a downward adjustment to allow for negative externalities.
MC Which one of the following would have an effect on the rate of economic activity and economic growth that is different from that of the other three?
A. The government announces a cut in income tax. B. Households feel pessimistic about future employment prospects and fear that they may soon become unemployed. C. The rate of economic growth in the United States and Japan strengthens, combined with a lower exchange rate for the A$. D. Interest rates fall following an announcement by the RBA.
Question 5
MC Given the hypothetical data in table 4.24, predict what might be happening to the country’s rate of economic activity or growth. Assume that the country has been enjoying a 4 per cent annual rate of economic growth with fairly low unemployment. A. The rate of economic growth will probably tend to accelerate. B. It is impossible to predict anything about the rate of economic growth. C. The rate of economic growth will probably tend to slow. D. There will tend to be a boom. TABLE 4.24 Hypothetical data relating to percentage changes in AD for a country
Component of AD Annual percentage growth last year
Annual percentage growth this year C 1 I 4 2 G 2 1 X 7 4 M 9 9 Question 6 MC Referring again to table 4.24 from question 5 and the two-year trend in the components of AD (C + I + G + X − M), which one of the following causes is most likely to be a correct explanation? A. Businesses became more optimistic about sales and profits. B. Economic activity overseas must be rising. C. There has probably been a fall in household disposable income. D. The government has recklessly increased budget spending on public works and community services such as health and education. Question 7 MC In the long-term, an economy needs more than just increased spending to sustain an increase in production or GDP. Which of the following is not a correct explanation of this statement? A. Strong spending or AD cannot make an economy grow any faster once it has reached its productive capacity 5 UNCORRECTED PAGE PROOFS or potential GDP. B. The lack of access to extra resources restricts production levels and economic growth in some economies. C. Some economies cannot lift the growth rate in output because of low efficiency in production. D. In the long term, spending is always too low for the economy to fully use its capacity.
MC Which one of the following aggregate supply developments would tend to affect Australia’s long-term rate of growth in output or GDP in a different way from that of the other three?
A. The use of genetically modified crops by farmers B. Successful measures to help drought-proof Australian farmers C. Legislation that lowers the minimum retirement age for workers to 60 years D. Legislation that raises the minimum school leaving age to 17 years
Question 9 MC Which of the following would not tend to lift Australia’s long-term level of national output? A. A fall in the percentage of adult females choosing to be in the labour force B. Government policies designed to help lift efficiency by providing free re-training courses for the unemployed C. An increase in the normal retirement age from 65 to 67 years D. Encouragement of mineral exploration and R&D. Question 10 MC Concerning the effects of an increase in the level of economic activity, which of the following is false? A. Attempts to increase the level of economic activity through greater efficiency and cost cutting by firms can sometimes lead to higher structural unemployment in the short-term. B. Higher economic activity usually causes unemployment to fall. C. Without special government policies, such as progressive income taxes or welfare benefits for the needy, there is the danger that rises in economic activity may increase inequality in incomes. D. An increase in economic activity usually slows the rate of inflation. Question 11 MC Increased economic activity: A. can lead to global warming and severe weather events that undermine material and non-material living standards. B. can sometimes contribute to lower living standards for future generations. C. can cause negative externalities such as reduced leisure time, traffic congestion, urban overcrowding, and waste disposal problems for cities. D. can cause all the above. Question 12 MC The level of private consumption spending (C) and the level of economic activity or GDP are likely to fall if there was a: A. rise in consumer confidence. B. fall in household savings. UNCORRECTED PAGE PROOFS C. rise in household income. D. rise in government tax rates.
MC The level of private investment spending (I) and rate of economic activity or GDP would tend to increase if there was a:
A. rise in business confidence about future sales and profits. B. rise in interest rates on bank loans to businesses. C. fall in business profits. D. rise in the rate of company tax on firms.
Question 14 MC The value of spending on Australian exports (X) is likely to rise if: A. there was a recession overseas. B. exports become dearer or less competitive for overseas buyers. C. the exchange rate for the A$ fell making exports cheaper for overseas consumers. D. there was a drought or floods in Australia that destroyed our crops. Question 15 MC Which statement about Australia’s AD is most correct? A. C represents private household consumption including spending on takeaway food, holidays, and clothes. B. Aggregate demand is the total of all types of spending on our goods and services over a period of time, represented by C + I + G + X + M. C. I represents business spending, which would rise if business confidence fell. D. If AD rose, GDP would fall. Question 16 MC Using table 4.25, which of the following statements about AD in a hypothetical economy in 2020–21 and 2021–22 is incorrect? A. AD was higher in 2024 than in 2023. B. AD was $17.3 million in 2023 and $17.9 million in 2024. C. Theoretically, the change in private or household C in 2024 may have reflected weaker consumer confidence than existed in 2023. D. The value of net exports over the period 2023 to 2024 did not change and was equal to $0.1 million in both years, thereby tending neither to boost nor slow AD and the rate of economic growth. TABLE 4.25 Estimates for a hypothetical economy in 2023 and 2024 Component 2023 ($ millions) 2024 ($ millions) Private consumption (C) 9.6 10.0 Savings (S) 1.3 1.4 Private investment (I) 3.6 3.5 Tax revenue (T) 3.6 3.6 UNCORRECTED PAGE PROOFS
Government outlays (G) 4.0 4.3
Imports (M)
Exports (X) 3.5
3.6 3.8
3.9
MC Again, using the data contained in table 4.25 from question 16, which statement about leakages and injections is most correct?
A. The total value of leakages rose between 2023 and 2024. B. The total value of leakages increased from $8.4 million in 2023 to $8.8 million in 2024. C. The total value of injections was lower in 2023 relative to the total value of injections in 2024. D. All of the above statements are correct.
Question 18 MC Which of the following would be least likely to increase a country’s rate of economic growth and activity over the short-term? A. Increased investment levels and the expansion of capital resources B. Farming methods resulting in better soil management and fertility C. Increased concern over environmental matters and Indigenous land claims (which have reduced access to natural resources) D. The accelerated application of new technology in industry Question 19 MC A negative externality is best illustrated by which of the following examples? A. You clean up and beautify your front garden, which is visible from the street. B. The club near your house runs its noisy and unruly venue each Friday and Saturday night until 3 am. C. A coal mining company restores a damaged mine site and replants the native vegetation. D. You pay for the cost of renovating the inside of your house. Question 20 MC Concerning types of economic indicators, which of the following is most correct? A. Consumer confidence is a coincident indicator of economic activity. B. GDP is a lagging indicator of economic activity. C. New building approvals by councils are an example of a leading indicator of economic activity. D. Over a year, unemployment can change in a seasonal way. 4.16 Section B: Extended response questions Question 1 (9 marks) a. Clearly distinguish material living standards from non-material living standards. (2 marks) b. If a nation’s real value of GDP in 2023 was equal to $1500 billion, and its population was 25 million, calculate the average value of real GDP per capita. Show your working. (1 mark) c. Explain the extent to which GDP per capita is an accurate measure of a nation’s overall living UNCORRECTED PAGE PROOFS standards. (3 marks) d. Identify and explain an alternative measure of a society’s overall living standards. Explain why your chosen measure may be superior to using real GDP per capita. (3 marks)


