
11 minute read
4.4 The five-sector circular flow model


Resources
Resourceseses
Advertisement
to come
4.2 Activities
Receive immediate feedback and access sample responses Access additional questions
Track your results and progress Find all this and MORE in jacPLUS 4.2 Quick quiz 4.2 Exercise 4.2 Exercise 1. Define the term, economic activity. (1 mark) 2. Examine figure 4.2. List six economic activities represented in the image. (3 marks) FIGURE 4.2 Economic activities 3. Distinguish economic activity from non-economic activity. (2 marks) UNCORRECTED PAGE PROOFS 4. Examine the table below. Briefly outlining your reasons, classify each item as to whether it is an economic activity or a non-economic activity.
TABLE 4.1 Economic and non-economic activities
Item
a. You have a job at McDonalds on Saturdays
b. A farmer sells 300 sheep to another farmer in NSW
c. You attend a day event run by Clean Up Australia
Limited
d. Cathy spends 3 hours a day looking after her mother
e. After John hurt his wrist playing footy, he saw his doctor and had an x-ray
5. a. In general terms, explain how a country attempts to estimate or measure its overall level of economic activity.
Classification and reasons
(2 marks) b. Outline why it is not possible to accurately measure the total value of all economic activity in a country over a period. (1 mark) 6. a. Explain the end or ultimate purpose of economic activity. (2 marks) b. Outline the links between the level of economic activity and material living standards. (2 marks) Fully worked solutions and sample responses are available in your digital formats. 4.3 The meaning of material and non-material living standards KEY KNOWLEDGE • the meaning of material and non-material living standards Source: VCE Economics Study Design (2023–2027) extracts © VCAA; reproduced by permission. 4.3.1 Definition and nature of living standards In all economies, the main purpose of economic activity is to help satisfy society’s needs and unlimited wants using the limited resources available. The extent to which this satisfaction is successful will have a direct impact on Australian living standards. Living standards relate to our general level of wellbeing. As shown in figure 4.3, there are two main elements that affect our general or overall living standards: • Material living standards are affected by the annual average level of income and consumption per person per year. • Non-material living standards reflect the quality of daily life. 4.3.2 How changes in the level of economic activity can affect living standardsUNCORRECTED PAGE PROOFS As mentioned, changes in the level of economic activity can have both positive and negative effects on living standards. Sometimes, there are trade-offs (costs or the things we would need to give up when we decide to use resources in a particular way). For example, more economic activity might improve material living standards, but at the expense of some aspects of non-material wellbeing. In reverse, lower economic activity will undermine material living standards although non-material, environmental outcomes may be better.
Overall living standards
• In co me pe r pe r s o n • L e v el of c ons ump ti o n o f g o o d s and s e r v i c e s p er pers on • T h e pu rc ha s i n g po w er o f i nco mes .

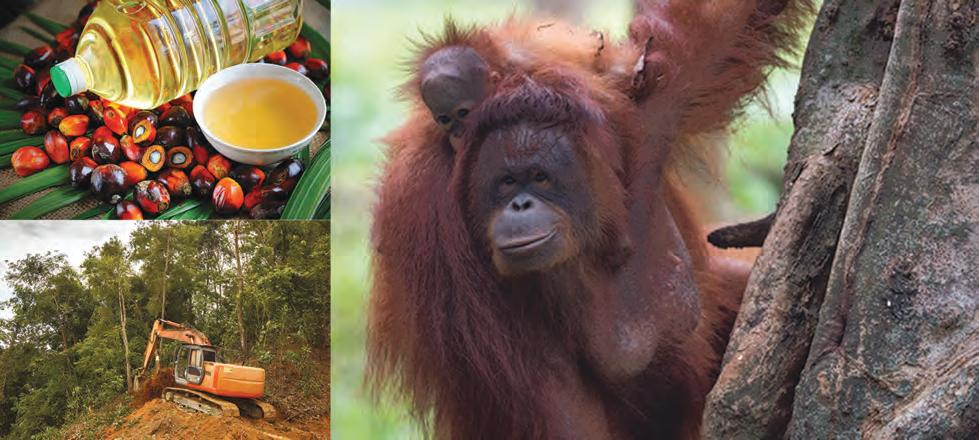
T h e q u al i t y of da i l y l i f e • H appine s s • L i f e expe c t a nc y • Men t al a n d phy s i cal heal th • F re edom • T h e s t a t e of t he env i r o n m en t • L e is u re t i m e • C rime r a t e s • L i t eracy r a t e s • Q uali t y of re l a t i o ns hi p s Material living standards reflect . . . Non-material living standards reflect . . . FIGURE 4.4 Internationally, every country faces decisions about how to use scarce resources in order to gain economic growth. In Malaysia, Borneo rainforests are being cleared to make way for palm oil plantations. Are there benefits to having a strong economy if it is destroying its environmental base, threatening future living standards?UNCORRECTED PAGE PROOFS

• The effect on material living standards: Up to a point, when the pace of economic activity gets stronger this tends to lift material living standards. This is because higher production generally results in increased jobs and incomes, boosting consumption spending. Of course, if economic activity becomes too strong, this can cause prices to rise reducing the purchasing power of incomes. • The effect on non-material living standards: Most (but not all) aspects of non-material welfare, also benefit from higher levels of economic activity. For example, when production is expanding, and employment and incomes rise, this helps to reduce stress and social isolation, strengthen people’s mental and physical health, and improve the quality of relationships. Even so, environmental outcomes are likely to suffer because of increased pollution, accelerated climate change, and the faster depletion of non-renewable natural resources.
• The effect on material living standards: When economic activity falls, this undermines material living standards because of lower employment, incomes, and consumption. • The effect on non-material living standards: Lower economic activity that causes higher unemployment and reduced incomes, tends to undermine the quality of life and most aspects of non-material living standards. One problem is that if activity is lower and more people are unemployed, this often leads to social isolation, reduced mental and physical health, unhappiness, possibly higher crime rate, increased stress, and negative feelings of personal failure. However, a possible upside is that there is less pollution and pressure on the environment.
FPO
Resourceseses Resources
To come 4.3 Activities
Receive immediate feedback and access sample responses Access additional questions
Track your results and progress Find all this and MORE in jacPLUS 4.3 Quick quiz 4.3 Exercise 4.3 Exercise 1. Define the term, standard of living. (2 marks) 2. Relatively, Australia has a high standard of living. Explain exactly what this means, referring to various indicators. (2 marks) UNCORRECTED PAGE PROOFS 3. Examine the table below. Classify each item as to whether it is something that is likely to increase or decrease material living standards and/or non-material living standards. Briefly explain your reasons. (6 marks)
TABLE 4.2 Influences on our overall living standards
Item Classification of the impact and your reason
a. There was a rise in Australia’s average life expectancy
b. Average incomes fell during the COVID-19 pandemic c. Australia’s CO2 emissions fell
d. For your job on weekends, you were paid $1500 for the year
e. Literacy rates have increased, and crime rates decreased
f. Julia loses her full-time job at the pizza shop
4. Australia experienced a recession in the first half of 2020. Giving reasons, explain how this would be likely to affect: a. Material living standards (2 marks) b. Non-material living standards. (2 marks)
Fully worked solutions and sample responses are available in your digital formats. 4.4 The five-sector circular flow model KEY KNOWLEDGE • the five-sector circular flow model of the economy Source: VCE Economics Study Design (2023–2027) extracts © VCAA; reproduced by permission. We have recently learnt that people are involved with economic activities so they can earn income, allowing them to consume goods and services. In turn, this means that they can usually satisfy their most pressing needs and wants and enjoy reasonable living standards. To better understand this process, economists use models or diagrams representing how the economy works and economic activity occurs. In Chapter 1, we introduced a very basic three-sector circular flow model. This is shown in figure 4.5. However, while useful, the three-sector model has limitations. It is not all that realistic because it doesn’t allow for the saving of income and international trade, both of which impact the level of economic activity, employment, incomes and living standards. To help reduce these shortcomings and better understand the drivers of economic activity, let’s now look at the improved five-sector circular flow model. It simply builds onto the basic three-sector model by adding two additional sectors — the financial sector and the trade or overseas sector. 4.4.1 The five-sector circular flow model of an economy As evident from figure 4.6, notice that although this model has two main sectors (the household and business UNCORRECTED PAGE PROOFS sectors), it also has three lesser sectors (the financial, government and overseas sectors), making five in total.
The consumer or household sector
This consumer or household sector includes nearly 26 million consumers or spenders, making up Australia’s entire population. Everyone in the country belongs to this sector. Apart from making decisions about spending, some households also supply or sell resources to the business sector.
Flow 4 = the nation’s flow of finished goods and services produced
Flow 2 = the nation’s flow of all incomes paid
Flow 1 = the nation’s flow of resources Consumer spending (C) on goods and services
Consumer/ Producer/ household sector business/ private sector Government/
Government tax (T) public sector Government spending revenue flows in = a (G) flows out = an leakage from spending injection of spending
Flow 3 = the nation’s flow of total spending on goods and services The producer or business sector The producer or business sector consists of over 2.2 million trading enterprises (e.g. sole traders, partnerships, public companies). They supply or sell finished goods or services, using resources purchased from households. Businesses also make decisions about investment levels, production and how many staff to employ. The financial sector The financial sector consists of organisations such as banks, credit unions, building societies, the stock exchange and life insurance companies. According to this model, these institutions collect or borrow household savings from some individuals and re-lend them as credit to businesses wanting to expand their operations through investment spending involving the purchase of new plant and equipment. The government sector The government sector includes the activities and decisions of federal, state, and local governments. It collects various types of tax revenue from those earning income and then uses this to help pay for government spending on the provision of goods and services for the community (e.g. public roads, health, education, transport and housing). The overseas sector The overseas sector involves spending by Australian residents on imports of goods (e.g. cars and phones) and services (e.g. international travel), along with spending by people in overseas countries on our exports of goods (e.g. iron ore and beef) and services (e.g. tourism and education). You may have noticed that the five-sector model also has four main flows or streams that link the sectors of the model:UNCORRECTED PAGE PROOFS Flow 1 Resources available
Flow 1 is the flow or supply of resources (labour, capital and natural resources) over a period of time from the household sector to the business sector. Ultimately, a nation’s productive capacity, potential output or supply of goods and services is determined by the volume and efficiency of its productive resources. As mentioned earlier,
it is not possible for countries to produce more than their resources will permit. This limits a nation’s productive capacity. Hence, the expansion of resources is vital if the supply of goods and services produced in an economy is to grow between one year and the next.
FIGURE 4.6 The five-sector circular flow model showing the basic working of the Australian economy
Flow 4: Flow of final goods and services supplied or produced (i.e. GDP)
Income dispensed as ... Import spending (M) demand = C + I + G + X – M on Australian production = aggregate Flow 3: Flow of total spending
Three leakages from domestic spending = S + T + M (slow AD)
Financial sector Government sector Overseas sector
Three injections into domestic spending = I + G + X (boost AD)
Flow 2: Flow of incomes to owners selling resources A MACROECONOMIC CIRCULAR FLOW MODELHousehold sector Business sectorOF THE AUSTRALIAN ECONOMY Flow 1: Flow of productive natural, capital and labour resources supplied Flow of private consumption spending on final goods and services (C) Savings (S) Taxes Government (T) spending (G)
Investment spending (I) Export spending (X) Flow 2 Total incomes Flow 2 is the payment of total income over a period of time (e.g. made up of wages, profits, interest and rent) to those households that have sold resources. As such, it represents the demand by businesses for resources. The more resources bought by firms each year, the higher the employment rate and the total level of national income. However, total incomes fall when there are fewer resources wanted or employed by firms. This causes unemployment to rise. Flow 3 Total spending Flow 3 represents aggregate demand (AD) or total annual spending on Australian-made goods and services measured over a period of time. This reflects the spending decisions made by households, businesses, and governments, both here and overseas. AD is made up of components of expenditure including private consumption spending (C), plus private investment spending (I), plus government spending (G), plus overseas spending on Australian exports of goods and services (X) minus Australian spending on imports of goods and services (M). UNCORRECTED PAGE PROOFS


