
37 minute read
2.9 Researching a contemporary Australian or global market


Individuals who earn higher incomes by selling their scarcer FIGURE 2.19 The distribution of incomes resources can purchase more goods and services than those and goods can be a concern in the free on lower incomes. For instance, high wages and incomes market system. are earned by skilled surgeons, successful entrepreneurs and well-known pop stars and sportspersons, who can sell scarce resources where there is a shortage and their supply is low relative to demand. By contrast, those with lesser skills or no reputation will usually earn lower wages and income, and be unable to purchase as many goods and services. Again the market allocates scarce resources between alternative uses. One problem faced by the free market system when answering the question about how to distribute incomes and goods is extreme income inequality and poverty, lowering average living standards. Again, when the market fails to produce fair or equitable outcomes, the government may choose to narrow the income gap between the rich and poor using heavier progressive taxes (i.e. when tax rates rise with income) on the rich, the payment of welfare benefits to the neediest and the provision of free or cheap community services.
Resourceseses Resources Weblinks Market prologue Law of demand Demand Demand and supply Change in demand vs change in quantity demanded Basic concepts of supply and demand Supply Demand and supply (EconMovies 4: Indiana Jones) Market equilibrium Price signals Demand and supply explained Markets link the world Demand and supply explained 2 The power of the market (featuring Milton Friedman) Shifting demand and supply Fruit shop economics What do prices ‘know’ that you don’t? 2.8 Activities
Advertisement
Students, these questions are even better in jacPLUS
Receive immediate feedback and access sample responses Access additional questions
Track your results and progress Find all this and MORE in jacPLUS 2.8 Exercise 2.8 Quick quiz 1. Explain how, in general, the market or price system works to answer the three basic economic questions faced by all economies. (6 marks) 2. Figure 2.20 shows the change in electricity prices in Australia over the past two decades or so. UNCORRECTED PAGE PROOFS
FIGURE 2.20 Index showing changes in Australia’s electricity prices
160.0 Index showing changes in Australia’s electricity prices
140.0
0.0 20.0 40.0 60.0 80.0 100.0 120.0 M ar -2000 De c2000 Sep-2001 J un -2002 M ar -2003 De c2003 Sep-2004 J un -2005 M ar -2006 De c2006 Sep-2007 J un -2008 M ar -2009 De c2009 Sep-2010 un -2011 M ar -2012 De c2012 Sep-2013 J un -2014 M ar -2015 De c2015 Sep-2016 J un -2017 M ar -2018 De c2018 Sep-2019 J un -2020 M ar -2021 De c2021 Sep-2022 Price index, electricity Quarter and year Source: Derived from ABS, CPI, Data downloads, Tables 11 and 12, CPI: Group, Subgroup and Expenditure Class, Percentage change from previous quarter by Capital City, see https://www.abs.gov.au/statistics/economy/price-indexes-and-inflation/consumer-price-index-australia/latestrelease#data-download; Image, Shutterstock, https://www.shutterstock.com/image-vector/electricity-conceptpower-transmission-tower-electric-530892943 Previously, it was suggested that the overall rise in Australian power prices was partly due to the demand for electricity increasing faster than the supply. Electricity prices affect both production costs for businesses using electricity, as well as household living costs. a. Using the information in figure 2.20, describe the change in electricity prices as measured by the electricity price index. (3 marks) b. The overall rise in the price of electricity, especially in the years preceding 2019, relative to other consumer prices has many impacts on how the three basic economic questions are answered and the way our resources are used or allocated. Explain how the rise in the relative price of electricity would be likely to affect the following, assuming other things remaining equal or unchanged? i. The level of profits made by power companies and their allocation of resources into power generation including renewable energy (1 mark) ii. The costs for businesses using electricity as an input to make other goods (e.g. aluminium) and services, as well as their level of profits (1 mark) iii. The allocation of resources, production and employment levels for companies using electricity as an input (2 marks) iv. The relative profitability of producing goods and services that do not require electricity as a resource or input (1 mark) To help counteract rising electricity prices for households and to reduce the environmental effects of coal-fired power generation, some governments have given financial assistance such as cash subsidies to households installing solar panels. c. Draw and fully label a D–S diagram (use hypothetical data) to show the likely effects of this policy on the J UNCORRECTED PAGE PROOFS market for solar panels. Show the D and S conditions both before and after the introduction of subsidies paid to buyers. Briefly explain the key changes shown on your diagram. (3 marks)
d. Draw and fully label a D–S diagram (use hypothetical data) to show the likely effects of solar panel subsidies on the market for electricity that is drawn from the national power grid. Show the D and S conditions both before and after the introduction of subsidies. Briefly explain the key changes shown on your diagram. (3 marks) e. Looking at figure 2.20, outline whether you feel that solar panel subsidies have helped to make electricity more affordable for consumers. (1 mark) 3. Assume the skateboard market is a fairly competitive one. a. Use the data in table 2.8 to accurately draw and fully label a demand–supply diagram for skateboards. (2 marks) TABLE 2.8 Demand–supply data for skateboards
Price per skateboard Original demand at a given price (D1) Original supply at a given price (S1) New increased demand at a given price (D2)
4. New decreased supply at a given price (S0) $20 100 20 115 10 $40 80 40 95 20 $60 60 60 75 30 $80 40 80 55 40 $100 20 100 35 50 b. Estimate is the original equilibrium price for skateboards resulting from the impact of non-price conditions on D1 and S1. (1 mark) c. Estimate is the original equilibrium quantity for skateboards resulting from the impact of non-price conditions on D1 and S1. (1 mark) d. Suggest two non-price microeconomic conditions or factors that might cause the increase in the quantity of skateboards demanded at a given price, shifting the demand line from D1 to D2. (2 marks) e. Following the increase in the demand for skateboards (from D1 to D2), there was a shift in the equilibrium. Clearly explain how there was a shift in the equilibrium (from E1 to E2), referring to points on your diagram. (3 marks) f. Suggest two non-price conditions or factors that might cause the decrease in the quantity of skateboards supplied at a given price from S1 to S0. (2 marks) g. Following the decrease in the supply of skateboards (from S1 to S0), there was a shift in the equilibrium. Clearly explain how there was a shift in the equilibrium (from E1 to E0), referring to points on your diagram. (3 marks) h. Events that change the relative price (either up or down) for a particular good or service alter the relative profit, and hence the way resources are allocated or used. If the relative price of skateboards rises, explain (giving reasons) how this would be likely to affect each of the following: i. the level of relative profits from producing skateboards ii. the quantity of resources allocated to producing skateboards and skateboard-related clothing, skate parks and other gear iii. the quantity of resources allocated to other goods and services that had become relatively less profitable than skateboards. (3 marks) Changes in relative prices in various markets send out signals (incentives) to producers and the profit-seeking owners of resources — indicating the type and quantity of each good or service consumers want to see produced. a. Explain what is meant by the term relative prices, giving an example. (2 marks) b. For each of the following, explain (giving reasons) how producers may change their use or allocation of resources and their level of output, assuming that production costs are unchanged: i. Canola prices rose to from $520 to $595 per tonne, but wheat prices fell. ii. Average weekly wages for unskilled labour rose 2 per cent, compared with a 25 per cent rise for computer technicians. UNCORRECTED PAGE PROOFS iii. Increasing awareness about the health benefits of avocados have seen a steady increase in the price of avocados, while health concerns about soy-based products have had the opposite effect on the selling price of rice. (3 marks)
FIGURE 2.21 Predicted changes in or key commodities for 2022-23.
Wheat Coarse grains Oilseeds
1 March 2022 World wheat prices to ease but remain historically high. Read more about wheat 1 March 2022 Improving labour situation expected to support production prospects over the medium term. Read more about horticulture 1 March 2022 Supply chain disruptions easing and global growth recovering means mixed prospects for fibers. 1 March 2022 Easing rebuilding sees prices fall, but remain historically high.
1 March 2022 Elevated inventories and disrupted sales to see grape prices fall. Read more about wine and wine grapes 1 March 2022 Strong export demand in the US is expected to support high lamb prices.
–6% to US$ 310/t in 2022–23 Horticulture 1 March 2022 Fall in international sugar price driven by recovering global production. Read more about sugar
Natural fibres 1 March 2022 Coarse grain prices to ease due to increasing global supply. Read more about coarse grain Wine and wine grapes Sugar Beef and veal Sheep meat
1 March 2022 Decreased canola price driven by recovering global canola production. Read more about oilseeds
4% to $12.5 billion in 2022–23
–9% to 718 Ac/kg in 2022–23
–7% to US$ 266/t in 2022–23 –5% to $544/t in 2022–23
5% to 934 Ac/kg in 2022–23
–26% to US$ 604/t in 2022–23 –11% to USc 17lb in 2022–23 UNCORRECTED PAGE PROOFS Read more about beef and veal
Read more about natural fibers Read more about sheep meat
Source: ABARES, Agricultural outlook, March 2022, Outlook, see https://www.awe.gov.au/abares/research-topics/agricultural-outlook
Assume you are a farmer and are able to use your resources to produce any of these agricultural commodities. i. Based on this price information alone, select two commodities you would produce and two commodities you would not produce. Justify your choices. (2 marks) ii. Suggest two likely non-price conditions or factors that might have caused the relative prices of these agricultural commodities to change up or down. (2 marks) 5. Assume that the federal government decided to provide special financial assistance like a cash subsidy to all private businesses producing or supplying clothing to help them compete and survive. You are a local manufacturer in this moderately competitive market involving other business rivals. a. Draw a hypothetical demand–supply diagram representing the market for clothing before the government paid the subsidy. Label all data on this diagram (show D1, S1, Pe1, Qe1, the names and units of the axes, and an appropriate title). On this D–S diagram, show the likely effects on the location of the supply line after the government gave this financial assistance. Again, ensure that all new data on this diagram are labelled (show S2, Pe2, Qe2). (4 marks) b. Explain why you shifted the location of the supply line in the way you did (i.e. from S1 to S2). (1 mark) c. Carefully explain the main steps whereby the equilibrium price would be likely to fall from P1 to P2. (3 marks) d. Explain how the government’s new subsidy would be likely to affect the quantity of resources (i.e. the quantity of labour, capital and natural resources) allocated to the production of clothing. (2 marks) Fully worked solutions and sample responses are available in your digital formats. 2.9 Researching a contemporary Australian or global market KEY KNOWLEDGE • one contemporary example of a market, including the degree of competition in that market KEY SKILL • research and synthesise information about a particular market • analyse the extent of competition in markets by drawing conclusions based on economic criteria. Source: VCE Economics Study Design (2023–2027) extracts © VCAA; reproduced by permission. The market is a living, exciting and rapidly changing institution that operates around the clock. It is of enormous importance to our daily lives. As we know, Australia like most other countries these days, has a predominantly market-based economy where key economic decisions are made (sometimes with a limited amount of government guidance). To connect market theory more closely to the world around us, the VCE Economics Study Design (2023–27) suggests that you undertake a case study involving one the following contemporary local or international markets: • agricultural markets such as wool, wheat, milk and beef • other commodity markets such as minerals and energy • community markets • utilities markets such as gas, electricity, water and telecommunications • carbon emissions/carbon trading markets UNCORRECTED PAGE PROOFS • finance markets • cryptocurrency markets • international education markets • tourism markets • share markets
• foreign exchange markets • labour markets • property/housing markets • online markets • health markets • any other markets.
In investigating the nature and operation of your chosen market, you will need to undertake research, synthesise information from a variety of sources, construct graphs, and use economic concepts and tools.
To help get you started, the upcoming pages of the text provide a general introduction to ten of these market case studies. In addition, for each there are suggestions about how to structure your report headings, along with a graph(s) showing changes in market prices.
This section of the text provides a general outline of each market, along with some questions to guide your internet research outside of this text. Use the Case study research task digital document in the Resources tab to download a detailed outline on how to approach this investigation.
Resourceseses
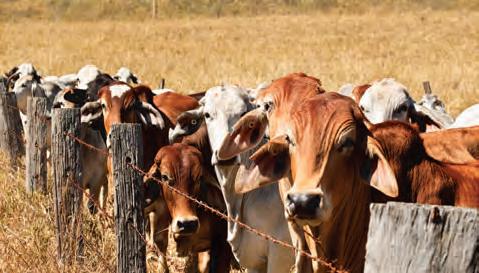
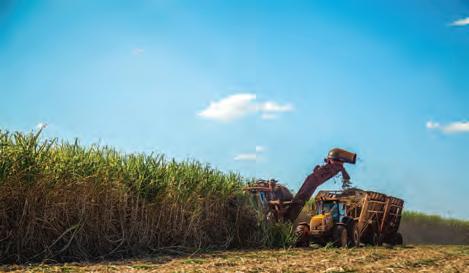
Resources Digital document Case study research task CASE STUDY 1: AGRICULTURAL COMMODITY MARKETS Nature Australian farmers sell their wheat, barley, wool, canola, beef, lamb, eggs, fruits and vegetables to wholesalers and retailers in rural or agricultural commodity markets both here and overseas. The price negotiated by buyers (D) and sellers (S) will reflect the relative scarcity of each rural commodity. Sometimes international selling is done by representative organisations. Again, the prices of agricultural commodities are determined at market equilibrium by the interaction of sellers and buyers. The prices of agricultural commodities change to reflect new non-price conditions of demand and supply. Especially on the supply side, conditions can change as a result of both favourable and less favourable growing conditions (e.g. droughts and severe weather events). FIGURE 2.22 Conditions of demand and especially supply can affect the market price of agricultural commodities. For example, severe weather events like cyclones and droughts can decrease supply relative to demand and cause a rise in the relative market price. Structure for your case study research into a selected agricultural commodity market UNCORRECTED PAGE PROOFS You might like to use the following section headings to guide your research into a selected agricultural commodity market. In addition, a more detailed template for headings and ideas is provided later in section 2.10.3, Practice school-assessed coursework. • Introduction: What are the general features of your selected agricultural commodity market? What type of market structure applies in this industry? How have market prices changed over recent years?
• Demand: Who are the demanders, buyers or consumers of your selected agricultural commodity and what factors affect their decisions? How have non-price demand conditions changed recently? Try to illustrate these hypothetically, using a D–S diagram showing the before and after effects on market demand, and the equilibrium price and quantity. • Supply: Who are the suppliers or sellers of your selected agricultural commodity and what affects their decisions? How have non-price supply conditions changed recently? Try to illustrate these hypothetically, using a D–S diagram showing the before and after effects on market supply, and the equilibrium price and quantity. • Effects: What are the likely effects of changes in the relative market price of your selected agricultural commodity on the economic decisions and the answers to the three basic economic questions? By way of example, figure 2.23 uses three graphs to show recent price changes in a selection of agricultural commodity markets (usually measured in US dollars). You might like to start your agricultural commodity research by following the weblinks in the Resources tab.
FIGURE 2.23 Price changes for a selection of agricultural commodity prices (actual and forecast). 1500 1000 500 2021–22 Ac/kg 2000–01 2002–03 2004–05 2006–07 2008–09 2010–11 2012–13 2014–15 2016–17 2018–19 2020–21 2022–23z 2024–25z 2026–27z
Graph 1 – Changes in wool prices and price forecasts, Eastern market indicator (Ac per kilogram) 2500 Historical Faster recovery scenario 2000 Slower recovery scenario f ABARES forecast. z ABARES projection. Source: ABARES, Agricultural Commodities: March quarter 2022, page 63. 900 800 700 600 500 400 300 200 100 2021–22 c/kg 2000–01 2001–02 2002–03 2003–04 2004–05 2005–06 2006–07 2007–08 2008–09 2009–10 2010–11 2011–12 2012–13 2013–14 2014–15 2015–16 2016–17 2017–18 2018–19 2019–20 2020–21 2021–22f 2022–23f 2023–24z 2024–25z 2025–26z 2026–27z
Historical Faster recovery Slower recovery Graph 2 – Changes in beef meat prices and price forecasts (Ac per kilogram) UNCORRECTED PAGE PROOFS
f ABARES forecast. z ABARES projection.
Source: ABARES, Agricultural Commodities: March quarter 2022, page 71.
Graph 3 – Changes in sheep and lamb meat prices and forecasts (Ac per kilogram)
1200
1000
800
600
400 200 Cents per kg 2000–01 2002–03 2004–05 2006–07 2008–09 2010–11 2012–13 2014–15 2016–17 2018–19 2020–21 2022–23z 2024–25z 2026–27z
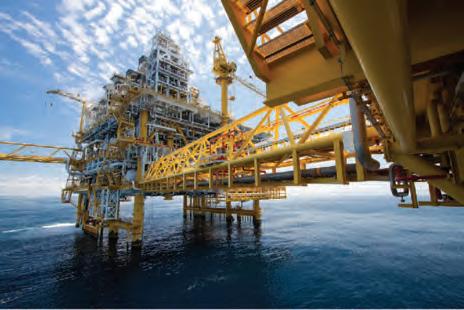
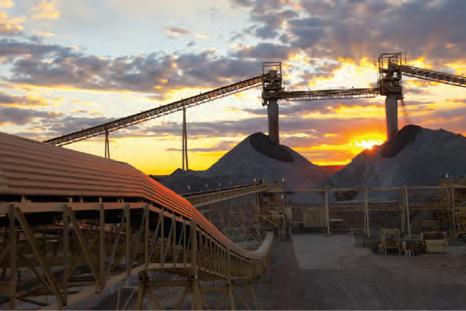
Lamb price Sheep price Faster economic recovery Slower economic recovery f ABARES forecast. s ABARES estimate. z ABARES projection. Source: ABARES, Agricultural Commodities: March quarter 2022, page 77. Resourceseses Resources Weblinks Australian Bureau of Agricultural and Resource Economics (ABARES) YQ Matrix graphs figure 2.0 CASE STUDY 2: MINERAL COMMODITY MARKETS Nature Non-rural commodity markets involve the selling (S) and buying (D) of raw materials and energy at a negotiated price that will reflect their relative scarcity. Firms producing or supplying commodities sell to other firms who need these materials for making finished products that are sold to customers or buyers. Important internationally traded raw materials include oil, gold, iron, zinc, nickel, timber, diamonds and natural gas. With great emphasis on mining, it is hardly surprising that the value of Australia’s exports is greatly affected by trends in commodity prices. Indeed, the A$ is often referred to as a commodity-driven currency. FIGURE 2.24 Iron ore mines and offshore oil and gas platforms extract the raw materials and energy that form part of the non-rural commodity markets. UNCORRECTED PAGE PROOFS
Structure for your case study research into a selected mineral or energy commodity market You might like to use the following section headings to guide your research into a selected mineral commodity market. In addition, a more detailed template for headings and ideas is provided later in section 2.10.3, Practice school-assessed coursework. • Introduction: What are the general features of your selected mineral commodity market? What type of market structure applies in this market or industry? How have market prices changed over recent years? • Demand: Who are the demanders, buyers or consumers of your selected mineral commodity and what factors affect their decisions? How have non-price demand conditions changed recently? Try to illustrate these hypothetically, using a D–S diagram showing the before and after effects on market demand, and the equilibrium price and quantity. • Supply: Who are the suppliers or sellers of your selected mineral commodity and what affects their decisions? How have non-price supply conditions changed recently? Try to illustrate these hypothetically, using a D–S diagram showing the before and after effects on market supply, and the equilibrium price and quantity. • What are the likely effects of changes in the relative market price of your selected mineral commodity on the economic decisions and the answers to the three basic economic questions? By way of example, figure 2.25 contains two graphs that show recent price changes in markets for a selection of mineral and energy commodities over the years to 2022. They include mineral commodities such as bulk minerals (used for manufacturing metal products, expressed in US$ per tonne) and Brent oil (liquid petroleum that comes out of the ground before being refined, commonly used to fuel cars and aeroplanes and the like, usually expressed in US$ per barrel).
FIGURE 2.25 Price changes for a selection of mineral commodities US$/t Iron ore (LHS) 200 150 100 50 Graph 1 — Changes in bulk mineral commodity prices (US$ per tonne) Thermal coal Coking coal (LHS) (RHS) Average Australian export price Spot price* 2015 * Iron ore 62% Fe fines index; Newcastle thermal coal and premium hard coking coal. 2022 2015 2022 2015 2022
0 100 200 300 400 US$/t Source: RBA Chart Pack, see https://www.rba.gov.au/chart‐pack/commodity‐prices.html. 0 UNCORRECTED PAGE PROOFS
US$/b Graph 2 — Changes in global oil prices (US$ per barrel) Oil and LNG prices Monthly
US$/ MMBtu
Brent oil (LHS) Japan and Korea LNG spot (RHS)
150 30 100 50 2012 2014 2016 2018 2020 2022

20 10 0 Source: RBA Chart Pack, see https://www.rba.gov.au/chart‐pack/commodity‐prices.html. Resourceseses Resources Weblinks Energy Information Administration InfoMine.com International Energy Agency OPEC RBA Chart Pack — mineral commodities World Gold Council YQ Matrix graphs CASE STUDY 3: COMMUNITY MARKETS Nature Community markets involve the selling (S) and buying (D) of edible products (e.g. cheeses, breads, cakes, vegetables, chutneys, jams and sweets) and home crafts (e.g. jewellery, leather goods, pottery, art, plants, clothing), along with plants, antiques and collectables. These markets typically occur in suburbs like Fitzroy or Kingsbury Drive in Melbourne, in cities like Geelong and Ballarat, and in small towns like Torquay. Sometimes they run infrequently like once a month, or perhaps every week. Usually sellers produce on a small scale and their products are often unique. This can make them an attraction for buyers and, as is usually the case, prices reflect conditions of demand and supply. Your case study of a community market might involve research and even an excursion to one of these markets. Here you may have an opportunity to chat with sellers and buyers. To find out what markets are running, follow 0 UNCORRECTED PAGE PROOFS the White Hat Guide to Sunday Markets weblink in the Resources tab.
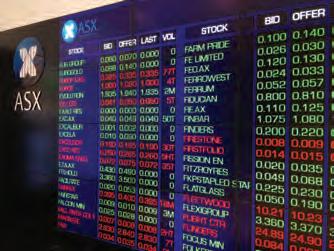
Structure for your case study research into a selected community market You might like to use the following section headings to guide your research into a selected community market. In addition, a more detailed template for headings and ideas is provided later in section 2.10.3, Practice school-assessed coursework. • Introduction: What are the general features of your selected community market? What type of market structure applies in this area? How have market prices changed over recent years? • Demand: Who are the demanders, buyers or consumers of the selected goods and services in your community market, and what factors affect their decisions? How have non-price demand conditions changed recently? Try to illustrate their effects hypothetically, using a D–S diagram showing the before and after effects on market demand, and the equilibrium price and quantity. • Supply: Who are the suppliers or sellers of the selected goods and services in your community market, and what affects their decisions? How have non-price supply conditions changed recently? Try to illustrate these hypothetically, using a D–S diagram showing the before and after effects on market supply, and the equilibrium price and quantity. • Effects: What are the likely effects of changes in the relative market price paid for the selected goods and services in your community market on the economic decisions and the answers to the three basic economic questions? Resourceseses Resources Weblink White Hat Guide to Sunday Markets CASE STUDY 4: THE STOCK MARKET Nature FIGURE 2.26 Prices of shares in the stock market are nowadays displayed electronically, and can change unexpectedly up or down due to changes in the conditions of demand for and/or supply of shares. In turn, price changes affect the economic decisions of investors and the allocation of resources. The stock market allows shares (a part ownership of a business) in companies listed on the stock exchange to be bought (D) and sold (S) at a price that reflects relative scarcity and the ever-changing non-price conditions of demand and supply for each stock. Often, speculative buyers will try to purchase shares at a low price and then resell them at a higher price later, in the hope of making a profit or capital gain. Sometimes shares are simply seen as an income-earning investment where shareholders receive dividends or a proportion of the profits made by the company. When companies are floated or first listed on the stock exchange (in Australia called the Australian Securities Exchange or ASX), they issue or sell shares to raise finance for their business expansion. However, later these shares change hands, depending on whether the original buyers want to keep them or sell them. On occasion, volatile changes in the conditions of demand and supply by investors can cause share prices to change dramatically. Structure for the case study research into the stock market You might like to use the following section headings to guide your research into the stock market. In addition, a more detailed template for headings and ideas is provided later in section 2.10.3, Practice school-assessed coursework. • Introduction: What are the general features of the stock market or Australian Securities Exchange (ASX)? UNCORRECTED PAGE PROOFS What is the type of market structure applies in the ASX or stock market? How have share market prices changed over recent years? • Demand: Who are the demanders or buyers of company stock, shares and equities listed on the ASX, and what factors affect their decisions (either focus on one listed company or cover shares in general)? Try to
illustrate hypothetically the recent effect of these factors, using a D–S diagram to show the before and after situations on market demand, and the equilibrium price and quantity. • Supply: Who are the suppliers or sellers of company stock, shares and equities listed on the ASX, and what factors affect their decisions (either focus on one listed company or cover shares in general)? Try to illustrate hypothetically the recent effect of these factors, using a D–S diagram to show the before and after situations on market supply, and the equilibrium price and quantity. • Effects: What are the likely effects of changes in share prices (perhaps for different company shares or relative to the attractiveness of other investments like housing, both here and overseas) on the economic decisions and the answers to the three basic economic questions? By way of example, figure 2.27 contains three graphs. One graph shows how the share price has changed for major Australian companies, along with global share prices. Notice how the ASX 200 share price index peaked around 2015 and 2020. The third graph shows general trends in prices of international shares. Here, share prices peaked in early 2022 and 2021. Notice that the COVID-19 global pandemic and ensuing slowdown inflicted much pain on investors.
FIGURE 2.27 Graphs showing changes in Australian and international share prices 4000 2014 2016 2018 2020 2022
4500 5000 5500 6000 6500 ASX index of share prices Graph 1 — Changes in Australian share prices for the biggest 200 companies (S&P/ASX 200, price index) 7000 7500 8000 7139.0 Source: Trading Economics, see https://tradingeconomics.com/australia/stockmarket. 30 40 50 60 Price per share (A$) Graph 2 — Changes in the price of BHP shares — Australia’s biggest mining company (A$ per share) 80 70 UNCORRECTED PAGE PROOFS
20
2014 2016 2018 2020 2022
Source: Macrotrends, see https://www.macrotrends.net/stocks/charts/BHP/bhpgroup/stock-pricehistory.
Graph 3 — Changes in the price of international shares, advanced economies (price index, base = 100 points December 1994) Advanced economies’ share price indices Log scale, end December 1994 = 100
Index Index
800 600 800 600
40 1997 Euro area UK Japan

US 2002 2007 2012 2017 2022 100 200 400 40 100 200 400 Source: RBA Chart Pack, see https://www.rba.gov.au/chart-pack/sharemarkets.html. Resourceseses Resources Weblinks RBA Chart Pack — share prices ASX home page ASX School’s Share Market Game Department of Agriculture, Fisheries and Forestry National Council of Wool Selling Brokers of Australia AUSTRADE Food and Agriculture Organization of the United Nations CASE STUDY 5: THE FINANCE MARKET Nature The finance market involves financial institutions (e.g. banks, credit unions, superannuation funds). Here, borrowers (demanders, D) and lenders (suppliers, S) of credit negotiate the rate of interest — the price or annual cost of credit that is paid. Interest rates largely reflect the relative scarcity of credit and the conditions of demand and supply, even though the Reserve Bank of Australia (RBA) uses special policy measures to influence rates or the price of credit. Households, businesses and governments often need to borrow (demand) money to finance their purchases of goods and services, including capital equipment, property and consumer goods. However, savers of money, including some households who do not spend all their current income, lend money to financial institutions and are rewarded by receiving interest. Structure for the case study research into the finance market You might like to use the following section headings to guide your research into the finance market. In addition, a more detailed template for headings and ideas is provided later in section 2.10.3, Practice school-assessed coursework. UNCORRECTED PAGE PROOFS • Introduction: What are the general features of the finance market? What type of market structure applies in the finance market? How have interest rates or market prices changed over recent years? • Demand: Who are the demanders or borrowers of finance, and what affects their decisions? How have demand conditions changed recently? Try to illustrate these hypothetically, using a D–S diagram showing the before and after effects on market demand, and the equilibrium price and quantity.
• Supply: Who are the suppliers, sellers or lenders of finance, and what affects their decisions? How have supply conditions changed recently? Try to illustrate these hypothetically, using a D–S diagram showing the before and after effects on market supply, and the equilibrium price and quantity. • What are the likely effects of changes in interest rates on the finance market, and on the economic decisions and the answers to the three basic economic questions?
FIGURE 2.28 Changes in selected interest rates in Australia’s financial market
6 5 4 3 2
2017 2021 2017 2021 * Weighted average interest rate across all fixed-rate periods. ** Major banks’ standard reference rates for variable-rate loans. *** Series break in July 2019; thereafter, data based on EFS collection.
Variable-rate loans Graph 1 – Changes in fixed and variable interest rates on home loans or mortgages Reference rates** Outstanding loans*** New loans*** Fixed-rate loans* % 2 3 4 5 6 % Source: RBA Chart pack, see https://www.rba.gov.au/chartpack/interest‐rates.html. 0 2019 2022 2019 2022 2019 2022 Secured by residential property* Fixed-rate * Small business loans secured by residential property can have fixed or variable interest rate terms and are included in the fixed-rate and variable-rate lines. Variable-rate 4 6 % 0 2 4 6 % Small business Medium business Large business Average interest rate on credit outstanding Graph 2 – Changes in interest rates on loans to different-sized businesses Source: RBA Chart pack, see https://www.rba.gov.au/chartpack/business‐sector.html. By way of example, figure 2.28 contains two graphs showing recent changes in Australian interest rates or the price of credit. Notice that home loan and business interest rates have come down to historic lows over recent 2 UNCORRECTED PAGE PROOFS years. You might like to start your research into the finance market by following the weblinks in the Resources tab.
Resourceseses
Weblinks RBA Chart Pack — interest rates Trading Economics — interest rates
CASE STUDY 6: THE FOREIGN EXCHANGE MARKET
Nature International financial transactions involve exports and imports of goods and services, and investment flows between countries. During this process, payments between countries must be made in the currency appropriate for each nation. For instance, Australian exporters generally want to be paid in our currency, not yen or pounds sterling. For this to occur, international currencies (e.g. the A$, US$, pound sterling, euro, rupee and yen) need to be swapped in the FOREX or foreign exchange market. The exchange rate is simply the price of one currency in terms of units of another (e.g. A$1 may be worth US$0.70). As occurs in all competitive markets, the price (in this case the exchange rate) is determined by the number of buyers (D) versus the number of sellers (S). The exchange rate changes with the level of relative scarcity of each currency. In Australia’s case, sellers of our currency are often local households or firms wanting to convert our dollar into some other currency to make payments abroad. These actions would increase the supply (S) of the A$, causing the exchange rate to depreciate (fall). Sometimes, too, speculators want to sell off the currency, especially if they feel it is soon going to fall. However, buyers of our currency are mostly foreigners wanting to pay someone in Australia, or currency speculators who purchase the A$ thinking it will rise sometime in the future enabling them to make gains. This action would tend to increase the demand (D) for the A$, causing the exchange rate to appreciate (rise). Structure for the case study research into the foreign exchange market You might like to use the following section headings to guide your research into the foreign exchange market. In addition, a more detailed template for headings and ideas is provided later in section 2.10.3, Practice school-assessed coursework. • Introduction: What are the general features of the foreign exchange market for the A$? What type of market structure applies in the foreign exchange market? How has the exchange rate for the A$ or market price changed over recent years? • Demand: Who are the demanders or buyers of foreign exchange and the A$, and what factors affect their decisions? How have demand conditions for the A$ changed recently? Try to illustrate their impact hypothetically, using a D–S diagram showing the before and after effects on market demand, and the equilibrium price and quantity of the A$. • Supply: Who are the suppliers or sellers of foreign exchange and the A$, and what factors affect their decisions? How have supply conditions for the A$ changed recently? Try to illustrate their impact hypothetically, using a D–S diagram showing the before and after effects on market supply, and the equilibrium price and quantity of the A$. • What are the likely effects of changes in the exchange rate for the A$ on the economic decisions and the answers to the three basic economic questions? By way of example, figure 2.29 contains one graph. It shows the value of the Australian dollar against the US dollar over the past fifty years. Notice that the price or value of the A$ has fallen considerably overall, despite some occasional rises in the shorter term.UNCORRECTED PAGE PROOFS

FIGURE 2.29 Changes in the exchange rate or price of one A$ and the US$ over the last fifty years
Source: Trading Economics, see https://tradingeconomics.com/australia/currency. Resourceseses Resources Weblinks RBA Chart Pack — exchange rates Trading Economics — indicators Westpac exchange rate converter CASE STUDY 7: THE PROPERTY AND HOUSING MARKETS (LOCAL OR OVERSEAS) Nature Residential properties and businesses in Australia are regularly bought (D) and sold (S) in the property market. A related market is that for rental properties, where tenants and landlords negotiate the price or cost of rent. Often these markets operate at the local level, but increasingly in capital cities the property market involves national and international customers. Due to changes in a range of non-price conditions of demand and supply, the period between 1995 to mid-2018 saw a remarkable overall growth in rental costs and housing and land prices. This was fuelled by very rapid population growth from natural increase, especially immigration; record low interest rates; and a buying frenzy by speculators, particularly in Sydney and Melbourne. More recently during late 2018 and early 2019, the peak in prices was followed by a downward market correction, before a strong rise to late 2021. Structure for the case study research into property markets You might like to use the following section headings to guide your research into the property market. In addition, a more detailed template for headings and ideas is provided later in section 2.10.3, Practice school-assessed UNCORRECTED PAGE PROOFS coursework. • Introduction: What are the general features of local and/or national property markets? What type of market structure applies in the property market? How have market prices changed over recent years?

• Demand: Who are the demanders, buyers, consumers or renters of property, and what factors affect their decisions? How have demand conditions for property changed recently? Try to illustrate their impact hypothetically, using a D–S diagram showing the before and after effects on market demand, and the equilibrium price and quantity of property. • Supply: Who are the suppliers or sellers of property, and what factors affect their decisions? How have supply conditions for property changed recently? Try to illustrate their impact hypothetically, using a D–S diagram showing the before and after effects on market supply, and the equilibrium price and quantity of property. • Effects: What are the likely effects of changes in the market prices of property (paid by buyers and/or renters) on the economic decisions and the answers to the three basic economic questions? By way of example, figure 2.30 contains two graphs. The trends in median property prices (measured by an index with a base year price of 100 points for comparison) across selected Australian capital cities are shown in graph 1. Changes in property prices in Hong Kong are shown in graph 2. Again, price changes reflect the level of relative scarcity of properties, and this is determined by the conditions of demand (D) relative to supply (S).
FIGURE 2.30 Changes in residential property prices in Australian capital cities and in Hong Kong 100 75
Sep-11 2011–12 = 100.0
Graph 1 — Change in Australian residential property prices index by capital city (quarterly, base year is 2011–12 = 100 points) Residential property price indexes, capital cities Index Number 125 150 175
225 200
Dec-11Mar-12Jun-12Sep-12Dec-12Mar-13Jun-13Sep-13Dec-13Mar-14Jun-14Sep-14Dec-14Mar-15Jun-15Sep-15Dec-15Mar-16Jun-16Sep-16Dec-16Mar-17Jun-17Sep-17Dec-17Mar-18Jun-18Sep-18Dec-18Mar-19Jun-19Sep-19Dec-19Mar-20Jun-20Sep-20Dec-20Mar-21Jun-21Sep-21 Sydney Brisbane Perth Darwin
Melbourne Adelaide Hobart Canberra Weighted average of eight capital cities Source: ABS, Residential property prices, https://www.abs.gov.au/statistics/economy/price-indexes-and-inflation/residentialproperty-priceindexes-eight-capital-cities/latest-release. UNCORRECTED PAGE PROOFS
186 Graph 2 – Index of property prices in Hong Kong
185.48 185.16
185.62
184
182 183.15 183.58
182.58
181.62
178 177.49 176

179.33 179.47180 Dec 2021Nov 2021Oct 2021Sep 2021Aug 2021Jul 2021Jun 2021May 2021Apr 2021Mar 2021Feb 2021 Source: Trading Economics, see https://tradingeconomics.com/hongkong/housing‐index. You might like to start your research into the property market by following the weblinks in the Resources tab. Resourceseses Resources Weblinks RBA Chart Pack — household sector Real Estate Institute of Victoria (REIV) CASE STUDY 8: THE LABOUR MARKET Nature Australia’s labour market is an institution where labour resources (the physical power and mental talents of different types of workers) are bought and sold at various prices or wages that reflect the relative scarcity of each type of worker. The sellers or suppliers of labour (S) come from the household sector and consist of over 13 million Australians aged 15 years and over who are able and willing to work (classified as members of the labour force). The buyers or demanders of labour (D) are firms wanting staff to fill their job positions. Structure for the case study research about the labour market You might like to use the following section headings to guide your research into the labour market. In addition, a more detailed template for headings and ideas is provided later in section 2.10.3, Practice school-assessed coursework. • Introduction: What are the general features of Australia’s labour market? What type of market structure applies in the labour market? How have market prices changed over recent years? • Demand: Who are the demanders or buyers of labour and what factors affect their decisions? How have demand conditions changed recently? Try to illustrate these hypothetically, using a D–S diagram showing the before and after effects on market demand, and the equilibrium price (wage) and quantity. • Supply: Who are the suppliers or sellers of labour and what factors affect their decisions? How have supply conditions changed recently? Try to illustrate these hypothetically, using a D–S diagram showing the before and after effects on market supply, and the equilibrium price and quantity. UNCORRECTED PAGE PROOFS • Effects: What are the likely effects of changes in labour prices or costs on the economic decisions and the answers to the three basic economic questions?
By way of example, figure 2.31 uses two graphs to show how average and minimum weekly wages (as the price of labour) in Australia have changed in recent years. In addition, Australian Bureau of Statistics (ABS) data is available for wages in different states, occupations, genders and educational attainment.
FIGURE 2.31 Changes in wages in Australia’s labour market
Graph 1 — Changes in average wages in Australian manufacturing
1500
1450
1400
1350
1300
1282.7 1250
Jan 2016 Jan 2018 Jan 2020 Jan 2022
1295.1 1309.4 1304.5 1340.3 1338.3 1350.6 1381.3 1458 1432.8 1462
1254.1 Source: Trading Economics, see https://tradingeconomics.com/australia/wages‐inmanufacturing. Graph 2 — Annual changes in Australia’s minimum wage set by the fair work commission 600 550 543.78 522.12 500 2007 2010 2013 2016 2019 2022
543.78 569.9 589.3 606.4 622.2 640.9 672.7
656.9 694.9 719.2 740.8
772.6 753.8 650 700 750 800 Source: Trading Economics, see https://tradingeconomics.com/australia/minimumwages. You might like to start your research into the labour market by following the weblinks in the Resources tab. UNCORRECTED PAGE PROOFS
Resourceseses
Weblinks Australian Bureau of Statistics The minimum wage
Australian Council of Trade Unions (ACTU) Australian Council of Trade Unions (ACTU schools site) Centrelink
Fair Work Commission Foreign exchange (FOREX) Wall Street warriors
Peak oil and possible outcome Commodities general introduction
Commodities crash explained in 90 seconds Speculation and manipulation of food and commodities How the stock market works Oil prices: What’s going on?
Commodities supercycle’s end is nigh
Why 2016 could be a turning point in the energy revolution How the stock exchange works $20 oil could be a reality if this happens CASE STUDY 9: CRYPTOCURRENCY MARKETS Nature Cryptocurrencies like Bitcoin, Ethereum, Binance Coin, Solana and thousands more, are mostly used as a speculative investment, often by those who are relatively well-off. Of these, the best known one is Bitcoin that accounts for over 40 per cent of all currency (estimated to be worth over $3 trillion). Some also use cryptocurrencies as a store of value, a medium of exchange, for transferring large sums of money internationally, and (for a few) as a way of laundering dirty money. Essentially, cryptocurrency only exists virtually or digitally. This means that there are no physical coins or notes involved. It is not issued or controlled by central banks, and a decentralised system is used to record transactions on a public ledger (Blockchain), and perhaps issue new units. It uses cryptography to secure these transactions. Each currency has its own market where the forces of demand relative to supply determine its value or price. As in all free markets, if demand for a cryptocurrency rises relative to its supply, then the price will rise; whereas if demand falls relative to supply, the price falls. As an investment, it is possible to make profits from price variations (in a way like share trading) — buy cheap and sell dear! Of course, buying and selling at the right time is key for success, but the volatility and unpredictability of these markets (sometimes,for example, due to unfolding events in the news and on social media), mean that profits are certainly not guaranteed. Structure for the case study research about cryptocurrency markets You might like to use the following section headings to guide your research into the cryptocurrency market. In addition, a more detailed template for headings and ideas is provided later in section 2.10.3, Practice school-assessed coursework. • Introduction: What are the general features of cryptocurrency markets? What type of market structure applies in the cryptocurrency market? How have market prices changed over recent years? • Demand: Who are the demanders or buyers of cryptocurrency and what factors affect their decisions? How have demand conditions changed recently? Try to illustrate these hypothetically, using a D–S diagram showing the before and after effects on market demand, and the equilibrium price and quantity traded. • Supply: Who are the suppliers or sellers of cryptocurrency and what factors affect their decisions? How have UNCORRECTED PAGE PROOFS supply conditions changed recently? Try to illustrate these hypothetically, using a D–S diagram showing the before and after effects on market supply, and the equilibrium price and quantity. • Effects: What are the likely effects of changes in cryptocurrency on the economic decisions?


