“c02DecisionMakingInMarkets_PrintPDF” — 2022/5/25 — 13:13 — page 84 — #18
2.5.1 The law of supply — how changes in price cause a movement along the supply curve
O
FS
The law of supply simply states that the quantity of a particular good or service that sellers are prepared to supply varies directly (in the same direction) with the change in price, assuming other factors do not change. Hence: • As the price increases, there is an expansion in the quantity supplied, causing a movement upwards along the supply line. • As the price decreases, there is a contraction in the quantity supplied, causing a movement downwards along the supply line.
PR
O
It is hardly surprising that businesses or suppliers behave like this when the quantity supplied contracts or expands along the line following a decrease or an increase in price. This is called a movement along the supply line and occurs because it becomes less profitable for producers to sell their product or service at a lower price, rather than selling it at a higher price.
E
So what would a supply line (representing how sellers respond to price) look like if plotted on a graph where price is located on the vertical axis and quantity on the horizontal axis?
PA
G
Again, imagine there was a competitive market for bananas. Using hypothetical data from the table, figure 2.11 graphically illustrates the relationship that exists between the quantity of bananas supplied and the price, remembering that we have assumed that all non-price factors that might also influence supply are held constant.
1
$2
2
$3
3
$4
4
$5
5
5
CO RR EC
$1
TE
S1 = Original quantity of bananas supplied each year (’000 kg)
Price per kg ($)
Price per kg of bananas
D
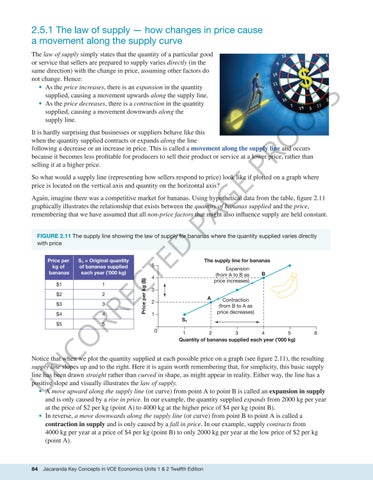
FIGURE 2.11 The supply line showing the law of supply for bananas where the quantity supplied varies directly with price The supply line for bananas Expansion (from A to B as price increases)
4
B
3 A
2 1
Contraction (from B to A as price decreases)
S1 0
3 4 5 1 2 Quantity of bananas supplied each year (’000 kg)
6
U
N
Notice that when we plot the quantity supplied at each possible price on a graph (see figure 2.11), the resulting supply line slopes up and to the right. Here it is again worth remembering that, for simplicity, this basic supply line has been drawn straight rather than curved in shape, as might appear in reality. Either way, the line has a positive slope and visually illustrates the law of supply. • A move upward along the supply line (or curve) from point A to point B is called an expansion in supply and is only caused by a rise in price. In our example, the quantity supplied expands from 2000 kg per year at the price of $2 per kg (point A) to 4000 kg at the higher price of $4 per kg (point B). • In reverse, a move downwards along the supply line (or curve) from point B to point A is called a contraction in supply and is only caused by a fall in price. In our example, supply contracts from 4000 kg per year at a price of $4 per kg (point B) to only 2000 kg per year at the low price of $2 per kg (point A).
84
Jacaranda Key Concepts in VCE Economics Units 1 & 2 Twelfth Edition


