“c07TheDistributionOfIncomeAndWealth_PrintPDF” — 2022/6/2 — 15:01 — page 20 — #20
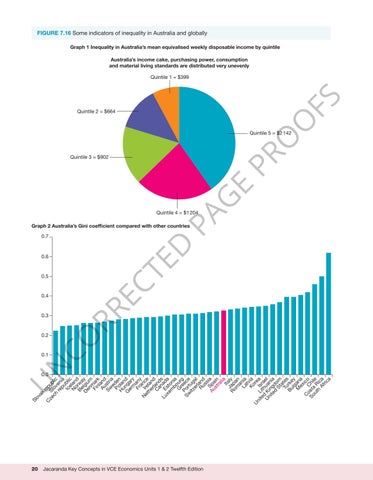
FIGURE 7.16 Some indicators of inequality in Australia and globally Graph 1 Inequality in Australia’s mean equivalised weekly disposable income by quintile Australia’s income cake, purchasing power, consumption and material living standards are distributed very unevenly
FS
Quintile 1 = $399
O
Quintile 2 = $664
PR
O
Quintile 5 = $2 142
G
E
Quintile 3 = $902
PA
Quintile 4 = $1 204 Graph 2 Australia’s Gini coefficient compared with other countries
CO RR EC
0.5
TE
0.6
D
0.7
0.4
0.3
0.2
N
0.1
U
Sl ov ak re C ze S pub ch lov lic re en pu ia Ic bli e c N lan or d Be wa De lgiu y nm m Fi ar nl k Au and Sw str e ia Po den H la u n G nga d er r m y Fr any a N Ir nc et el e he an r d C land an s Lu E ad xe sto a m n b ia G our re g SwPor ece itz tug er al l Ru and ss i Au Spa a st in ra lia It Ja aly Ro p m an a La nia t Ko via r U ni L Is ea te it ra d hu e U K a l ni in ni te gd a d o St m a Tu tes Bu rke lg y M ari ex a ic C os C o So ta hi ut R le h ic Af a ric a
0.0
20
Jacaranda Key Concepts in VCE Economics Units 1 & 2 Twelfth Edition


