Jacaranda Key Concepts In VCE Economics 1 Units 1 & 2

Page 223

“c04EconomicActivity_PrintPDF” — 2022/5/28 — 13:00 — page 23 — #23

4.7 The relationship between the business cycle and economic indicators KEY KNOWLEDGE • the relationship between the business cycle and economic indicators

FS

Source: VCE Economics Study Design (2023–2027) extracts © VCAA; reproduced by permission.

O

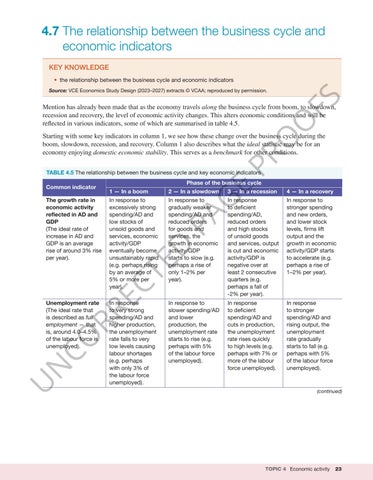
Mention has already been made that as the economy travels along the business cycle from boom, to slowdown, recession and recovery, the level of economic activity changes. This alters economic conditions and will be reflected in various indicators, some of which are summarised in table 4.5.

PR

O

Starting with some key indicators in column 1, we see how these change over the business cycle during the boom, slowdown, recession, and recovery. Column 1 also describes what the ideal statistic may be for an economy enjoying domestic economic stability. This serves as a benchmark for other conditions. TABLE 4.5 The relationship between the business cycle and key economic indicators

U

N

Unemployment rate (The ideal rate that is described as full employment — that is, around 4.0–4.5% of the labour force is unemployed).

E

3 — In a recession

In response to excessively strong spending/AD and low stocks of unsold goods and services, economic activity/GDP eventually become unsustainably rapid (e.g. perhaps rising by an average of 5% or more per year).

In response to gradually weaker spending/AD and reduced orders for goods and services, the growth in economic activity/GDP starts to slow (e.g. perhaps a rise of only 1–2% per year).

In response to deficient spending/AD, reduced orders and high stocks of unsold goods and services, output is cut and economic activity/GDP is negative over at least 2 consecutive quarters (e.g. perhaps a fall of -2% per year).

In response to stronger spending and new orders, and lower stock levels, firms lift output and the growth in economic activity/GDP starts to accelerate (e.g. perhaps a rise of 1–2% per year).

In response to very strong spending/AD and higher production, the unemployment rate falls to very low levels causing labour shortages (e.g. perhaps with only 3% of the labour force unemployed).

In response to slower spending/AD and lower production, the unemployment rate starts to rise (e.g. perhaps with 5% of the labour force unemployed).

In response to deficient spending/AD and cuts in production, the unemployment rate rises quickly to high levels (e.g. perhaps with 7% or more of the labour force unemployed).

In response to stronger spending/AD and rising output, the unemployment rate gradually starts to fall (e.g. perhaps with 5% of the labour force unemployed).

D

PA

G

2 — In a slowdown

CO RR EC

The growth rate in economic activity reflected in AD and GDP (The ideal rate of increase in AD and GDP is an average rise of around 3% rise per year).

Phase of the business cycle 1 — In a boom

TE

Common indicator

4 — In a recovery

(continued)

TOPIC 4 Economic activity

23


Turn static files into dynamic content formats.

Create a flipbook

Articles inside

8.8 Review

41min
pages 499-518

8.7 The responses by economic agents to improve environmental sustainability

28min
pages 488-498

8.4 The reasons why environmental sustainability is of importance to Australia and globally

3min
pages 472-475

8.3 Measures of the environmental sustainability of economic activity

23min
pages 459-471

8.5 The economic factors influencing the extent of environmental sustainability

16min
pages 476-482

8.6 Different perspectives about the issue of environmental sustainability

8min
pages 483-487

8.2 Definition and general nature of environmental sustainability

2min
pages 456-458

8.1 Overview

2min
pages 454-455

7.8 Review

40min
pages 437-453

7.7 The Australian government’s response to address inequality in the distribution of income and wealth

25min
pages 428-436

7.5 Economic factors affecting income and wealth inequality in Australia

14min
pages 414-422

7.6 Different perspectives about the distribution of income and wealth

10min
pages 423-427

7.4 The reasons why the distribution of income and wealth is an important issue

11min
pages 408-413

7.3 Measures of Australia’s distribution of income and wealth

19min
pages 397-407

7.2 Definition, nature and direction of income and wealth

5min
pages 393-396

7.1 Overview

1min
page 392

6.8 Review

25min
pages 380-391

6.7 Economic responses and government policies involving international trade

33min
pages 364-379

6.6 Different perspectives about the issue of international trade

13min
pages 357-363

6.5 The economic factors influencing international trade

10min
pages 351-356

6.4 The benefits of international trade for Australia and the global economy

7min
pages 346-350

6.3 Measurement of Australia’s international transactions

3min
pages 343-345

6.2 Definition, nature and direction of international trade

2min
pages 340-342

6.1 Overview

3min
pages 338-339

5.8 Review

35min
pages 322-337

5.7 The Australian government’s economic responses to address changes in the labour market

17min
pages 314-321

5.6 Different perspectives about the changing labour market

5min
pages 312-313

5.3 Measures of Australia’s changing labour market

23min
pages 290-301

5.5 The economic factors influencing changes in Australia’s labour market

13min
pages 304-311

5.2 Definition and nature of the labour market

5min
pages 286-289

5.1 Overview

2min
pages 284-285

4.16 Review

40min
pages 267-283

standards

7min
pages 256-259

4.13 The potential costs of economic growth

14min
pages 248-255

4.12 The potential benefits of economic growth

10min
pages 242-247

4.10 Aggregate supply — its meaning, importance and factors affecting its level and economic activity

19min
pages 231-237

4.11 The measurement of economic growth using changes in Gross Domestic Product (GDP

8min
pages 238-241

4.8 BACKGROUND KNOWLEDGE: Overview of factors that may affect Australia’s level of economic activity

2min
pages 221-222

4.9 Aggregate demand — its meaning, importance and factors affecting its level and economic activity

18min
pages 223-230

4.6 Types of economic indicators

7min
pages 215-218

4.5 The business cycle

5min
pages 213-214

4.4 The five-sector circular flow model

11min
pages 206-212

4.3 The meaning of material and non-material living standards

5min
pages 203-205

3.5 Review

30min
pages 180-197

3.4 The effectiveness of strategies used by businesses to influence consumer behaviour

22min
pages 168-179

3.1 Overview

1min
page 148

3.3 The effectiveness of strategies used by government to influence consumer behaviour

20min
pages 159-167

2.10 Review

40min
pages 128-147

2.9 Researching a contemporary Australian or global market

37min
pages 108-127

2.8 How changes in relative prices and profits affect Australia’s resource allocation

11min
pages 102-107

equilibrium price and quantity

31min
pages 90-101

2.3 BACKGROUND KNOWLEDGE: How markets make key economic decisions — the big picture

7min
pages 79-81

2.4 The law of demand and movements along the demand curve

7min
pages 82-84

2.5 The law of supply and movements along the supply curve

6min
pages 85-87

2.2 The nature of perfectly competitive and other types of markets in an economy

19min
pages 71-78

2.1 Overview

1min
page 70

1.9 Review

46min
pages 51-69

1.5 Decision making in different economic systems

30min
pages 24-36

1.4 Making economic decisions

22min
pages 14-23

1.3 The basic economic problem of relative scarcity

9min
pages 10-13

1.8 Governments and their role as economic agents

15min
pages 45-50

1.6 Consumers and their behaviour as economic agents

11min
pages 37-41

1.1 Overview

1min
pages 4-5

1.7 Businesses and their behaviour as economic agents

4min
pages 42-44

1.2 What is economics?

4min
pages 6-9
Issuu converts static files into: digital portfolios, online yearbooks, online catalogs, digital photo albums and more. Sign up and create your flipbook.
Jacaranda Key Concepts In VCE Economics 1 Units 1 & 2 by jacarandaaus - Issuu