“c04EconomicActivity_PrintPDF” — 2022/5/28 — 13:00 — page 21 — #21
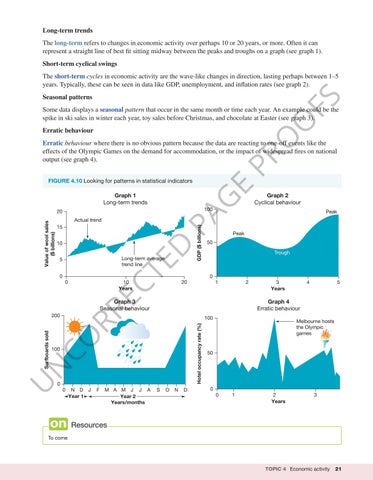
Long-term trends The long-term refers to changes in economic activity over perhaps 10 or 20 years, or more. Often it can represent a straight line of best fit sitting midway between the peaks and troughs on a graph (see graph 1). Short-term cyclical swings The short-term cycles in economic activity are the wave-like changes in direction, lasting perhaps between 1–5 years. Typically, these can be seen in data like GDP, unemployment, and inflation rates (see graph 2).
FS
Seasonal patterns
O
Some data displays a seasonal pattern that occur in the same month or time each year. An example could be the spike in ski sales in winter each year, toy sales before Christmas, and chocolate at Easter (see graph 3).
O
Erratic behaviour
PR
Erratic behaviour where there is no obvious pattern because the data are reacting to one-off events like the effects of the Olympic Games on the demand for accommodation, or the impact of widespread fires on national output (see graph 4).
G
Graph 1 Long-term trends
PA
15
D
10
Long-term average trend line
TE
5
0
CO RR EC
10 Years
GDP ($ billions)
Actual trend
0
Peak
Trough
0 20
1
2
Hotel occupancy rate (%)
N
Surfboards sold
100
100
0 N D J Year 1
F
M A M J J A Year 2 Years/months
3 Years
4
5
Graph 4 Erratic behaviour
200
0
Peak
50
Graph 3 Seasonal behaviour
U
Graph 2 Cyclical behaviour
100
20 Value of wool sales ($ billions)
E
FIGURE 4.10 Looking for patterns in statistical indicators
S
O
N
D
Melbourne hosts the Olympic games
50
0 0
1
2 Years
3
Resources
Resourceseses To come
TOPIC 4 Economic activity
21


