“c04EconomicActivity_PrintPDF” — 2022/5/28 — 13:00 — page 15 — #15
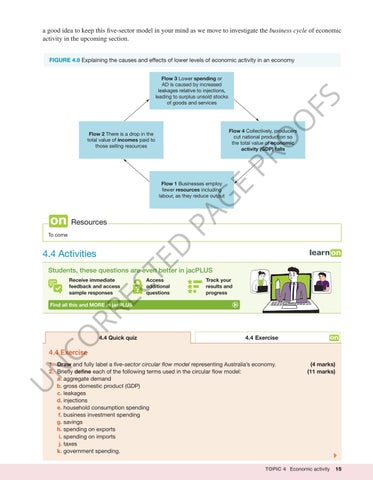
a good idea to keep this five-sector model in your mind as we move to investigate the business cycle of economic activity in the upcoming section. FIGURE 4.8 Explaining the causes and effects of lower levels of economic activity in an economy
O
FS
Flow 3 Lower spending or AD is caused by increased leakages relative to injections, leading to surplus unsold stocks of goods and services
Flow 4 Collectively, producers cut national production so the total value of economic activity (GDP) falls
PR
O
Flow 2 There is a drop in the total value of incomes paid to those selling resources
PA
G
E
Flow 1 Businesses employ fewer resources including labour, as they reduce output
Resources
Resourceseses
4.4 Activities
TE
D
To come
Students, these questions are even better in jacPLUS Access additional questions
CO RR EC
Receive immediate feedback and access sample responses
Track your results and progress
Find all this and MORE in jacPLUS
4.4 Quick quiz
4.4 Exercise
4.4 Exercise
(4 marks) (11 marks)
U
N
1. Draw and fully label a five-sector circular flow model representing Australia’s economy. 2. Briefly define each of the following terms used in the circular flow model: a. aggregate demand b. gross domestic product (GDP) c. leakages d. injections e. household consumption spending f. business investment spending g. savings h. spending on exports i. spending on imports j. taxes k. government spending.
TOPIC 4 Economic activity
15


