10 X October 2022 https://doi.org/10.22214/ijraset.2022.47067
ISSN: 2321 9653; IC Value: 45.98; SJ Impact Factor: 7.538
Volume 10 Issue X Oct 2022 Available at www.ijraset.com
ISSN: 2321 9653; IC Value: 45.98; SJ Impact Factor: 7.538
Volume 10 Issue X Oct 2022 Available at www.ijraset.com
2

1Post Graduate student, Environmental Engineering, Bapuji Institute of Engineering and Technology, Davangere, Karnataka, India

2Assistant Professor, Department of Civil Engineering,, Bapuji Institute of Engineering and Technology, Davangere, Karnataka, India
Abstract: Effluent that is released from distillery industries is known as spent wash which is the main reason for the damaging they caused on the natural ecosystem if there is no proper pre treatment performed. A proper study is to be performed to detail about the physicochemical property of the effluent such as color, odor, total dissolved solid (TDS), chemical oxygen demand (COD), pH, biochemical oxygen demand (BOD), electrical conductivity, dissolved oxygen which are considered as the important parameters which will indicate the level of pollution of the effluent from different industrial. The present study was conducted to investigate the physicochemical characteristic and organic constituents of one of the distillery effluent found in distillery factory in Duggavati near Harapanahalli (tq) Davanagere . In investigation done by us we observed that the sample is lower pH and highly acidic in nature, higher temperature, higher concentration of chemical oxygen demand (COD) and biochemical oxygen demand (BOD) have been recorded. Disposing of the spent wash is one of the most important and present environmental problems faced by the world. The purpose of the study was to conduct and evaluate the physio chemical characterization of spent wash effluent and analysis of PTDE and PTDE diluted with 50% and 75% of water.
Keywords: Distillery industry, BOD, COD, pH, Total solids, Suspended solids Primary Treated Distillery Effluent (PTDE), Dilution.
A significant quantity of waste water is known to be discharged to water bodies by industries like the paper, textile, dye, and distillery industries. The kind of raw materials utilized and the various treatment processes used before the release of treated effluent to the water bodies can affect the physiochemical properties of distillery wasted wash. Distillery wasted wash typically contains significant levels of organic chemicals, sulphates, and heavy metals as well as very high levels of biochemical oxygen demand (BOD) and chemical oxygen demand (COD). The raw spent wash is in intense brown colour, which has low pH that is acidic in nature, odour of spent was is unpleasant. The spent wash has high electrical conductivity (EC) and has high inorganic and organic salts. Treated distillery effluent is usually discharged into the water bodies which are nearly available. This effluent contains high amount of foreign substances which are heavy and toxic metals which affect the soil and water bodies which causes adverse effect on the aquatic lives. Distillery effluent is one of the major source in causing adverse environmental effects. It is also has rich source of nutrients such as nitrogen, potassium, magnesium, iron, zinc and calcium and some kind of biodegradable organic matter which play a major role in enriching the soil fertility. Hence distillery effluents are majorly used as fertilized irrigation purpose. Various experimental results have witnessed in showing the importance of distillery effluent which enhances the seed germination, growth of seeds, chlorophyll content and yield in the crop. Using of the treated distillery effluent for irrigation should be carried out in at most care. Because, distillery effluent has very high concentration of heavy metals which on inducing to the soil will result in different environmental impacts and adversely affects the health. Heavy metals usually affects the plant by germination of the seed, growth of the seedlings, availability of the nutrients and the activities of the enzymes. Heavy metallic concentration in plant may reach animals through the food chain which may cause various health issues for the animals. The physicochemical characteristics are considered in estimating the levels of toxic contents in treated distillery effluent. Parameters such as pH, EC, colour, turbidity, biochemical oxygen demand (BOD), chemical oxygen demand (COD), DO, nitrogen, phosphorus, organic constituents and metallic levels are the parameters which are mostly to be determined. The main objectives of the present study is to evaluate the physiochemical characteristics and organic constituents present in the sample and analysis of primary treated distillery effluent (PTDE) from of one the distillery factory from Duggavati Harapanahalli (tq).
ISSN: 2321 9653; IC Value: 45.98; SJ Impact Factor: 7.538
Volume 10 Issue X Oct 2022 Available at www.ijraset.com
The following are the objectives of the study:
1) To analyse the physicochemical properties of distillery spent wash.
2) To analyse the organic constituents in distillery spent wash.
3) To analyse the characteristics of primary treated distillery effluent (PTDE).
4) To analyse the characteristics of PTDE treated with 50% and 75% water.
1) Analysis of raw spent wash of a distillery factory.
2) Analysis of primary treated distillery effluent (PTDE).
3) Analysis of PTDE diluting with 50% and 75% of water.
Determination of pH was done by using the pH meter after all necessary calibrations all the samples were taken in 3 different clean glass bottles and named all of them and the pH was analyzed for all the samples.
Determination of electrical conductivity was done using an instrument called conductivity meter after all necessary calibration’s. The clean glass bottles were used for the purpose of analysis. Thus EC was determined.
The estimation of dissolved oxygen is done by Winkler’s Azide titrimetric method. Take a clean 300ml BOD for which 300 ml of sample is added, now add 2ml of manganese sulphate (MnSO4), add 2ml of alkali azide iodide and stoppered carefully to remove air bubbles and mixed thoroughly by shaking. If there is presence of oxygen the brownish precipitation is formed. If the oxygen is absent white precipitation is formed. To the brown ppt after it is allowed to settle for few mins add 2ml of concentrated sulfuric acid. By this a clear yellow suspension is formed. Add 203 ml of the sample to a conical flask a few freshly made starch solution droplets and the sample was titrated against 0.025N sodium thiosulphate (Na2S2O3). Titration was done till the blue color is disappeared. The Volume of Na2S2O3 used was noted for the determination of DO.
Estimation of chlorides is done by Mohr’s titrimetric method Spent wash sample of 0.1ml was taken and was diluted with 1000ml of RO water and now take 50ml from the diluted sample. Aluminum hydroxide is added to the sample and was mixed and the solution was allowed to settle. Now to the filtrate add 1ml potassium chromate indicator and titrated it against silver nitrate solution. Titrate till the end point is yellow colour. Repeat the procedure for Blank sample. And do the necessary calculations.
Biological Oxygen Demand estimation was done using BOD bottle and BOD was calculated for 3 Days. Spent wash sample of 0.1ml was taken and is diluted with 1000ml of RO water. The 300 ml of sample was filled till the neck in an air tight B.O.D bottle of 300 ml and incubated at 270 degree Celsius for three days in a B.O.D incubator by adding nutrient solutions such as magnesium sulphate solution(MgSo4), Calcium chloride solution (CaCl2), Ferric Chloride solution (FeCl3), Phosphate buffer solution. Dissolved oxygen measure is done initially. 3 days analysis is done for both blank and sample. Later BOD is calculations are done with the standard formulas.
Chemical oxygen demand estimation was done by “Open reflux method”. 0.1ml of sample is taken and 1000ml of RO water is added. Take 10 ml of sample in cod bottle before adding sample water to wash thoroughly using soap powder and make sure no soap residue is left and now wash it with distilled water and make sure it is clean and ready to add the sample. Now add 0.4mg of mercuric sulphate (HgSO4) and add 10ml of potassium dichromate and add 30ml concentrated sulfuric acid and add some glass beads so that it avoids bumping.
ISSN: 2321 9653; IC Value: 45.98; SJ Impact Factor: 7.538
Volume 10 Issue X Oct 2022 Available at www.ijraset.com
Switch on the apparatus and make sure that the water is flowing continuously reflux action should take for around 2 hours and after that it should be allowed for cooling for one hour. After cooling add 80ml of distilled water and add few drop of ferroin ion indicator. It should be titrated with 0.1N ferrous ammonium sulphate (FAS) until the colour turns blue green. Do the necessary calculations for blank and sample and get the COD values.
For this firstly turn on heating block, hot kit TNT 72 prepare series of vial blank, standard and others needed. Using a micro pipette add 5ml of deionized water to vial marked blank. Add 5 milli meter of standard solution to vial marked standard. Add 5 ml collected sample to vial marked sample, add 1ml potassium persulfate to each vial cap invert vial for two to three times to mix insert all the into the block digest for 30 minutes at 150 degree Celsius. When finished remove all vials from heating block using tongs cool the vials to touch. Take sodium hydroxide 2ml solution using micro pipette add to each vial. Now add 5ml of molybdenite invert two to three times to mix properly and wait for 7 minutes. Choose program on hoc spectrometer 3900 choose method 542 total phosphorous HR tnt press start place vial one by one and press read. Record the results.
Are determined by using Flame Photometer using analytical tool microprocessor flame photometer model LT671. LPG is connected the instrument. Then LPG is mixed with the aspirated solution and then the aspirated solution liquid vaporizes and the metallic ion is converted to gaseous state, then neutral state. Neutral ion will now dissociate and the presence of thermal energy it will excite to higher energy state and after coming to the lower energy state it will produce the photons and by using these photons it will give out the concentration in ppm.
Take the empty weight of the crucible (w1), add 25ml of sample to the crucible keep the crucible on the hot plate until the moisture content in the crucible is evaporated. Now weigh the crucible which contains residue (w2), the difference between w1 and w2 gives us the weight of residue. Weight of sample divided by volume of sample gives the result of total solids in mg/L.
Take the empty weight of the Wattman filter paper (w1), fold the filter paper in cone shape add 25ml of sample to the filter paper by holding it in a conical flask, keep the filter paper in the hot air oven until the moisture content in the filter paper is evaporated. Now weigh the filter paper which contains residue (w2), the difference between w1 and w2 gives us the weight of residue. Weight of sample divided by volume of sample gives the result of total solids in mg/L.
K. Total Dissolved Solids
Are calculated as the difference between total solids and total suspended solids.
Analysis was done for the raw spent wash which was collected from the distillery factory from Duggavati near Harapanahalli (tq). Various physio chemical analysis and instrumental analysis were performed for the required results.
Table 1: Analysis of distillery spent wash
SPENT WASH COLOUR DARK BROWN ODOUR UNPLEASANT pH 4.31 EC (mS/cm) 23.80
PARAMETERS
TOTAL SOLIDS (mg/L) 75048
TOTAL SUSPENDED SOLIDS (mg/L) 14016 TOTAL DISSOLVED SOLIDS (mg/L) 61032
ISSN: 2321 9653; IC Value: 45.98; SJ Impact Factor: 7.538 Volume 10 Issue X Oct 2022 Available at www.ijraset.com
TOTAL HARDNESS (mg/L) 2180.6
BIOLOGICAL OXYGEN DEMAND (mg/L) 18502.6
CHEMICAL OXYGEN DEMAND (mg/L) 34000
CALCIUM 2150.5
TOTAL PHOSPHORUS (ppm) 54.7 TOTAL POTASSIUM (ppm) 7850.15 DISSOLVED OXYGEN (mg/L) NIL
B. Analysis of Primary Treated Distillery Effluent (PTDE)
Analysis was done for the primary treated distillery effluent which was collected from the distillery factory from Duggavati near Harapanahalli (tq). Various physio chemical analysis and instrumental analysis were performed for the required results.
Table 2: Analysis of PTDE
PARAMETERS PTDE (Primary Treated Distillery Effluent) COLOUR REDDISH BROWN ODOUR OFFENSIVE
pH 7.3 EC (mS/cm) 19.54
TOTAL SOLIDS (mg/L) 61758
TOTAL SUSPENDED SOLIDS (mg/L) 10546
TOTAL DISSOLVED SOLIDS (mg/L) 51212 TOTAL HARDNESS (mg/L) 1850.5 BIOLOGICAL OXYGEN DEMAND (mg/L) 12589.58
CHEMICAL OXYGEN DEMAND (mg/L) 22897
CALCIUM 918
TOTAL PHOSPHORUS (ppm) 40.9
TOTAL POTASSIUM (ppm) 6018.9 DISSOLVED OXYGEN (mg/L) NIL
ISSN: 2321 9653; IC Value: 45.98; SJ Impact Factor: 7.538 Volume 10 Issue X Oct 2022 Available at www.ijraset.com
C. Analysis Of Primary Treated Distillery Effluent (Ptde) Diluted With 50% Water
Analysis was done for the primary treated distillery effluent diluted with 50% water which was collected from the distillery factory from Duggavati near Harapanahalli (tq).
Table 3: Analysis of PTDE Diluted with 50% water
PTDE Diluted with 50%water COLOUR BROWN ODOUR OFFENSIVE pH 7.7 EC (mS/cm) 14.87
PARAMETERS
TOTAL SOLIDS (mg/L) 32547
TOTAL SUSPENDED SOLIDS (mg/L) 6357
TOTAL DISSOLVED SOLIDS (mg/L) 26190
TOTAL HARDNESS (mg/L) 1289.6
BIOLOGICAL OXYGEN DEMAND (mg/L) 7689.8 CHEMICAL OXYGEN DEMAND(mg/L) 1256.57
CALCIUM 526
TOTAL PHOSPHORUS (ppm) 29.8
TOTAL POTASSIUM (ppm) 3458.3 DISSOLVED OXYGEN (mg/L) 3.4
D. Analysis Of Primary Treated Distillery Effluent (PTDE) Diluted With 75% Water Analysis was done for the primary treated distillery effluent diluted with 75% water which was collected from the distillery factory from Duggavati near Harapanahalli (tq). Various physio chemical analysis and instrumental analysis were performed for the required results.
Table 4: Analysis of PTDE Diluted with 75% water
PARAMETERS
PTDE Diluted with 75% water COLOUR LIGHT BROWN ODOUR OFFENSIVE pH 7.8 EC (mS/cm) 10.54
TOTAL SOLIDS (mg/L) 22487
TOTAL SUSPENDED SOLIDS (mg/L) 3130
TOTAL DISSOLVED SOLIDS (mg/L) 19357
TOTAL HARDNESS (mg/L) 857.6
BIOLOGICAL OXYGEN DEMAND (mg/L) 2358.2
CHEMICAL OXYGEN DEMAND (mg/L) 3586.5
CALCIUM 357
TOTAL PHOSPHORUS (ppm) 18.5
TOTAL POTASSIUM (ppm) 1569.4 DISSOLVED OXYGEN (mg/L) 4.2
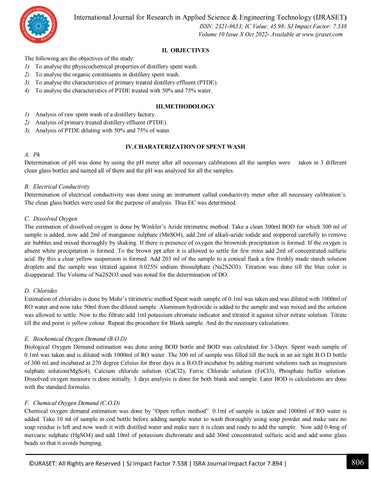
pH
ISSN: 2321 9653; IC Value: 45.98; SJ Impact Factor: 7.538 Volume 10 Issue X Oct 2022 Available at www.ijraset.com
25
10
5
7.3 7.7 7.8 pH
0
4.31
Spent Wash PTDE PTDE diluted with 50% water
PTDE diluted with 75% water
20
15
10
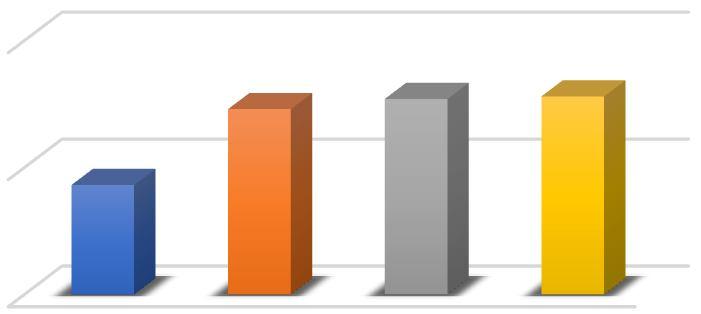
EC (mS/cm)
23.8 19.54 14.87 10.54 EC (mS/cm)
5
Spent Wash PTDE PTDE diluted with 50% water
Spent Wash PTDE PTDE diluted with 50% water PTDE diluted with 75% water 0
Chart 1: pH Chart 2: EC
Spent Wash PTDE
PTDE diluted with 50% water PTDE diluted with 75% water
PTDE diluted with 75% water
ISSN: 2321 9653; IC Value: 45.98; SJ Impact Factor: 7.538 Volume 10 Issue X Oct 2022 Available at www.ijraset.com
ISSN: 2321 9653; IC Value: 45.98; SJ Impact Factor: 7.538 Volume 10 Issue X Oct 2022 Available at www.ijraset.com
TDS
61032 51212 26190 4.5 TDS (mg/L)
0 10000 20000 30000 40000 50000 60000 70000 Spent Wash PTDE PTDE diluted with 50% water
PTDE diluted with 75% water
Chart 5: TDS

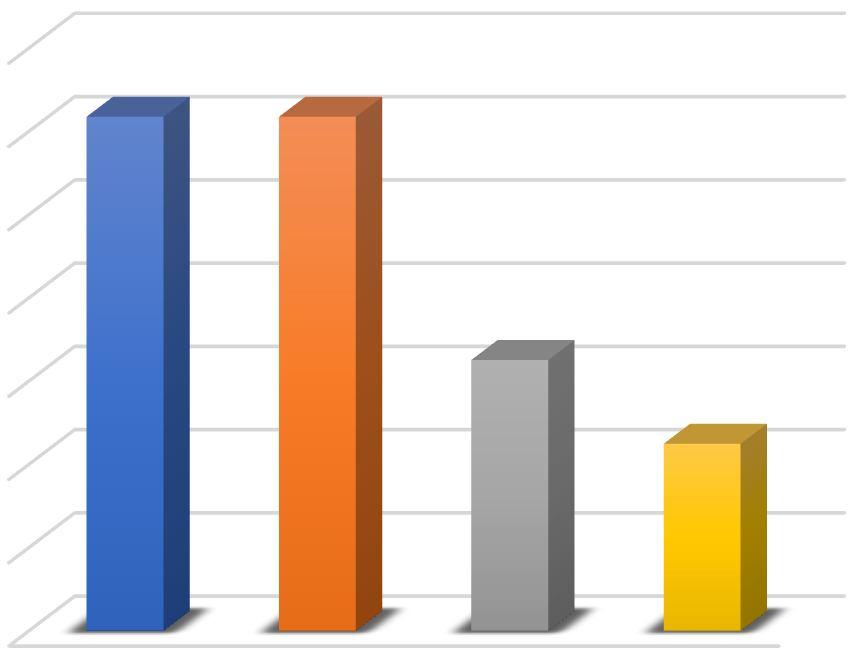
Total Hardness
2180.6 1850.5 1289.6 4.5 TH (mg/L)
0
5000 Spent Wash PTDE PTDE diluted with 50% water
PTDE diluted with 75% water
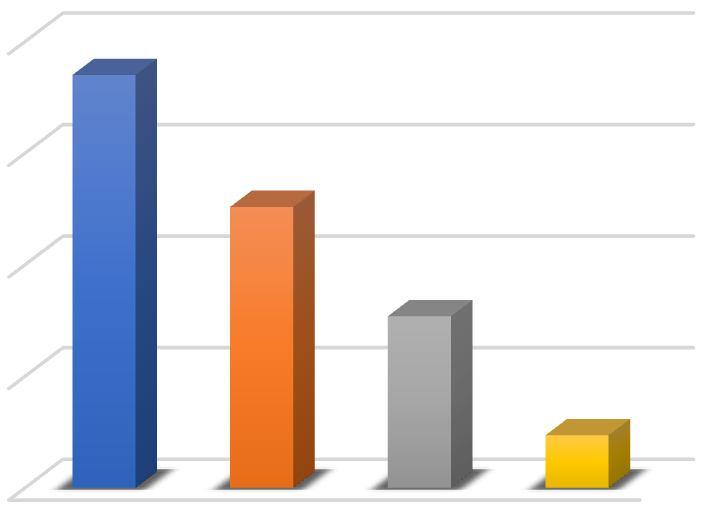
Chart 6: TOTAL HARDNESS
Spent Wash PTDE PTDE diluted with 50% water PTDE diluted with 75% water
18502.6 12589.58 7689.8 2358.2 BOD (mg/L)
15000
10000
Spent Wash PTDE PTDE diluted with 50% water PTDE diluted with 75% water 0
20000 Spent Wash PTDE PTDE diluted with 50% water
5000
BOD (mg/L) Spent Wash PTDE PTDE diluted with 50% water PTDE diluted with 75% water
PTDE diluted with 75% water
Chart 7: BOD
ISSN: 2321 9653; IC Value: 45.98; SJ Impact Factor: 7.538 Volume 10 Issue X Oct 2022 Available at www.ijraset.com
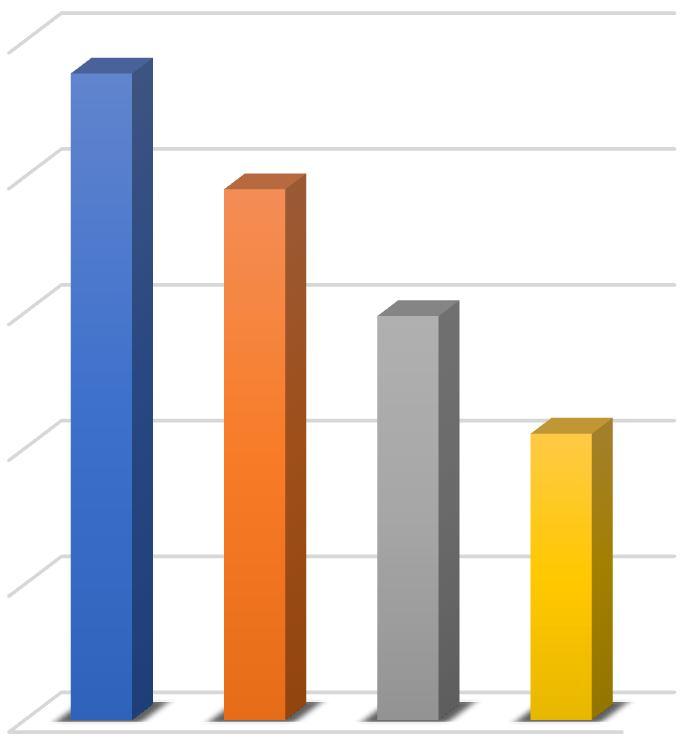
COD (mg/L)
Spent Wash
20000
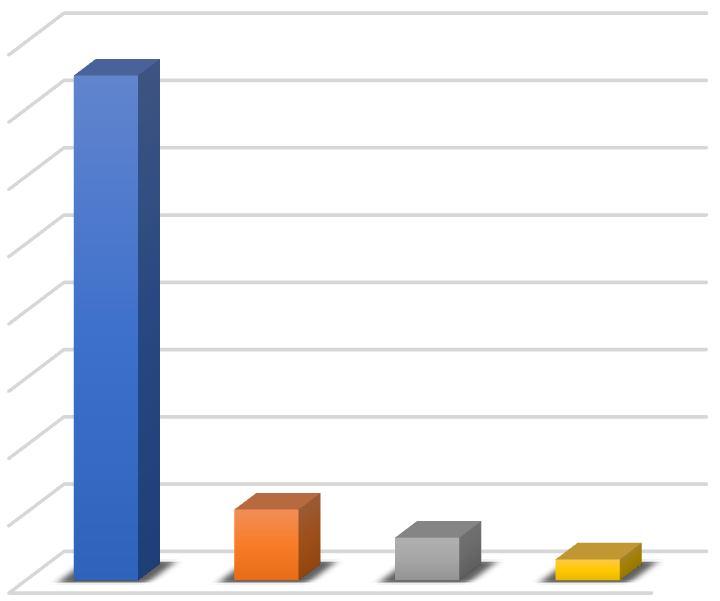
34000 22897 1256.57 4.5 COD (mg/L)
0
40000 Spent Wash PTDE PTDE diluted with 50% water
PTDE diluted with 75% water
PTDE
PTDE diluted with 50% water
2000
1500
1000
500
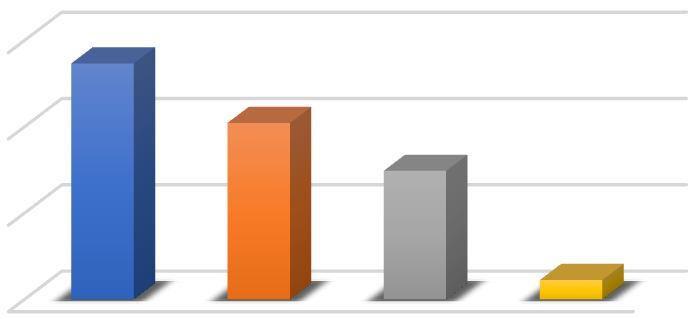
Chart 8: COD
2500 2150.5 918 526 357 calcium (mg/L)
Calcium (mg/L)
Spent Wash
PTDE
PTDE diluted with 50% water
PTDE diluted with 75% water
PTDE diluted with 75% water 0
Chart 9: CALCIUM
40
20
54.7 40.9 29.8 4.5 Total phosphorus (ppm)
60 Spent Wash PTDE PTDE diluted with 50% water
0
Total Phosphorus Spent Wash PTDE PTDE diluted with 50% water PTDE diluted with 75% water
PTDE diluted with 75% water
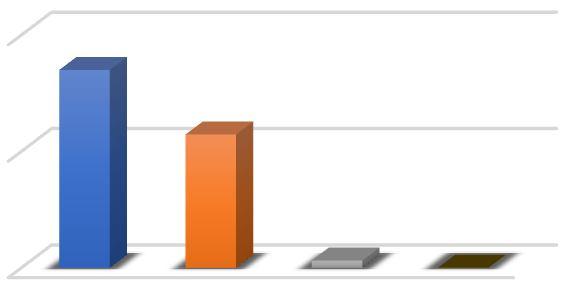
Chart 10: TOTAL PHOSPHORUS
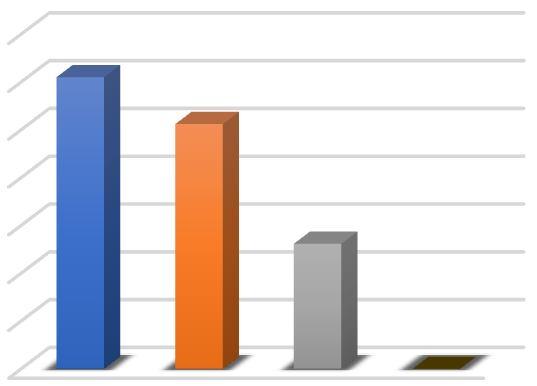
Total Potassium (ppm)
8000
6000
4000
2000
0
ISSN: 2321 9653; IC Value: 45.98; SJ Impact Factor: 7.538 Volume 10 Issue X Oct 2022 Available at www.ijraset.com
7850.15 6018.9 3458.3 4.5
Total Potassium Spent Wash PTDE PTDE diluted with 50% water
Spent Wash PTDE PTDE diluted with 50% water
PTDE diluted with 75% water
DO
4.2 DO
PTDE diluted with 75% water 0 0.5 1 1.5 2 2.5 3 3.5 4 4.5 Spent Wash PTDE PTDE with 50% water PTDE with 75% water
0 0
3.4
Chart 11: TOTAL POTASSIUM Chart 12: DISSOLVED OXYGEN
The pH of the spent wash is strong and highly acidic in nature that is 4.31. After primary treatment the pH of the PTDE is in neutral state 7.3 and after diluting the PTDE with 50% water the pH is 7.7, after 75% dilution pH is 7.8 which is moderately alkaline. The value of pH changes from acidic to moderately alkaline on dilution.
EC of the spent wash is 23.80 mS/cm . EC of PTDE is 19.54 mS/cm on dilution with 50% water the EC is 14.87mS/cm and on 75% dilution EC is 14.87 mS/cm.
Total Solids is also referred as total residue in the sample left in the container after evaporation. Total Solids present in spent wash is 75048 mg/L. Total Solids present in PTDE is 61758 mg/L and on dilution with 50% water 32547 mg/L, on dilution with 75% water 22487 mg/L. The values of Total Solids decreases on increase of dilution.
ISSN: 2321 9653; IC Value: 45.98; SJ Impact Factor: 7.538
Volume 10 Issue X Oct 2022 Available at www.ijraset.com
Total Suspended Solids is defined as solids in the sample that is trapped by filter paper TSS measure of spent wash is 14016 mg/L. TSS present in PTDE is 10546 mg/l. On dilution with 50% water TSS is 10546 mg/L, and on dilution with 75% water TSS is 3130 mg/L. The values of Total Suspended Solids decreases on increase of dilution.
TDS is the measure of dissolved combined contents of all the in organic and organic substances present in the sample in micro granular suspended form. TDS measure of spent wash is 61032mg/L. TDS present in PTDE is 51212mg/l. On dilution with 50% water TDS is 26190 mg/L, and on dilution with 75% water TDS is 19357 mg/L. The values of Total Suspended Solids decreases on increase of dilution.
TH is the sum of Calcium & Magnesium conc. TH is a measure of mineral content in a water sample. The spent wash is very hard in nature even after pre treatment and dilution the hardness is very high. The hardness of spent wash is 2180.6 mg/L. The value of PTDE is 1850.5 mg/L. The values of 50% and 75% are 1287.6 mg/L and 857.6 mg/L respectively.
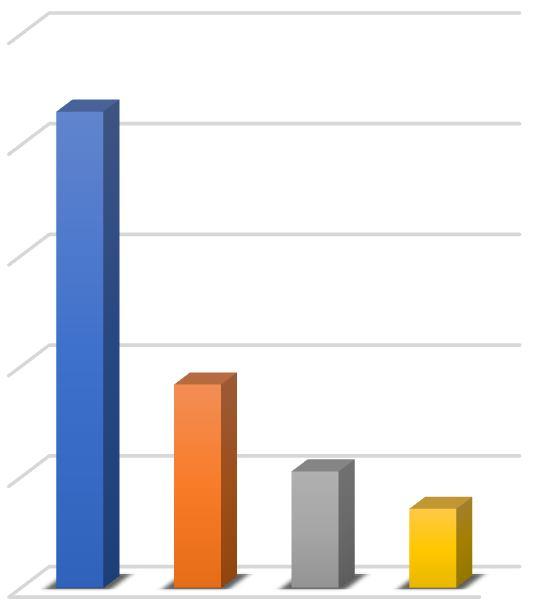
BOD of the spent wash is very high that is 18502.6 mg/L. BOD of the PTDE is 12589.58 mg/L and after dilution with 50% of water and 75% of water the values are 7689.8 mg/L and 2358.9 mg/L respectively. The values of BOD decreased with the increase in dilution. However BOD of spent wash is very high even after dilutions.
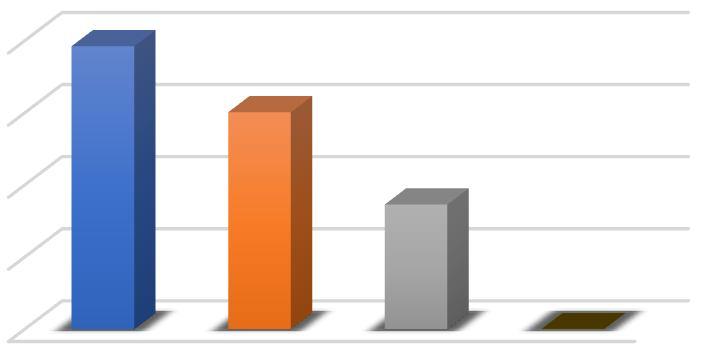
COD of the spent wash is very high that is 34000 mg/L. The COD of PTDE is 22897 mg/L and after dilution with 50% of water and 75% of water the values were 1256.57 mg/L and 3586.5 mg/L respectively. The values of COD decreased with the increase in dilution. However COD of spent wash is very high even after dilutions.
The total phosphorus vale of spent wash is 54.7 ppm. TP value of PTDE is 40.9 ppm and after the dilution to PTDE with 50% and 70% water the TP values are 29.8 ppm and 18.5 ppm respectively. The values of TP decreases with increase in dilution.
The total potassium vale of spent wash is 7850.15 ppm. TP value of PTDE is 6018.9 ppm and after the dilution to PTDE with 50% and 70% water the TP values are 3458.3 ppm and 1569.4 ppm respectively. The values of TP decreases with increase in dilution.
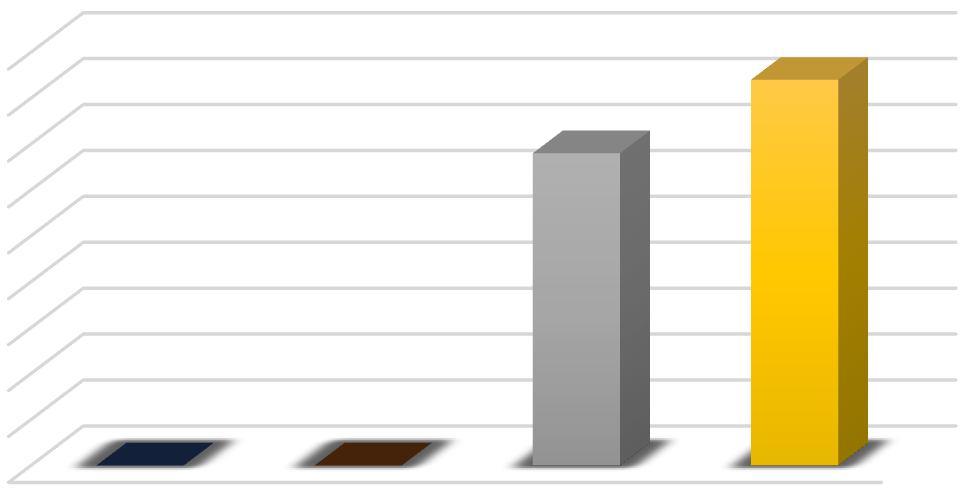
Raw spent wash has nil dissolved oxygen level. The primary treated distillery effluent also has nil dissolved oxygen. After the dilution of PTDE with 50% and 75% water there is slight visibility in dissolved oxygen levels that is 3.4 mg/L & 4.2 mg/L respectively.
The present study conducted for the spent wash revealed about the physio chemical characteristics which have high load of pollutants. The analysis was also done for the primary treated distillery effluent (PTDE), PTDE diluted with 50% and 75% water. The spent wash collected was dark brown in color. Odor of the spent wash was very unpleasant and alcoholic. The raw spent wash is highly acidic in nature. The spent wash has very high values of solids, electrical conductivity, hardness, chlorides, BOD & COD. The DO is found nil in the spent wash and has very high level of organic constituents such as nitrogen potassium and phosphorus. On observation we came to know that all the values of physio chemical properties are decreased. By this phenomenon we came to know that toxicity of DSW decreases with increase in dilution. Thus the spent wash PTDE should not be allowed directly to the water bodies. Hence we came to know that it requires further treatment and dilutions before discharging to the water bodies.
ISSN: 2321 9653; IC Value: 45.98; SJ Impact Factor: 7.538 Volume 10 Issue X Oct 2022 Available at www.ijraset.com
[1] Kulkarni, A.D., A.V. Yewale, and S.J. Jadhav. “Fertilizer from spent wash A review”. BharatiyaSug.,12(9): 17 20 (1987).
[2] Haron, M. A. R. and S.C.M. Bose. “Use of distillery spent wash for alkali soil reclamation, treated distillery effluent for ferti irrigation of crops”. Indian Farming, March. 48 51 (2004).
[3] Sweeney, D.W. and D.A. Graetz. “Application of distilleries waste anaerobic digester effluent to St. Augustine grass”. Agri. Eco. Environ.,33:341 351 (1999).
[4] Bhat, S. N. “Investigation on the effect of lagoon spent wash on soil properties”. M. Sc. (Agri.) Thesis, Univ. Agric. Sci., Dharwad, (1994).
[5] Murugaragavan, R. “Distillery spent wash on crop production in dryland soils”. M.Sc. (Environmental Sciences) Thesis, Tamil Nadu Agricultural University, Coimbatore, India, (2002).
[6] APHA. “Standard methods for the examination of water and wastewater”.18thedn. (Pub.), American Public Health Association, Washington, USA, (1992).
[7] Pathak. H., H.C. Joshi, A. Chaudhary, N. Karla and M.K. Dwivedi. “Distillery effluent as soil amendment for wheat and rice”. J. Indian. Soil Sci.,46:155 157 (1998).
[8] Patil, G. D., S. M.Pingat and A. J.Yelwande. “Effect of spentwash levels on soil fertility, uptake, quality and yield of fodder maize”. J. Maharashtra Agric. Univ.,25(2): 168 170 (2000).
[9] Kailasam, N., N.Subramaniam and M.Selvam. “Analysis of distillery effluent and its effect on the mortality of earthworm (Megascolexpumilio)”. J. Ecotax. Environ. Monit.,12: 21 25 (2001).
[10] Dikshit, A.K., and D. Chakraborty. “A techno economic feasibility study on removal of persistent colour and COD from anaerobically digested distillery effluent: a case study from India”. Clean Tech and Environ, Policy,8:273 285 (2006).
[11] Singandhupe, R.B., M.Das, H. Chakraborthy and A. Kumar. “Effect of different levels of distillery effluents on growth, yield and soil health in sugarcane crop in Orissa”. Indian J. Agric. Sci.,79(12): 1030 1035 (2009).
[12] Radha, J. and S. Srivatava. “Nutrient composition of spent wash and its impact on sugarcane growth and biochemical attributes”. Physio. Mol. Biol. Plants.,18(1): 95 99 (2012).