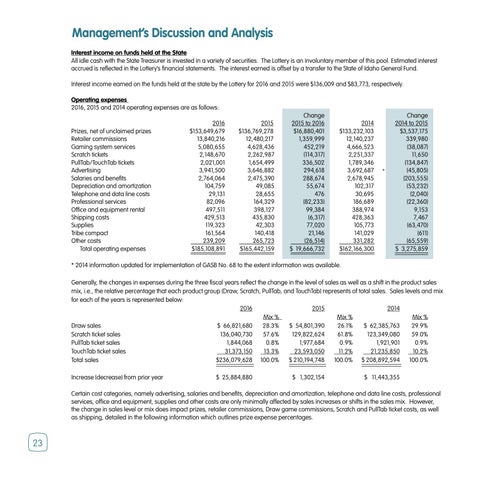
Management’s Discussion and Analysis Interest income on funds held at the State All idle cash with the State Treasurer is invested in a variety of securities. The Lottery is an involuntary member of this pool. Estimated interest accrued is reflected in the Lottery’s financial statements. The interest earned is offset by a transfer to the State of Idaho General Fund. Interest income earned on the funds held at the state by the Lottery for 2016 and 2015 were $136,009 and $83,773, respectively. Operating expenses 2016, 2015 and 2014 operating expenses are as follows: 2016 2015 Prizes, net of unclaimed prizes $153,649,679 $136,769,278 Retailer commissions 13,840,216 12,480,217 Gaming system services 5,080,655 4,628,436 Scratch tickets 2,148,670 2,262,987 PullTab/TouchTab tickets 2,021,001 1,654,499 Advertising 3,941,500 3,646,882 Salaries and benefits 2,764,064 2,475,390 Depreciation and amortization 104,759 49,085 Telephone and data line costs 29,131 28,655 Professional services 82,096 164,329 Office and equipment rental 497,511 398,127 Shipping costs 429,513 435,830 Supplies 119,323 42,303 Tribe compact 161,564 140,418 Other costs 239,209 265,723 Total operating expenses $185,108,891 $165,442,159
Change 2015 to 2016 2014 $16,880,401 $133,232,103 1,359,999 12,140,237 452,219 4,666,523 (114,317) 2,251,337 336,502 1,789,346 294,618 3,692,687 288,674 2,678,945 55,674 102,317 476 30,695 (82,233) 186,689 99,384 388,974 (6,317) 428,363 77,020 105,773 21,146 141,029 (26,514) 331,282 $ 19,666,732 $162,166,300
*
Change 2014 to 2015 $3,537,175 339,980 (38,087) 11,650 (134,847) (45,805) (203,555) (53,232) (2,040) (22,360) 9,153 7,467 (63,470) (611) (65,559) $ 3,275,859
* 2014 information updated for implementation of GASB No. 68 to the extent information was available. Generally, the changes in expenses during the three fiscal years reflect the change in the level of sales as well as a shift in the product sales mix, i.e., the relative percentage that each product group (Draw, Scratch, PullTab, and TouchTab) represents of total sales. Sales levels and mix for each of the years is represented below: 2016 2015 2014 Mix % Mix % Mix % Draw sales $ 66,821,680 28.3% $ 54,801,390 26.1% $ 62,385,763 29.9% Scratch ticket sales 136,040,730 57.6% 129,822,624 61.8% 123,349,080 59.0% PullTab ticket sales 1,844,068 0.8% 1,977,684 0.9% 1,921,901 0.9% TouchTab ticket sales 31,373,150 13.3% 23,593,050 11.2% 21,235,850 10.2% Total sales $236,079,628 100.0% $ 210,194,748 100.0% $ 208,892,594 100.0% Increase (decrease) from prior year
$ 25,884,880
$ 1,302,154
$ 11,443,355
Certain cost categories, namely advertising, salaries and benefits, depreciation and amortization, telephone and data line costs, professional services, office and equipment, supplies and other costs are only minimally affected by sales increases or shifts in the sales mix. However, the change in sales level or mix does impact prizes, retailer commissions, Draw game commissions, Scratch and PullTab ticket costs, as well as shipping, detailed in the following information which outlines prize expense percentages.
23