1 A quick and insightful look at the realities of the real estate market in Phoenix Metro
2 We utilize The Cromford Index™ which is a set of market indicators to measure the balance of supply and demand
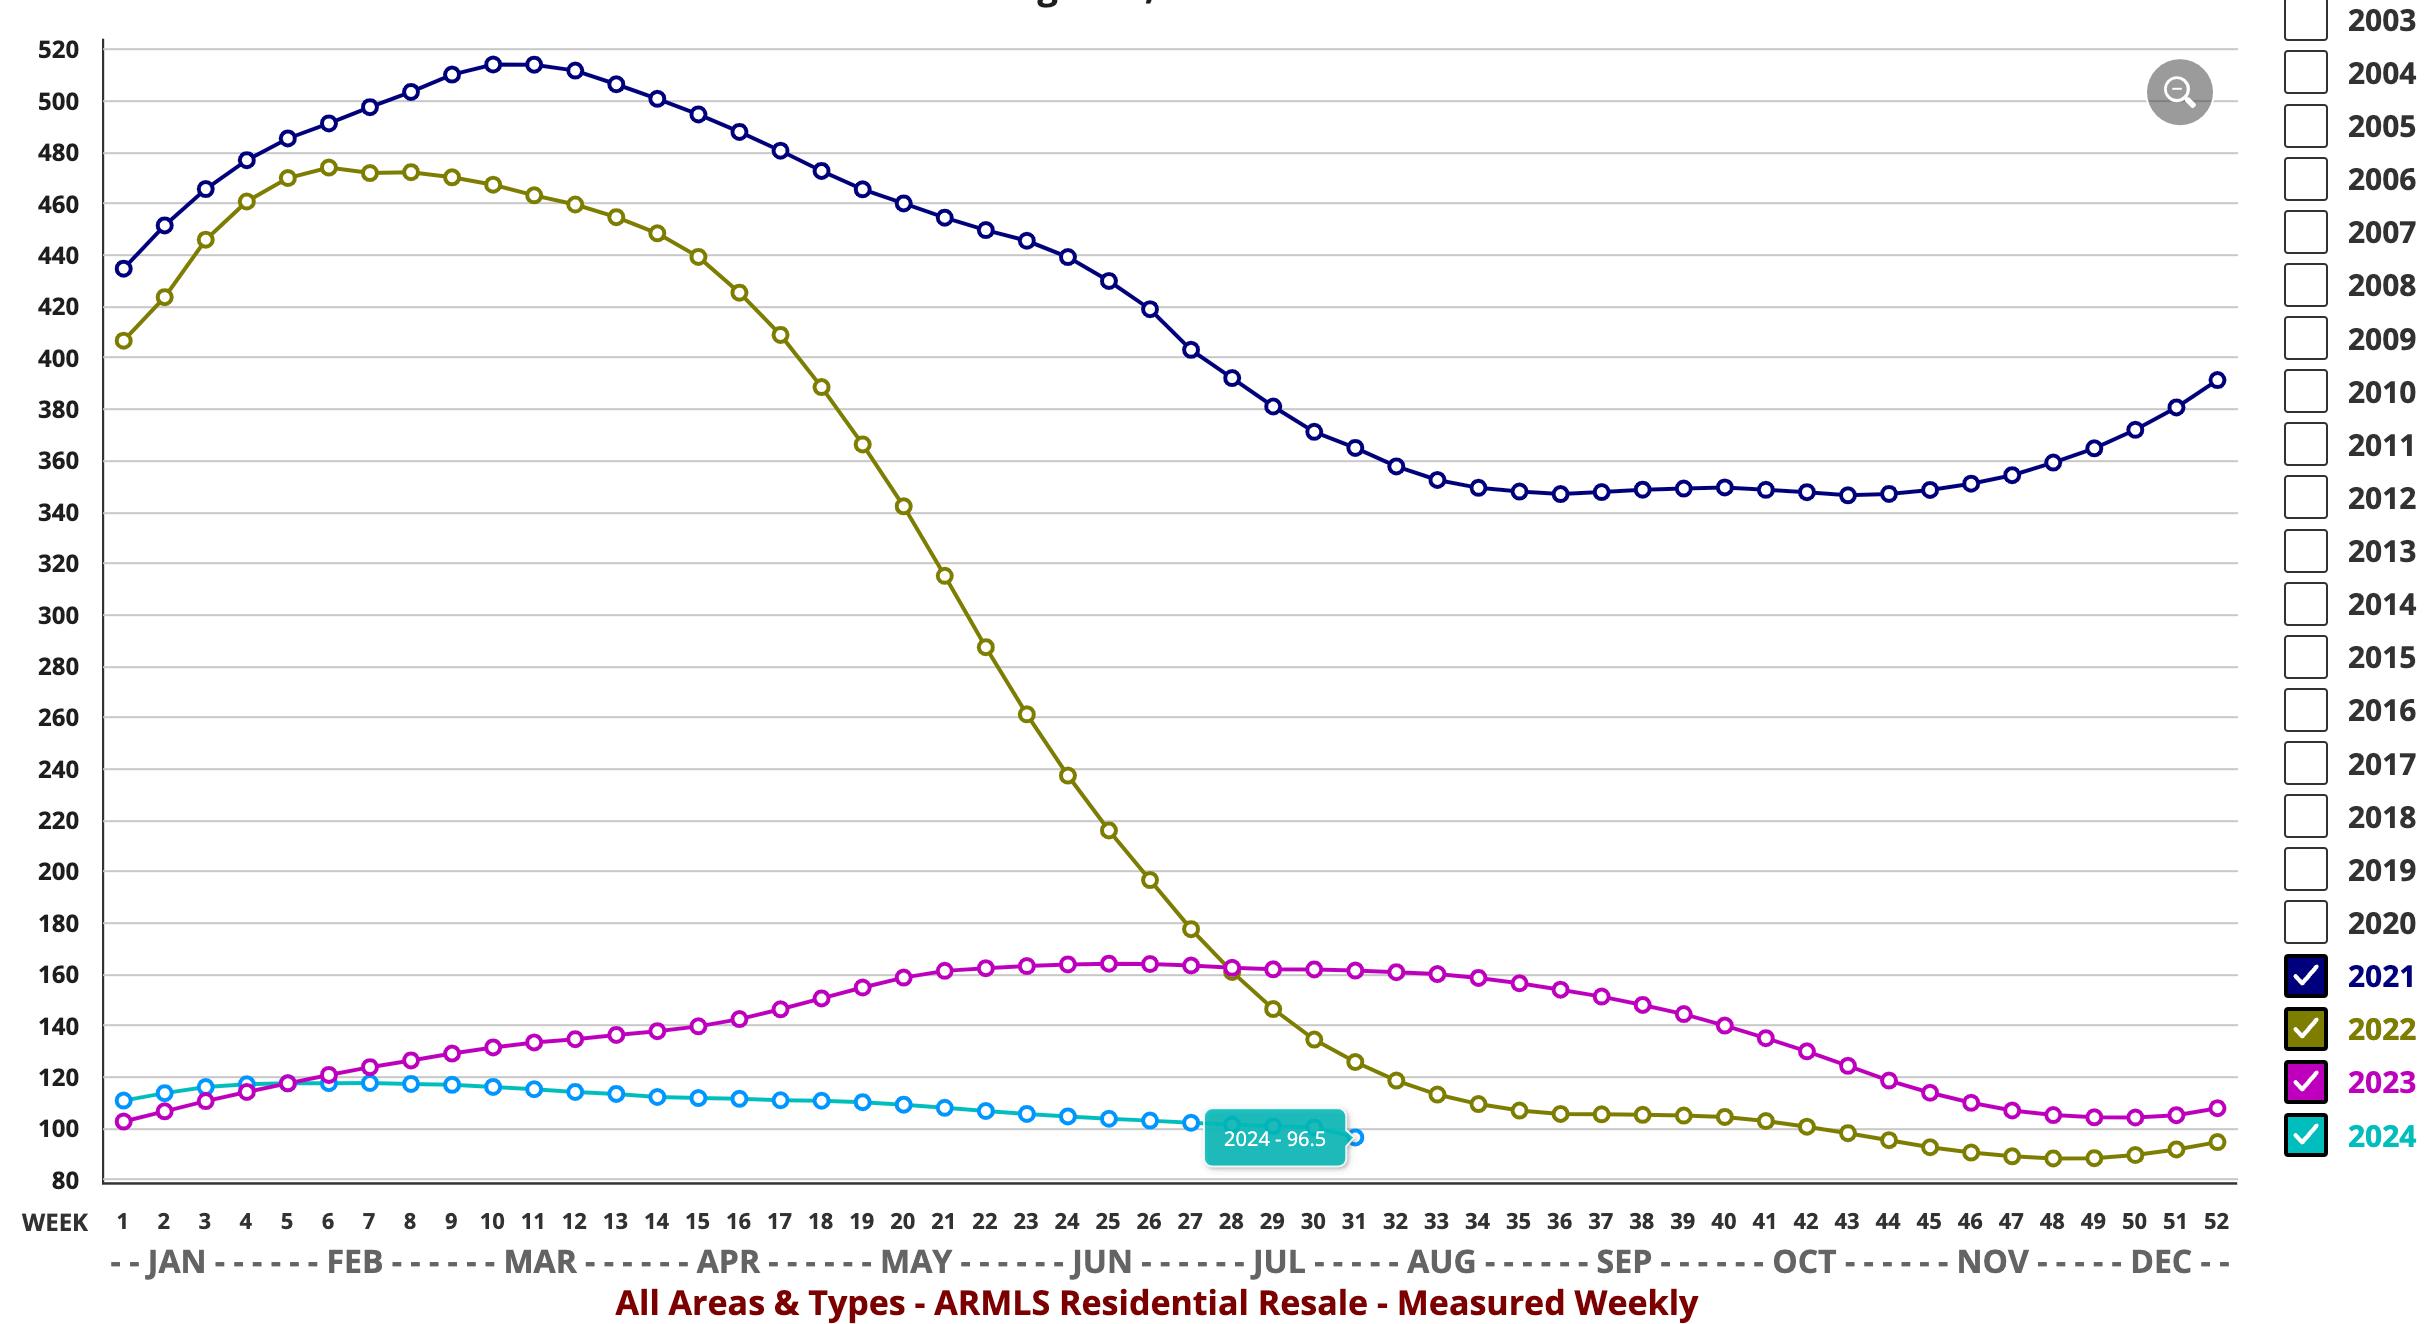
3-4 A comprehensive look at more detailed market statistics from a past and current perspective
OVERALL INSIGHTS
There is very little positive about these numbers as the Greater Phoenix housing market continues to suffer from weak demand and low volumes. However if you dig deeply you can find some excuses for mild optimism. The supply has fallen over the past month and although it remains significantly higher than last year, it is now on a downward trend, at least for the short term. We also see a very slight uptick in pending listings from last month, though this positive sign is counterbalanced by a decline in listings under contract
At first the monthly sales count looks promising - up 4 8% from July 2023, but as there was 1 more working day in July 2024, this is largely an illusion Closings remain far below normal levels and professions that get paid at closing continue to suffer from a shortage of revenue.
Though there are plenty of credit problems in other sectors (e.g. auto loans, credit cards), home loans are looking very healthy with delinquency stuck at low levels. This also means foreclosure volumes are very small and there is little sign of that changing in the near to medium term. You Tubers have been forecasting a new tsunami of foreclosures for over 5 years now and have managed to be 100% wrong Those who would love to see more bank-owned homes enter the market are out of luck. There is also no sign of their luck changing in the near term.
Most pricing measures have fallen hard since May, but that is largely due to seasonal effects This is particularly true of average active listing prices This is because listings for luxury homes have been disappearing at great speed. Most were not sold. The majority were cancelled or expired. For example, the number of active listings over $2 million is down 22% over the past 2 months, while those over $7.5 million are down 42%.
Current pricing is only slightly ahead of this time last year, with the median sales price up only 1.2%. Most things have risen far more than 1 2% over the past 12 months, so homes are effectively cheaper in real terms than they were a year ago
Mortgage rates have dropped, with the average 30-year fixed rate down from 6.80% to 6.40%.. They could drop further if the Federal Reserve do as expected and lower the base rate at their September meeting. Nothing is certain, but it would be a fair guess than demand would pick up significantly if rates get back around the 6% mark.
Overall, the market is balanced with a slow and gentle trend towards greater bargaining power for buyers. However, now that supply is falling, it would only take a small increase in demand to reverse that trend.
Nicole Kobrinsky PRESIDENT & BROKER OF RECORD
HIGHLIGHTS
MARKET TYPE
SUPPLY TREND
The Supply Trend Index has had no change since last month
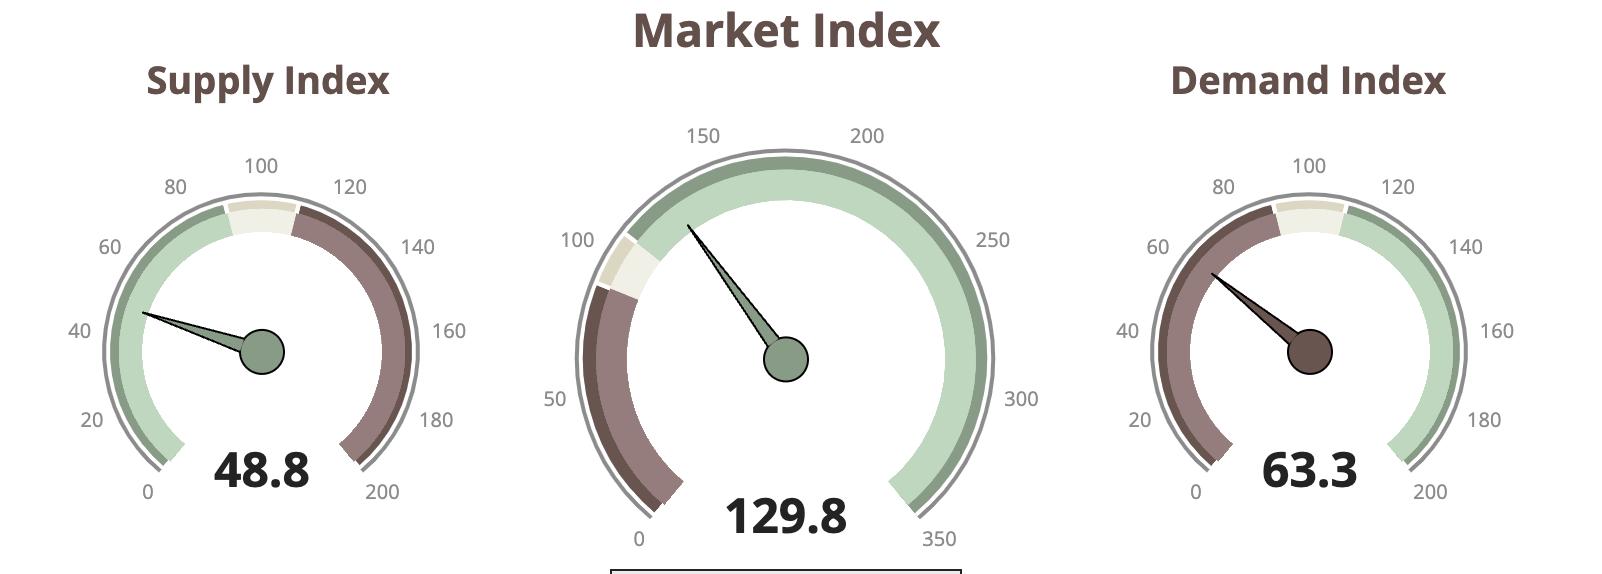
MARKET INDEX
The 100 mark represents the index value for a balanced market A value above 100 represents a market that favors a seller A value below 100 represents a market that favors a buyer. The Market Index Trend is down 5 pts in the last month
DEMAND TREND
The Demand Index Trend is down a small 2 5 pts in the last month
TRENDS
CROMFORD MARKET INDEX
MARKET HIGH
The Market Index was 514 at the height of the market in May 2021
EXPECTATIONS
We anticipate low volumes to continue during August and we have 2-3 months of seasonal price weakness to endure before the market is likely to pick up steam again in October
MARKET LOW
In the late Spring of 2022, the market decelerated quickly The lowest Market Index of 88.3 was seen in December 2022.
PRICING
The monthly median sales price trend down 1 2% since last year The monthly average price per square foot trends up 1 2% YOY
INVENTORY
Active listings (excluding UBC) are up 55% YOY and months of inventory is up 52 6% from 1 9 to 2 9 months YOY Prices are likely to inch upward in the coming months
VOLUME
Overall volume of residential sales for the year is down 4 6% compared to August 2023
Questions or Comments? Email Report author: Nicole Kobrinsky at nicole@housegallery com
6901 East 1st St Suite 103 Scottsdale, Arizona 85251
IF YOUR PROPERTY IS CURRENTLY LISTED WITH ANOTHER REAL ESTATE BROKER, OR YOUR ARE UNDER A BUYER REPRESENTATION CONTRACT WITH ANOTHER REAL ESTATE BROKER, PLEASE DISREGARD THIS OFFER IT IS NOT OUR INTENTION TO SOLICIT THE OFFERINGS OF OTHER REAL ESTATE BROKERS