MARKET REPORT

Second Quarter Performance, 2023

Table of Contents The District 2 Executive Summary 3 At A Glance 4 Top Stories 5-6 Working In Hollywood 7-10 11-16 Living In Hollywood Visiting Hollywood 17-22 Retail In Hollywood 23-25 26 Upcoming Development 1
The Hollywood Entertainment District
The Hollywood Partnership (THP) is a non-profit organization that manages the public realm within the Hollywood Entertainment District (HED), which is a Property Based Business Improvement District (PBID). Simply, this means that the organization is funded by property owners within the district to provide enhanced services to promote the cleanliness, safety, beautification, and economic vitality of our neighborhood.

2
Executive Summary
The Hollywood Entertainment District (HED) continues to face numerous challenges in its post-pandemic evolution, including an unstable economy, labor strikes in the tourism and entertainment industries, and significant growth in its homeless population. Despite these difficulties, the community has shown impressive adaptability and resilience. In fact, the HED has experienced a remarkable 14% population growth since 2010, compared to just 2% citywide, with a resident population of 31,000 and growing. The district's population density of 22,000 persons per square mile is closer to that of New York City than typical of Los Angeles.
Residential development has been a driving force in the HED, with 6,300 units proposed, entitled, or under construction. More than 10% of these units are deemed affordable at all income levels, and some, like the recently opened Hollywood Arts Collective, offer unique incentives to attract individuals who work in the arts and entertainment fields.
Although working from home has impacted the office market in cities across the country, some positive trends are emerging in this sector. In Hollywood, Class A office space is showing signs of recovery, maintaining its leases and bringing in new tenants faster than Class B or C. Rents for Class A office space have increased by 6% over Q2 2022, and vacancy rates are at 16.5% less than the overall office vacancy rate of 23.1%.
The Hollywood hotel industry has also shown positive numbers, outperforming citywide averages across the board. The opening of Palihotel Hollywood increased the neighborhood's room supply in Q2, and the upcoming opening of Whisky Hollywood is expected to further boost the area's tourism industry.
Overall, Hollywood has much to be proud of, with impressive growth and resilience in the face of adversity. Please enjoy the following Market Report for Q2 2023.
3
Q2 AT A GLANCE
Source: ESRI Community Analyst, LATCB, STR, The Hollywood Partnership
Residents
Average Income: $80K
Median Income: $55K
Population: 31,469
Pop. Density: 22,478
Employees
Average Income: $72K
Median Income: $48K
Population: 35,227
Visitors
Average Income: $103K
Median Income: $66K
Population: 79,820
35.6
Domestic Visits Jan-Jun 2023 Domestic Visits 2022
Daytime Population 2023
HED 19.1 Million
Million
47,936
/ Sq. Mi. 4
Q2 TOP STORIES
HP Update: ELECTED OFFICIALS VISIT HOLLYWOOD
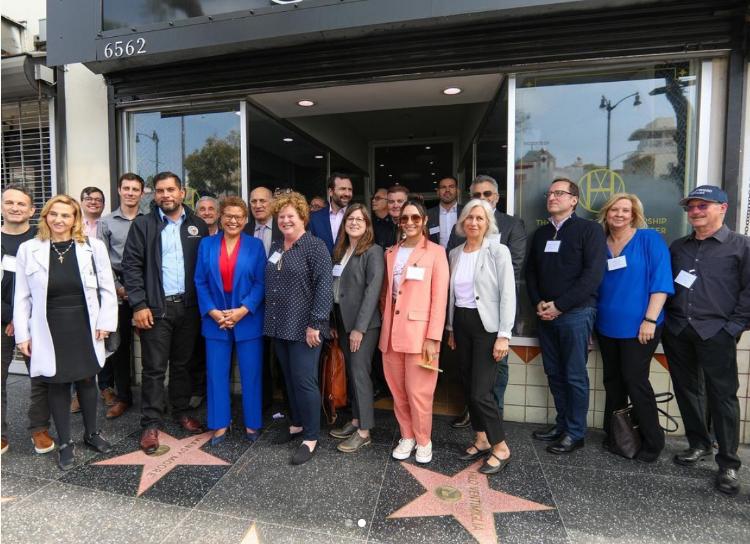
On Friday, May 19, The Hollywood Partnership (THP) welcomed Mayor Karen Bass, Senator Ben Allen, and Councilmember Hugo Soto-Martinez to the Hollywood Partnership Community Dispatch Center (HPCDC). During their visit, THP gave a presentation about the HPCDC and other projects related to creating a cleaner, safer, and more vibrant public realm. The trio also engaged in a discussion with a small group of Hollywood Stakeholders regarding various topics, such as outreach and rehabilitation services, the Hollywood Community Plan, the preservation of the creative economy, and more. THP is excited to continue these conversations with our elected officials moving forward.
HP Update: LA Pride in Hollywood
On Sunday, June 11, we hosted the LA Pride Parade and Village in partnership with Christopher Street West (LA Pride). This free and inclusive event featured over 140 parade contingents, 14 musical performers, 89 vendor booths, 11 food trucks, and a bar garden, all of which contributed to its massive success. The Hollywood Entertainment District recorded over 140,000 visits on the day of the event, and 35,000 people came out to celebrate Pride Month and the LGBTQIA+ Community at LA Pride Village. Our Pride marketing efforts were incredibly effective and resulted in 1.5 billion media impressions worth an estimated $14 million in estimated ad value, as well as 28,000 impressions on social media.

5
Q2 TOP STORIES
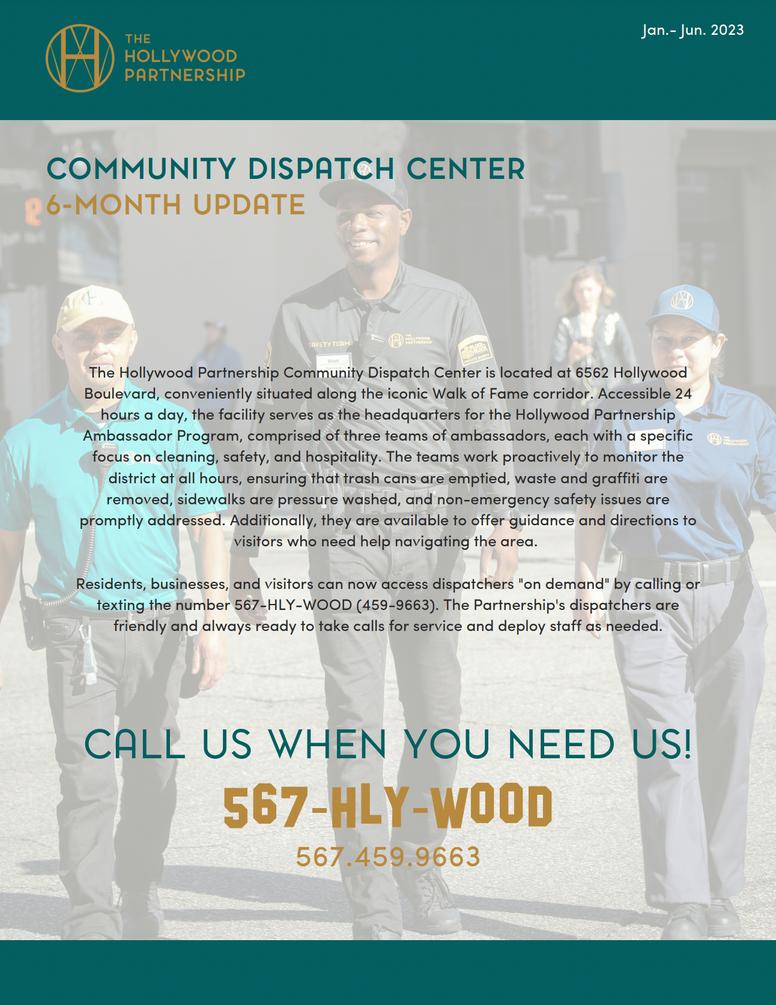
HP Update: DISPATCH CENTER MID-YEAR REPORT
OnJuly1,TheHollywoodPartnershipCommunityDispatchCentermarkeditssix-month milestone.Throughoutthistime,ourdedicatedteamofdispatchersandambassadorshave handledanimpressive9,000callsforservice,resultinginover134,000interactions. Interestedinfindingoutmoreaboutthedispatchcenter'soperations?Themid-yearreportis nowavailablebelowforreview.
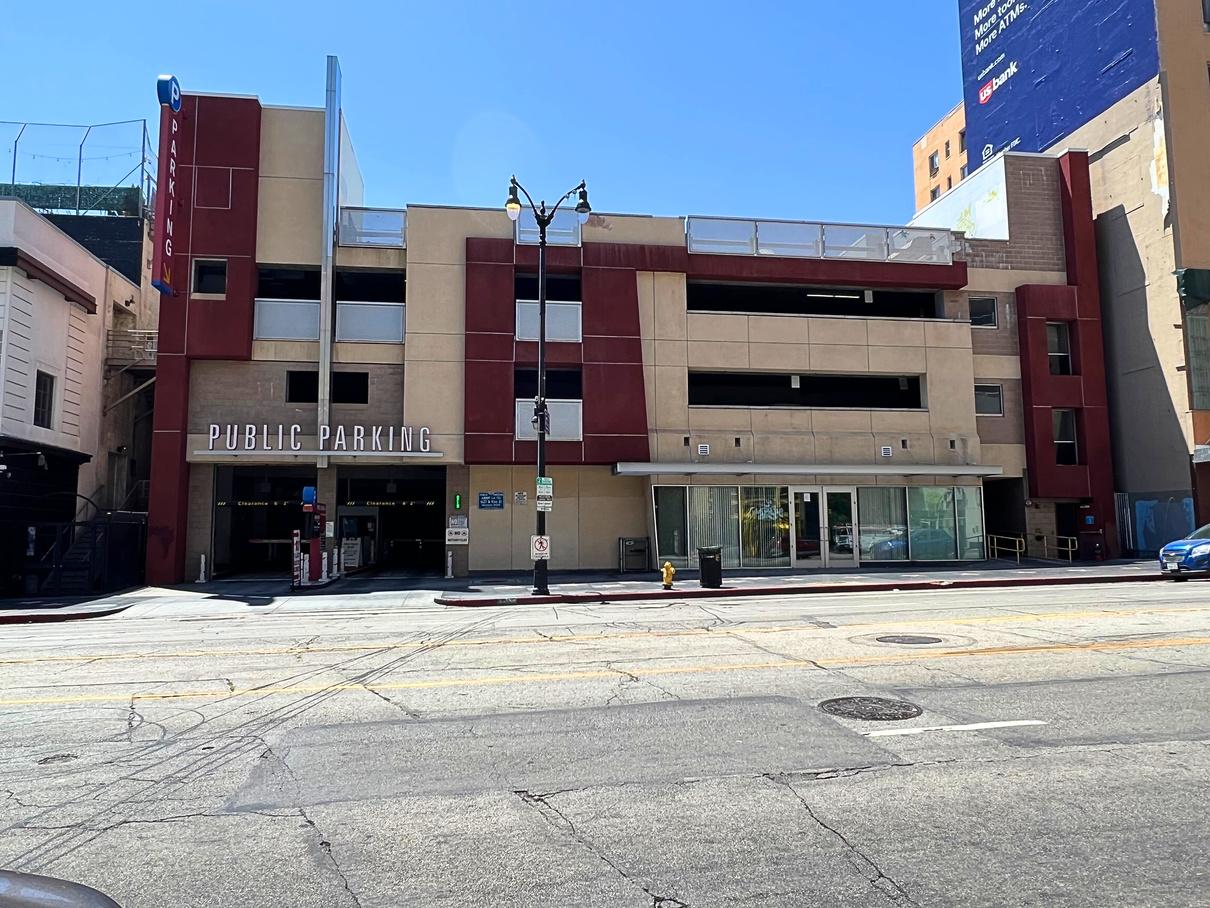
This Just In: HOLLYWOOD TO GET PUBLIC RESTROOMS
In Q2, Hollywood Partnership Community Trust secured a substantial amount of funding, including $1 million from the City and $500K from Assemblymember Rick Chavez Zbur, to build and operate a state-of-the-art restroom and visitor center in the public parking structure located at 1627 Vine St. This high-quality facility will include a restroom concierge and custodial team that will be present during operation.
Click Here to View the Report Learn more at HollywoodPartnership.com 6
Working in Hollywood
At its heart, Hollywood is a mecca for creativity and storytelling. Buoyed by a robust entertainment production ecosystem and brandishing a priceless name representing a neighborhood and an industry, Hollywood combines the best of laid-back Southern California culture with dedicated work, creative energy, and drive. While the community is home to a substantial share of entertainment production jobs consistent with its global brand, Hollywood features a diverse employment base. Other major employment clusters include information and technology firms, healthcare, personal and professional services, and abundant retail and food & beverage industry jobs. That diversity of employment translates directly to the diversity of the workforce, which is always on display throughout the neighborhood.

47,936 Daytime Population In HED
35,227 Employees In HED
Employee Race + Ethnicity
$72,000 Average Employee Income In HED 5 Million Annual Employee Visits to HED
7%
Latinx 47% White
Asian
Black
30%
12%
7 Source: ESRI Community Analyst, Placer. ai
Working Continued
Diverse Employment Base
Q2 HED Employee Visits 2018-2023
The HED received 1.5 million employee visits during both Q1 and Q2 of 2023, indicating a steady pattern of recovery.
Professional, Scientific & Technical Services 13% Information 12% Accommodation & Food Services 12% 10% Arts, Entertainment, Recreation Retail 10% 8% 7% 6% Education Services Finance, Insurance & Real Estate Health Care
Source: ESRI Community Analyst, Placer.ai 8 Q2 2018 Q2 2019 Q2 2020 Q2 2021 Q2 2022 Q2 2023 2,000,000 1,500,000 1,000,000 500,000 0
Hollywood Office Market
Duringthesecondquarterof2023,therewasatotalof88,339squarefeetofleasingactivityinHollywood,bringingtheyearto-datetotalto106,020squarefeet.Whileofficevacancyratessawamodest2%increasefromthepreviousquarteranda1% increasefromthepreviousyear,itisworthnotingthatClassAofficeaverageaskingrentshavecontinuedtoescalatesteadily. InQ22023,theyreached$5.04persquarefoot,whichisonedollarhigherthanthecitywideaverage.
4.9M SF Hollywood Office Inventory $5.04 Hollywood Class A Avg. Monthly Asking Rent PSF $3.60 L.A. Overall Avg. Monthly Asking Rent PSF $4.72 Hollywood Overall Avg. Monthly Asking Rent PSF $4.04 L.A. Class A Avg. Monthly Asking Rent PSF Q12020Q22020Q32020Q42020Q12021Q22021Q32021Q42021Q12022Q22022Q32022Q42022Q12023Q22023 400,000 300,000 200,000 100,000 0 -100,000 -200,000 -300,000 -400,000 YTD Net Absorption Greater Hollywood Office Market: Q2 2023 Overall Asking Rents (PSF/monthly) $4.72 -1% from Q1 2023 -1% from Q2 2022 Compared to $3.63 Citywide Class A Asking Rents (PSF/monthly) $5.04 +1% from Q1 2023 +6% from Q2 2022 Compared to $4.04 Citywide Overall Vacancy Rate 23.1% +2.3% from Q1 2023 +1% from Q2 2022 Compared to 22.9% Citywide
Cushman and Wakefield 9
Source:
OFFICE DEVELOPMENT
Gr. Hollywood + HED
2 Projects Under Construction
6 Projects Entitled
1,418,571
Total SF Entitled or Under Construction
15 Projects Proposed
HED
2 Projects Under Construction
3 Projects Entitled
1,325,524
Total SF Entitled or Under Construction
Coming Soon: SKIMS SHAPES UP TO BE A GREAT ADDITION IN HWD
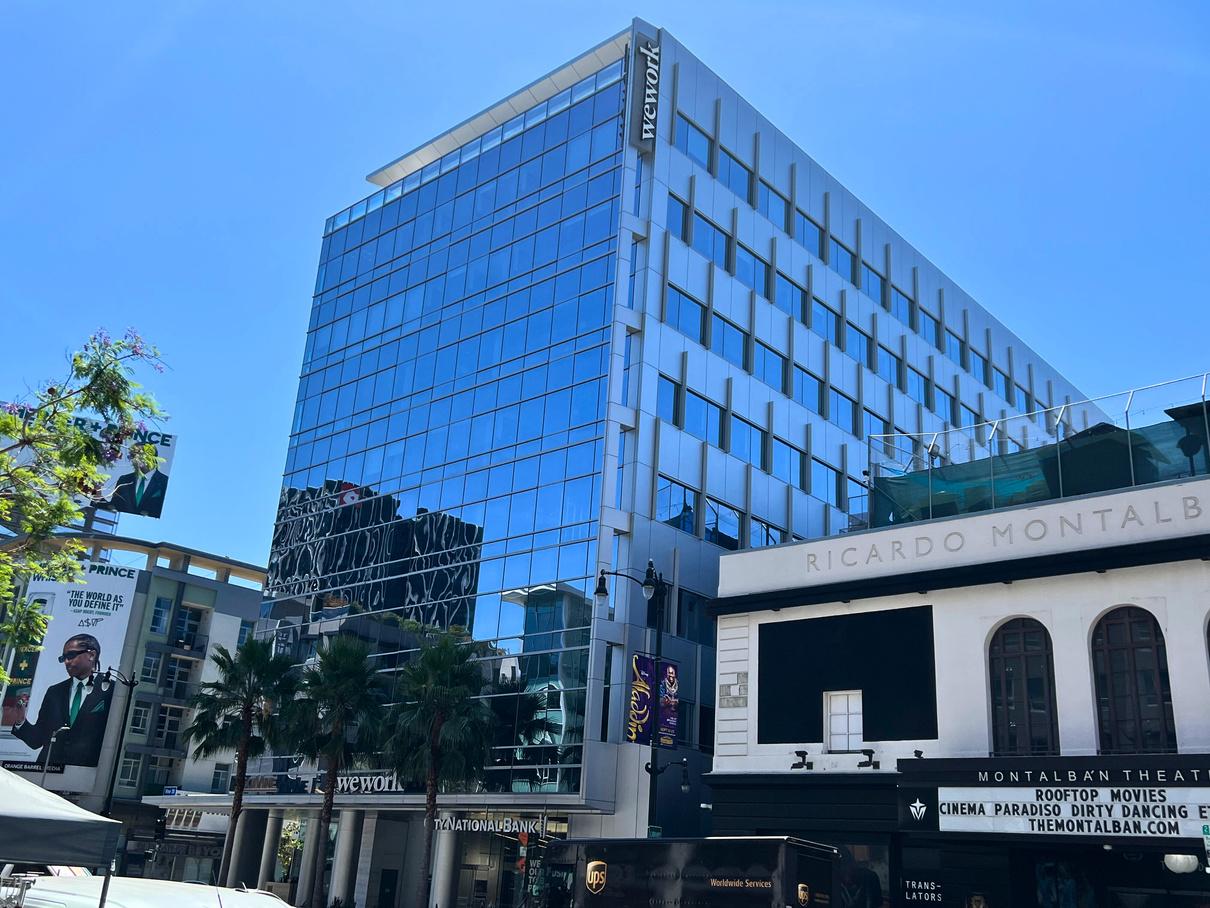
SKIMS, the renowned shape-wear and athleisure fashion brand founded by Kim Kardashian, is set to make a move to Hollywood. The company, now valued at $4 billion, has acquired an extensive 116,000 square feet of office space on the 2nd through 8th floors of the former WeWork Hollywood building situated at 1601 Vine St. The new SKIMS headquarters will occupy all available office space at the location.
5 Projects Proposed
10 Source: The
Partnership
Hollywood
Living in Hollywood
FewplacescarrythesameimmediatenamerecognitionorintrigueasHollywood,attractingadiversemixofpeoplefromall overtheglobetoliveandworkintheworld'screativecapital.Withitscentrallocation,modernamenities,andreputationas the"mostwalkableneighborhood"inLosAngeles,Hollywoodhasitsownuniquecharacterthatappealstomodern-day creatives.
TheHollywoodpopulationisprimarilyrenters,hasamedianageof36.5,andisupwardlymobile,with54%havinga bachelor’sdegreeorhigherandwithamedianhouseholdincomeof$55,000.Hollywoodresidentsaremorelikelytotake transit,walkorworkfromhomecomparedtocitywideaverages.Asaresult,thereishighdemandforlivinginHollywood, particularlyintheHED.
$55,053 Median Household Income In HED
36.5 Median Residential Age In HED
Higher Clickthroughs vs. Time of Day
Presentations are communication tools that can be used as demonstrations
31,469 Residential Population In HED
22,478 Population Density (per square mile)
94% Renter Occupied In HED
1.67
54% Bachelors Degree or Higher In HED
Avg. Household Size In HED
Higher Clickthroughs vs. Time of Day
Presentations are communication tools that can be used as demonstrations
11 Source: ESRI Community Analyst
LIVING CONTINUED
Greater Hollywood Generations
Hollywood's residential population includes a diverse mix of people from all age groups and generations, with millennials being the most well-represented group.
It is worth noting that figures indicate that residents desire to remain in their current homes for the next five years.
Resident Commute
Race + Ethnicity
Millenial 39.9% Gen X 19% Gen Z 17.7% Baby Boomer 14.8% Greatest Generation 4.7%
White 45% Latinx 35% Black 9% Asian 9% Drive Alone
Work From Home HED City of LA LA County Public Transportation Walk Carpool Bicycle 48.8% 11.8% 65.2 70% 8.9% 3.2% 4.9% 10.9% 6.7% 8.8% 7.7% 2.5%
12 Source: ESRI Community Analyst Alpha 4% 12.4% 9.3% 19.5%
Multifamily Market Conditions
While both the HED and Greater Hollywood boast higher monthly rents than the citywide average, they also exhibit slightly higher vacancy rates.
Greater Hollywood HED City of LA
7,146 Existing Units In HED
45,907 Existing Units In Greater Hollywood
455,331 Existing Units In City of LA
$2,830 Monthly Avg. Asking Rent
$2,278
Monthly Avg. Asking Rent
$2,194 Monthly Avg. Asking Rent
7% Vacancy Rate
6% Vacancy Rate
6% Vacancy Rate
13 Source: CoStar Group, The Hollywood Partnership
MULTIFAMILY MARKET CONTINUED
Multifamily Residential Vacancy Rates (2010-2023)
While multifamily residential vacancy rates in the HED are higher than Greater Hollywood and Los Angeles, they often spike in correlation with an increase in deliveries. According to the latest report, HED vacancy rates have remained stable at 6-9% since Q4 of 2021. However, when analyzing the vacancy rates for Q2 over the years, it was found that 2023 has marked the lowest vacancy rate since 2014.
HED Greater Hollywood City of LA LA County Total Residential Inventory (Units) 7,146 45,907 455,331 1.2 Million Avg. Residential Vacancy Rate (%) 7.1% 6% 5.8% 4.5% Avg. Asking Rent PSF/Monthly $3.64 $3.14 $2.98 $2.73 Avg. Asking Rental Rate Per Unit $2,830 $2,278 $2,194 $2,128 Cap Rate (YTD) 3.9% 4.2% 4.3% 4.5%
HED Gr. Hollywood City of LA Q22010 Q22011 Q22012 Q22013 Q22014 Q22015 Q22016 Q22017 Q22018 Q22019 Q22020 Q22021 Q22022 Q22023 20 15 10 5 0 14 Source: CoStar Group
Hollywood Residential Development
There are 33 residential projects entitled or under construction in Greater Hollywood, with 13 of these (or 40%) located in the HED. Of the approximately 5,111 residential units entitled or under construction in Greater Hollywood, 53% (2,709) are within the HED boundaries. This reflects the district’s density rate and a continued increase in population growth over time. Approximately 9%, (249) of the total residential units planned within the HED will be designated affordable.
Greater Hollywood + HED
11 Projects Under
22 Projects
5,111
Total Units Entitled or Under Construction
36 Projects Proposed
HED
2,709
12 Projects Proposed
Construction
Construction
Entitled
Entitled 1 Project Under
12 Projects
Total Units Entitled or Under Construction 15 Source: The Hollywood Partnership
RESIDENTIAL DEVELOPMENT CONTINUED
Development Highlight: Link Apartments Vine
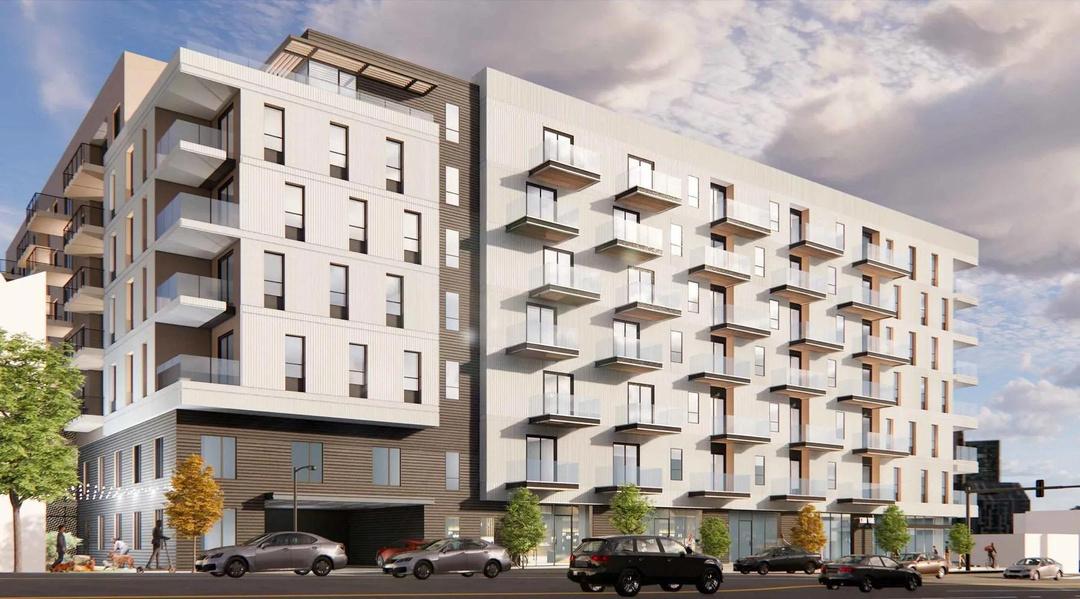

Address:1200VineSt.
Developer:GrubbProperties
Architect:KTGY
TotalSF:137,640SF
TheCityPlanningCommissionhasgivenitsapprovaltoanewmixed-useresidential housingdevelopmentknownasLinkApartmentsVine.Thisdevelopmentisaimedat providingaffordable,high-qualityhousingoptionstothemiddlemarket,specifically householdsthatearnmorethan60%ofanarea'smedianincome(AMI)butlessthan140% ofthatAMI.Theseworkingprofessionalsareoftenunabletoaffordluxuryhousingbutalso ineligibleforaffordableorworkforcehousing.Thedevelopmentwillutilizeinnovative financing,sustainableandefficientdesign,andstrategicsiteselectioninvibrant,wellconnectedareastoofferwhatisbeingcalled"essentialhousing"intheHollywoodarea.
0 1,000 2,000 3,000 4,000 Market Rate Affordable Market Rate Affordable Market Rate Affordable 50 13 HED
Market Rate (74.5%) Affordable ( 25.5%) Market Rate (87%) Affordable (13%) Market Rate (92%) Affordable (8%) Proposed Entitled Under Construction Market Rate vs. Affordable Units Planned or Under Construction 1,038 3,245 1,092 373 1,573 2,197 326 236 453 263 Gr. Hollywood 16 Source: The Hollywood Partnership
Visiting Hollywood
For decades, Hollywood has brought joy to so many through the magic of its bedrock roots in entertainment. The neighborhood's unique blend of creativity and commerce continues to offer one-of-a-kind experiences for both visitors and residents. While constantly on the cutting edge, Hollywood retains a timeless glamour that permeates our hotels, restaurants, and attractions. Those who visit Hollywood hail from nearby California cities and faraway countries, as this neighborhood's many hotels and entertainment destinations appeal to all walks of life.
36.5 Million Local/Domestic Visitors
2022
3.6 Hours Average Stay 2023
102.2 Million Local/Domestic Visitors 2022
6.7 Million Local/Domestic Visitors
2022
4.2 Hours Average Stay 2023
1 Hour
Average Stay 2023
In the last six months, the Hollywood Entertainment District has welcomed more than 19 million domestic visitors. Despite the ongoing recovery from the pandemic, the number of visits to the HED is steadily rising. However, it is still below the pre-pandemic annual average of 45.5 million visits.
Greater Hollywood HED Walk of Fame
17 Source: Placer.ai
VISITING CONTINUED
Visitor
Visitor Race + Ethnicity
5,000,000 4,000,000 3,000,000 2,000,000 1,000,000 0 2017 44.1M 2018 47.2M 2019 45.3M 2020 20.2M 2021 27.9M 2022 36.5M Jan-Jun 2023 19.1M HED Total Annual Visits HED Monthly Visits Over Time Jan Feb Mar Apr May Jun Jul Aug Sep Oct Nov Dec White 38% Latinx 38% Asian 13% Black 7%
Household Income <10K10K-15K15K-20K20K-25K25K-30K30K-35K35K-40K40K-45K45K-50K50K-60K60K-75K75K-100K100K-125K125K-150K150K-200K>200K 15% 10% 5% 0% $102,000 Average HH Income 18 Source: Placer.ai
Hotel Market Conditions
Over time, the average daily room rate for hotels in Hollywood has steadily increased and consistently remains higher than the citywide averages. The hotel occupancy rate in Hollywood saw a positive change in Q2 2023, with a 7% increase from the previous quarter and a 2.5% increase from the prior year.
80.6% Occupancy Rate +2.5% vs. Q2 2022 $252 ADR +6.6% vs. Q2 2022 $203 RevPAR +9.3% vs. Q2 2022 434.4K Supply +2.4% vs. Q2 2022 $88.4M Room Revenue +11.9% vs. Q2 2022 2008 2009 2010 2011 2012 2013 2014 2015 2016 2017 2018 2019 2020 2021 2022 2023 $ 250 $ 200 $ 150 $ 100 $ 50 $ 0 Hollywood Hotel Average Daily Room Rate (2008-2023) City of LA Gr. Hollywood 19 Source: LATCB, STR
HOTEL MARKET CONTINUED
Hollywood Hotel Market Over Time
Hotel Occupancy Rate Hollywood vs. City of LA 2010 2011 2012 2013 2014 2015 2016 2017 2018 2019 2020 2021 2022 2023 $200 $150 $100 $50 $0 Occupancy Rate RevPAR 100% 75% 50% 25% 0% Q12010Q22010Q32010Q42010Q12015Q22015Q32015Q42015Q12016Q22016Q32016Q42016Q12017Q22017Q32017Q42017Q12018Q22018Q32018Q42018Q12019Q22019Q32019Q42019Q12020Q22020Q32020Q42020Q12021Q22021Q32021Q42021Q12022Q22022Q32022Q42022Q12023Q22023 100% 75% 50% 25% 0% Gr. Hollywood City of LA 20 Source: LATCB, STR
Hollywood Hotel Development
In the Greater Hollywood area, there are currently 11 hotels either entitled or under construction, totaling around 1,724 rooms. Of these, 9 are located in the HED and include well-known establishments such as Citizen M, The Hyatt Hotel Nue, Level Hollywood, Whisky Hotel Hollywood, and Ivar Gardens. During Q2, there were a couple of noteworthy developments, including the unwrapping of the Whisky Hotel Hollywood project and the grand opening of the luxurious Palihotel Hollywood, situated at 7023 Sunset Blvd.
3
1,724 Total
4
1,380 Total
3
Projects Under Construction 8 Projects Entitled
Hotel Rooms Entitled or Under Construction
Projects Under Construction 7 Projects Entitled
2
Hotel Rooms Entitled or Under Construction
Hollywood + HED
Greater
Projects Proposed
Projects Proposed HED
21 Source: The Hollywood Partnership
Notable Hotel Projects
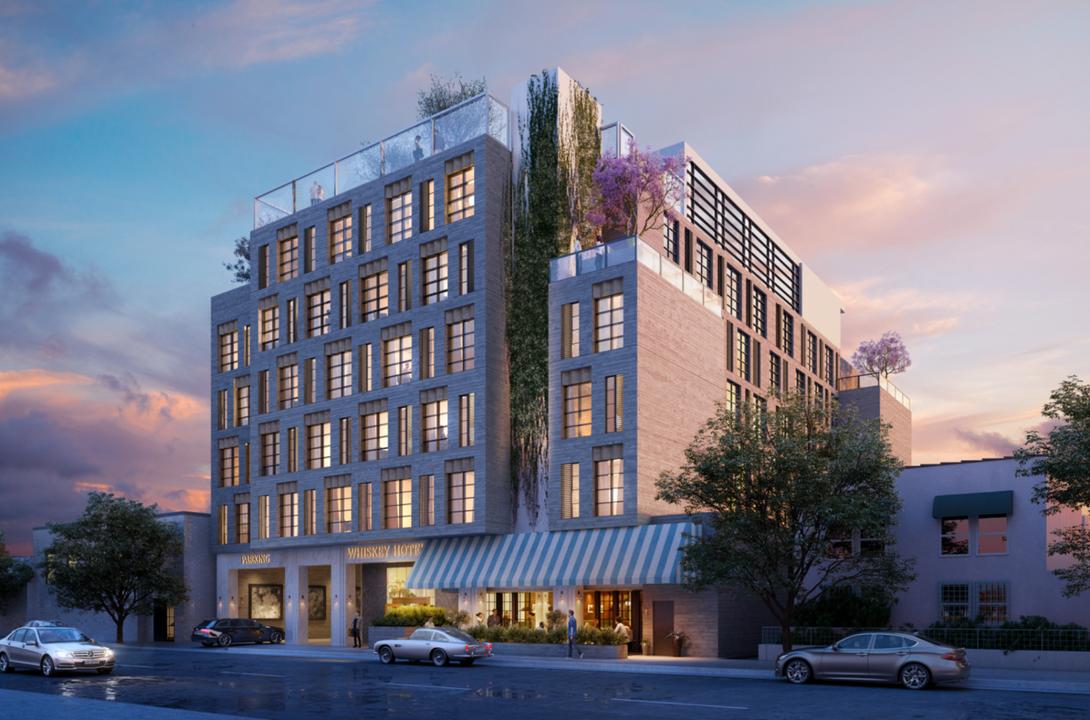
Development Highlight: WHISKY HOTEL UNWRAPS
Address:1717WilcoxAve.
Developer:AdolfoSuaya
Architect:RoschenVanCleveArchitects;ChristophKapellerofCKArchitecture
Total#ofRooms:134
TheWhiskyHotelHollywoodisnearingcompletion.Theseven-storyboutiquehotel developmentfeaturing134guestroomsand3,580squarefeetofground-floorretail, wasunwrappedinQ22023.Theproject,ownedbyrealestateinvestor/developer AdolfoSuaya,willprominentlyfeatureawhisky-themedbarandrestaurantinthe lobbyandarooftoploungecreatinga one-of-a-kindexperienceforwhisky enthusiasts.
Development Highlight: PALIHOTEL OPENS ON SUNSET

Address:7023SunsetBlvd.
Owner:Palisociety
Total#ofRooms:134
ThePalihotelHollywoodrecentlyopenedat7023SunsetBlvd.,juststepsfrom theHED.Thefullyremodeledhotelisamoderntakeonanoldmotorlodge propertyfromthe1950s.Ithastwofloorsand76rooms,alovelypoolinthe courtyard,andanalfrescodiningexperienceattheon-propertyrestaurant Benny'sontheBlvd.
22
Retail in Hollywood
The retail market is an important part of the vibrancy of Hollywood. The neighborhood has an inventory of 6.8 million SF of retail space with 3.3 million SF located in HED. Within the HED, there is approximately 469K SF of available retail space and an average asking rent of $4.68 PSF monthly. While both Hollywood and the HED have higher retail vacancy rates when compared to the City of LA's rate of 6.1%, their average rents PSF are higher than the citywide average of $43.00. Furthermore, as mixed-use development projects continue to spring up in Hollywood, they bring with them a significant future retail presence, with 487K SF entitled or under construction in Hollywood, and over 211K SF of that planned in the HED. 3.4
$44.09 Retail Rent PSF/ Annually
$47.89 Retail Rent PSF/Annually
$43.00 Retail Rent PSF/Annually
Retail Inventory (SF)
Retail Vacancy Rate
Retail Vacancy Rate
Retail Vacancy
Hollywood HED City of LA
Million Retail Inventory (SF)
Retail
(SF)
Million
8.6%
7.9%
6.1%
Rate Greater
6.8
100.6 Million
Inventory
23 Source: CoStar Group
RETAIL CONTINUED
Retail Vacancy Rates Over Time (2010-2023)
The Q2 2023 retail vacancy rate in the HED decreased slightly from Q1 to 8.6%. The Greater Hollywood rate is 7.9%. Mirroring Greater Hollywood’s trajectory, the HED’s retail vacancy rate rose between Q2 2020 to Q2 2021, decreased from Q3-Q4 2021, and then increased again from Q1 2022 to the Q1 2023.
HED Hollywood Blvd. Total # of Retail Businesses 650 265 Total # of Open Retail Businesses 476 185 Total # of Closed or Vacant Retail Businesses 174 80 Retail Occupancy Rate 73% 70% HED Ground Floor Retail Occupancy - Q1 2023 2010Q22010Q32010Q42011Q12011Q22011Q32011Q42012Q12012Q22012Q32012Q42013Q12013Q22013Q32013Q42014Q12014Q22014Q32014Q42015Q12015Q22015Q32015Q42016Q12016Q22016Q32016Q42017Q12017Q22017Q32017Q42018Q12018Q22018Q32018Q42019Q12019Q22019Q32019Q42020Q12020Q22020Q32020Q42021Q12021Q22021Q32021Q42022Q12022Q22022Q32022Q42023Q12023Q2 10% 7.5% 5% 2.5% 0%
HED Gr. Hollywood City of LA Float Cafe 1635 Vine St. The Prince Sports 6516 Hollywood Blvd. New York Chopped Cheese 1471 Tamarind Ave. Hart House - Gr. HWD 6800 Sunset Blvd. New HED Businesses - Q2 24 Source: CoStar Group, The Hollywood Partnership
Hollywood Retail Development
Mixed-use development is a golden standard in Hollywood. Right now, 58 projects proposed, entitled, or under construction include a retail component. In the HED, this equates to 212K new SF.
8 Projects Under Construction 21 Projects Entitled 486,799 Retail SF Entitled or Under Construction 4 Projects Under Construction 17 Projects Entitled 211,624 Retail SF Entitled or Under Construction Greater Hollywood + HED 29 Projects Proposed 12 Projects Proposed HED
25 Source: The Hollywood Partnership
Upcoming Development
The Hollywood Partnership tracks upcoming development regularly to keep you apprised of the latest projects planned or under construction in the HED and Greater Hollywood. Explore our Development Map, or check out our Development Matrix for a quick glimpse.
*The Hollywood Partnership tracks development projects that are proposed, fully entitled, and under construction. Information included here reflects the status of each project as of the current quarter, and The Hollywood Partnership makes no representations as to the likelihood of completion for any individual project in light of market conditions.
26
Clickthroughs vs. Time of Day Presentations are communication tools that can be used as demonstrations Click Here To Explore Our Development Map Higher Clickthroughsvs. TimeofDay Presentatons are communcaton tools that can be used as demonstrations Click Here To View Our Development Matrix
Higher
Here To View Our Virtual Economic Development Tour
Click
MARKET REPORT

TheHollywoodPartnership
6922HollywoodBlvd.,Ste.925
Hollywood,CA90028
323.463.6767
info@hollywoodpartnership.com
hollywoodpartnership.com
Second Quarter Performance, 2023