Highfields School
Issue 33: 5 June 2020
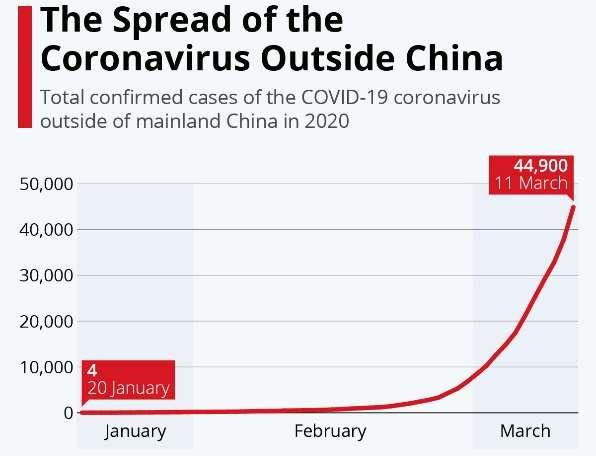
Newsletter Alternative activities to try during time at home Maths v Coronavirus Mrs Wragg As you are well aware, many diseases spread from one person to many and then to many more. Knowing how many people are at risk and how fast the disease spreads helps doctors to fight back. We have all witnessed this first hand with the Coronavirus outbreak, but were you aware just how much maths has helped in the fight against this virus? Here are a few examples. Tracking Disease If someone has Coronavirus they can pass the disease onto people nearby. On average, every person with the virus will infect a further 2-2.5 people. If each of these people then passes it on in the same way the disease can spread very quickly. This rapid spread is called exponential growth. We have been shown graphs every day monitoring this growth by scientists and mathematicians and have seen that the steeper the curve, the more the disease is spreading. As lockdown starts to release, scientists and mathematicians are monitoring these graphs very closely to check that they show that things are under control. Medical Maths Exponential growth has resulted in quick thinking by the Government. There have been many things to consider. Mathematicians have had to make predictions very quickly looking at patterns in how the virus has been spreading. How many hospital beds will be needed? Will there be enough medicines and PPE to cope? As a result the Government had to enforce lockdown to ensure that the country would be able to manage. The rules of lockdown were a result of careful planning by scientists and mathematicians. Who needs to be isolated? How long do they need to be isolated for? If people need to stay 2 metres apart, how many people are allowed in one space at a time? Remember, everything being done has been trying to flatten this exponential curve and ensure that the country can cope. So next time you see something on the TV or online about Coronavirus stop and think. Do I understand what the graphs show? How did they come up with that rule? The numbers are very big, but what actually do they represent? Stay safe and keep doing your maths, because it helps save lives!
Be the best you can
- 37 -