The Schlutz Report

Q4 2022 Boulder County
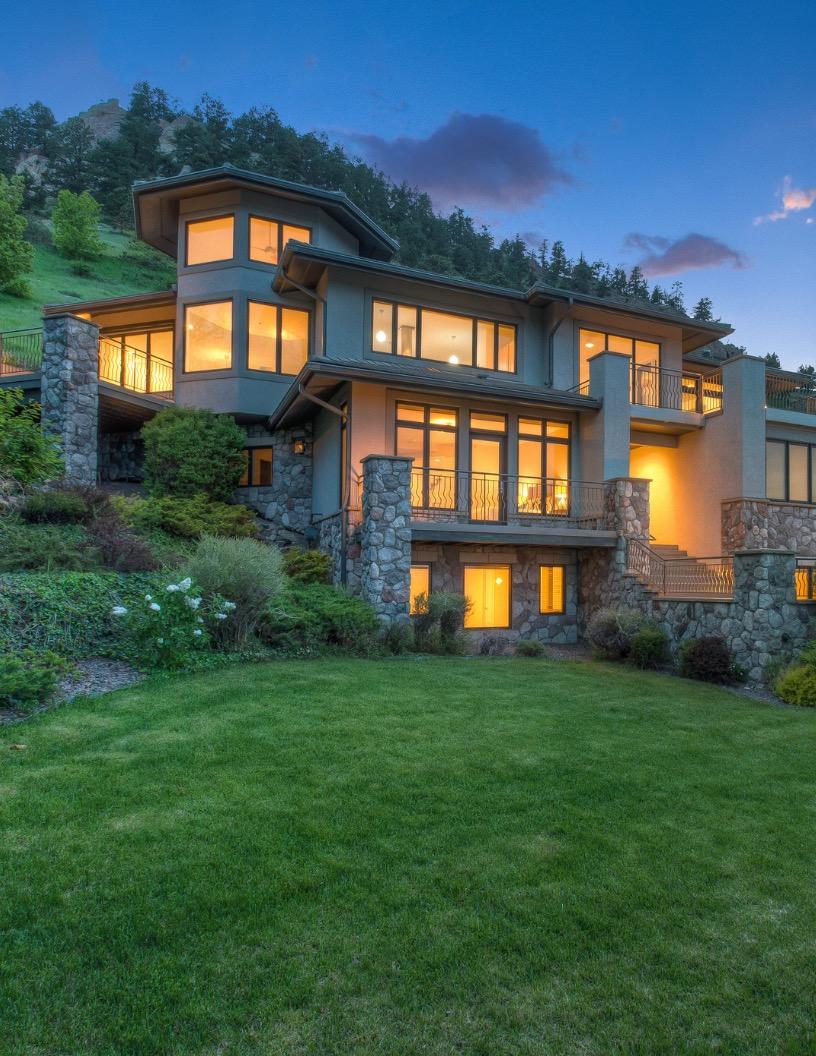
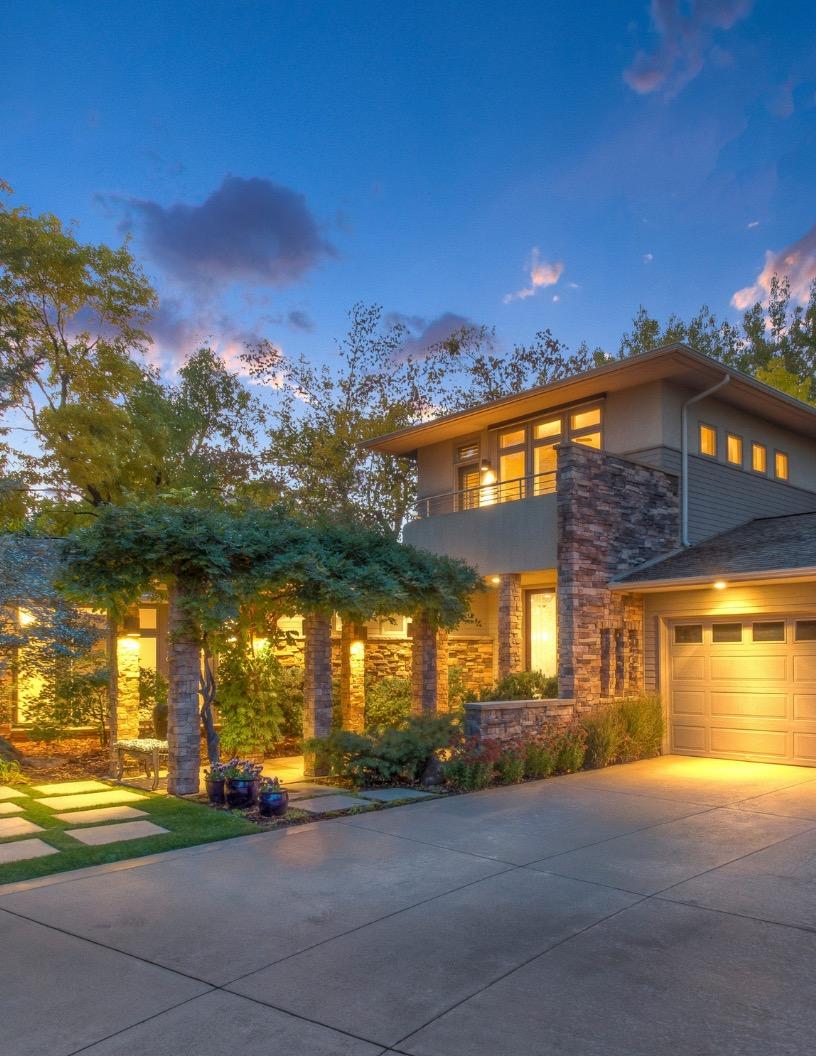
 Photographed Home: 178 Glendale Gulch Rd.
Listed by Dena and Logan Schlutz at Estate Professionals
Photographed Home: 178 Glendale Gulch Rd.
Listed by Dena and Logan Schlutz at Estate Professionals

Table of Contents
Single Family Homes: All Neighborhoods
Single Family Homes: South Boulder
Single Family Homes: Chautauqua
Single Family Homes: North Boulder
Single Family Homes: Niwot
Single Family Homes: Northwest Longmont
Single - Family Homes: Southwest Longmont
Townhomes and Condos: All Neighborhoods

Us
About
Introduction Letter
Closin g 4 5 6 10 12 14 16 18 20 22 2 7 Featured Property
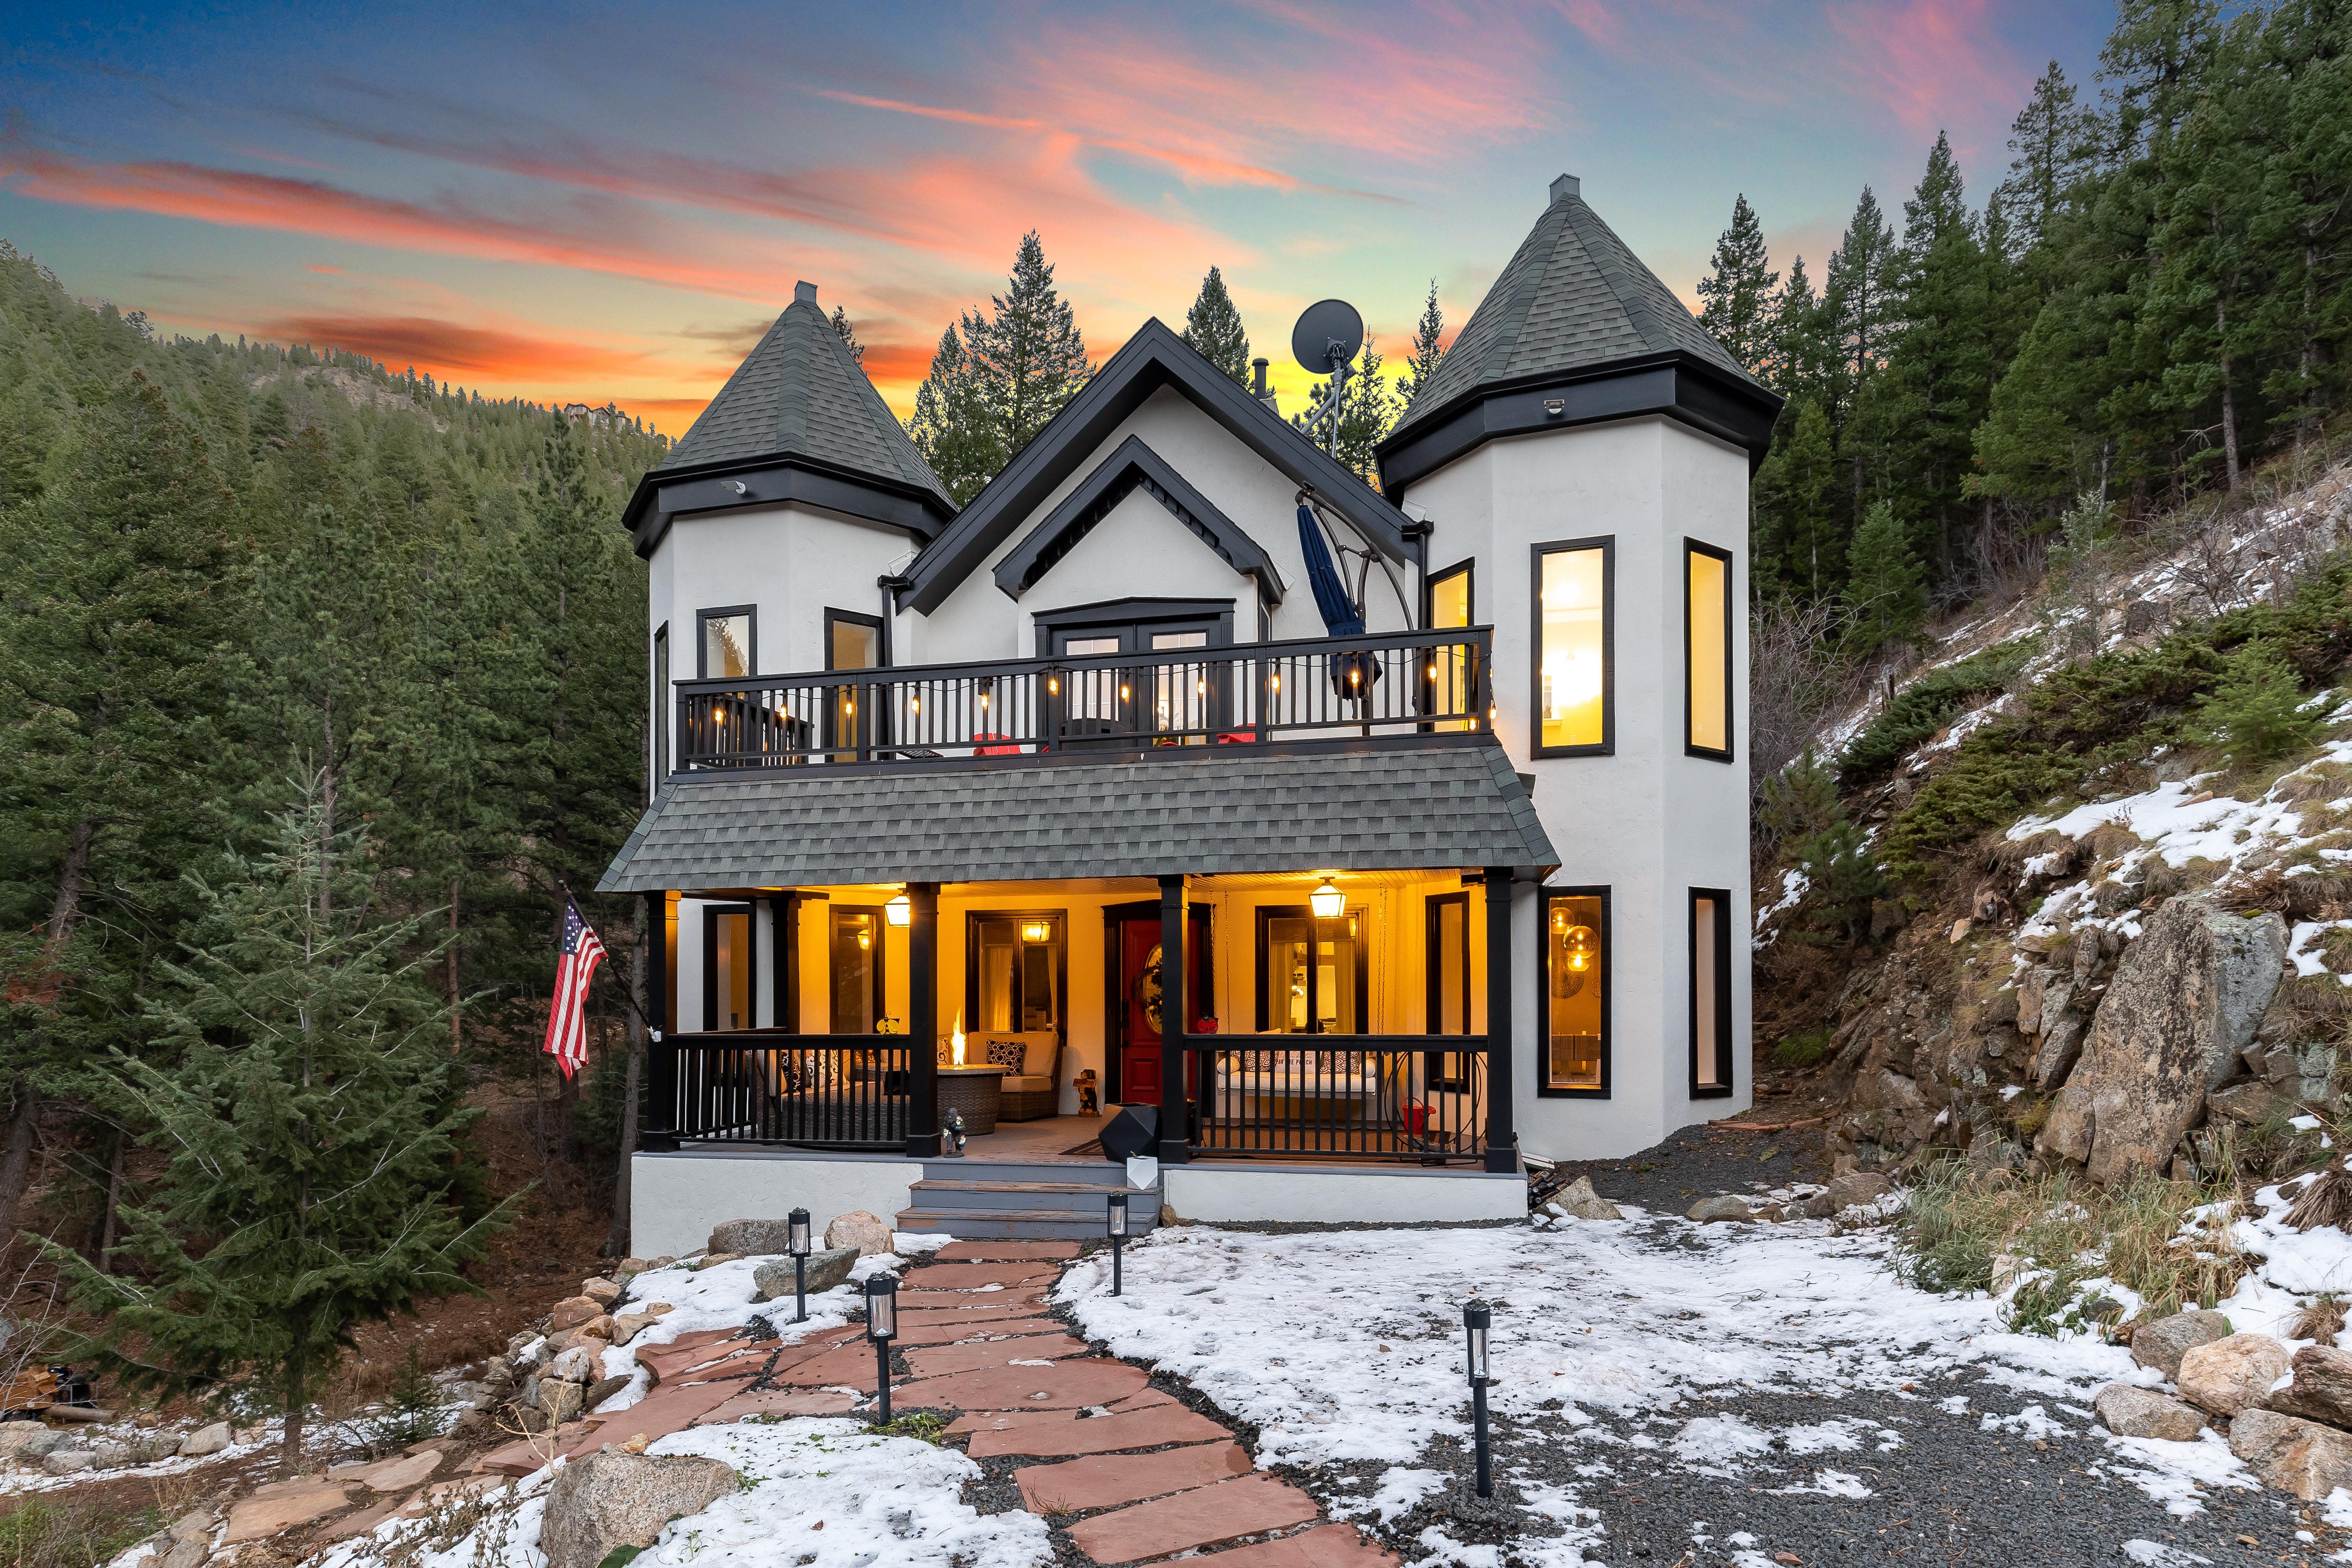
Glendale
Dr. | Live the authentic Colorado lifestyle in your sanctuary tucked away in the forest! The Schlutz Group | www.PROS.realtor | 3
178
Gulch
Logan Schlutz Associate Broker
720.734.8652
logan@pros.realtor
Dena Schlutz Managing Broker

720.734.8588
dena@pros.realtor
www.PROS.realtor
Dena Schlutz started Estate Professionals in 1996, when her mother-in-law, Hilda Schlutz, told her "if you're going to work that hard, work for yourself." Hilda was also a realtor in Longmont, Colorado. Two of Dena's children, Logan and Victoria Schlutz are also full-time realtors at Estate Professionals. With three generations of real estate experience, it's easy to say that real estate is in this family's blood. Both Logan and Dena have their own team of agents to assist them in providing bespoke white glove service, impeccable attention to detail, and world-class communication. If you're looking for local experts who not only know the area but also perform in the top 1% of Boulder County's agents, then you've found your brokerage. Contact Logan or Dena today to set up a consultation. They are available 7 days a week from 8 AM - 8 PM MST!

Scan Here!


Introduction Letter
Welcome to the Estate Professionals quarterly housing market report! On the macro level, you will find valuable information about the housing market for Boulder County for Single-Family Homes. We also take a deeper dive into the micro level by breaking down our data into certain areas of Boulder and Longmont. At the end of the report, you will find data on townhomes and condos in Boulder County. While there has been a drop in the housing market, Boulder County is still standing strong, and we are still in a seller’s market. Inventory is dropping, despite home sales being down, which will add more competition for buyers!
Dena Schlutz

Managing Broker
Estate Professionals
720.734.8588
dena@pros.realtor
Logan Schlutz Associate Broker


720.734.8652 logan@pros.realtor
John Hulen Marketing Director
The Schlutz Group | www.PROS.realtor | 5 Report Contributors
Estate Professionals
Single Family Homes
All Neighborhoods
Q4 2022: Single-Family Homes: Boulder County: All Neighborhoods
v Boulder County has seen some decline in the past year, but it’s a resilient market. We saw a drop in home prices, dollar volume, and closed sales, but the average price per square foot has slightly increased.
HIGH-INTEREST RATES ARE A LEADING CAUSE OF THE SLOWING MARKET.
Q4 2021 Q4 2022 % Change Average Price $1,041,331 $989,339 -2.5% Average $/ft2 $371 $374 +0.8% Dollar Volume $928,608,804 $561,944,276 -38% Closed Sales 916 568 -39.5%
* Property data from IRES and REcolorado (past three years only). Showings data from ShowingTime and IRES listing data only. Data deemed reliable, but not guaranteed. InfoSparks © 2023 ShowingTime The Schlutz Group | www.PROS.realtor | 7
Q4 2022: Single-Family Homes: Boulder County: All Neighborhoods
Months Supply of Inventory: This graph shows how long it would take for every home on the market to sell if no new homes are listed. An MOS of 1 means homes are selling almost immediately when they are listed. In December 2022, we saw the MOS decrease to 1.8, meaning that it would take just under 2 months for all existing homes on the market to sell.
Months of Supply
Average Days on Market: Homes take roughly 3 – 4 weeks to close from the time they go under contract. So, homes were on the market for about 2 – 3 weeks before going under contract in Q4, seeing a 42.1% increase YOY.
Average Days on Market
* Property data from IRES and REcolorado (past three years only). Showings data from ShowingTime and IRES listing data only. Data deemed reliable, but not guaranteed. InfoSparks © 2023 ShowingTime
74 60 50 58 71 67 58 53 62 73 63 53 42 43 44 51 44 30 33 40 35 25 33 40 48 54 0 10 20 30 40 50 60 70 80 90 Jan-18 Mar-18 May-18 Jul-18 Sep-18 Nov-18 Jan-19 Mar-19 May-19 Jul-19 Sep-19 Nov-19 Jan-20 Mar-20 May-20 Jul-20 Sep-20 Nov-20 Jan-21 Mar-21 May-21 Jul-21 Sep-21 Nov-21 Jan-22 Mar-22 May-22 Jul-22 Sep-22 Nov-22
Days
The Schlutz Group | www.PROS.realtor | 8 1.2 2 2.2 1.7 2.1 2.6 2.8 2.3 2 1.7 2.2 1.9 1.5 0.8 0.6 0.9 0.3 0.6 1.3 1.7 2.2 1.8 0 0.5 1 1.5 2 2.5 3 Jan-18 Mar-18 May-18 Jul-18 Sep-18 Nov-18 Jan-19 Mar-19 May-19 Jul-19 Sep-19 Nov-19 Jan-20 Mar-20 May-20 Jul-20 Sep-20 Nov-20 Jan-21 Mar-21 May-21 Jul-21 Sep-21 Nov-21 Jan-22 Mar-22 May-22 Jul-22 Sep-22 Nov-22 MOS
Q4 2022: Single-Family Homes: Boulder County: All Neighborhoods
Average Percent of Original List Price Vs Sold: This graph shows if homes were selling over or under the asking price. Q4 2022 saw a 6.6% decrease YOY.
Average % of List Price
Inventory of Homes: From the graph, Boulder County had a peak in inventory in Q4. This is a 164.3% increase YOY.
96.9 99.1 97.9 95.9 98.3 96.2 95.7 98.8 98.4 100.9 105.5 101.9 100.2 107.7 102.4 96.9 93.6 85 90 95 100 105 110 Jan-18 Mar-18 May-18 Jul-18 Sep-18 Nov-18 Jan-19 Mar-19 May-19 Jul-19 Sep-19 Nov-19 Jan-20 Mar-20 May-20 Jul-20 Sep-20 Nov-20 Jan-21 Mar-21 May-21 Jul-21 Sep-21 Nov-21 Jan-22 Mar-22 May-22 Jul-22 Sep-22 Nov-22 %
* Property data from IRES and REcolorado (past three years only). Showings data from ShowingTime and IRES listing data only. Data deemed reliable, but not guaranteed. InfoSparks © 2023 ShowingTime
The Schlutz Group | www.PROS.realtor | 9 368 401 555 615 443 587 773 671 511 654 433 274 198 319 254 112 276 497 590 458 0 100 200 300 400 500 600 700 800 900 Jan-18 Mar-18 May-18 Jul-18 Sep-18 Nov-18 Jan-19 Mar-19 May-19 Jul-19 Sep-19 Nov-19 Jan-20 Mar-20 May-20 Jul-20 Sep-20 Nov-20 Jan-21 Mar-21 May-21 Jul-21 Sep-21 Nov-21 Jan-22 Mar-22 May-22 Jul-22 Sep-22 Nov-22 # of Homes Inventory of Homes
South Boulder

Single-Family Homes
Q4 2022: Single-Family Homes: South Boulder
v South Boulder consists of the homes West of Foothills Parkway and South of Chautauqua Park. Neighborhoods include Martin Acres, Table Mesa, and Highland Park.
Q4 2021 Q4 2022 % Change Average Price $1,377,852 $1,199,710 -12.9% Average $/ft2 $545 $570 +4.6% Dollar Volume $64,759,052 $32,392,159 -50% Closed Sales 47 27 -42.6% Price Address Home Ft2 Approx. $/ft2 Days on Market $1,500,000 1465 Kendall Dr 1800 $833 32 $1,590,000 2210 Hillsdale Cir 2830 $562 49 $1,760,000 1571 Judson Dr 2676 $658 39 $1,887,500 3035 Galena Way 2094 $901 57 $1,950,000 2232 Holyoke Dr 3082 $633 82
Q4 Home sales in South Boulder
* Property data from IRES and REcolorado (past three years only). Showings data from ShowingTime and IRES listing data only. Data deemed reliable, but not guaranteed. InfoSparks © 2023 ShowingTime The Schlutz Group | www.PROS.realtor | 11
Chautauqua
Single-Family Homes
Q4 2022: Single-Family Homes: Chautauqua
v Chautauqua consists of homes West of Broadway and South of Aurora Avenue. Neighborhoods include Chautauqua, Lower Chautauqua, Flagstaff, and Interurban Park.
Q4 2021 Q4 2022 % Change Average Price $1,974,678 $2,447,208 +23.9% Average $/ft2 $685 $824 +20.3% Dollar Volume $23,696,141 $22,024,871 -7.1% Closed Sales 12 9 -25% Price Address Home Ft2 Approx. $/ft2 Days on Market $1,940,000 763 10th St 2651 $732 47 $2,620,871 780 Flagstaff Rd 3145 $833 144 $3,265,000 1575 Mariposa Ave 3938 $829 154 $4,000,000 707 8th St 4322 $925 48 $5,250,000 1480 Bellevue Dr 6285 $835 167 Q4 Home sales in Chautauqua
* Property data from IRES and REcolorado (past three years only). Showings data from ShowingTime and IRES listing data only. Data deemed reliable, but not guaranteed. InfoSparks © 2023 ShowingTime The Schlutz Group | www.PROS.realtor | 13
North Boulder
Single-Family Homes
Q4 2022: Single-Family Homes: North Boulder
v North Boulder consists of homes north of Iris Avenue and East of Diagonal Highway. Neighborhoods include Parkside, Melody Heights, Wonderland Heights, Rural North Boulder, Four Mill Creek, Orange Orchard, and North Broadway – Holiday.
Q4 2021 Q4 2022 % Change Average Price $1,949,405 $1,652,534 -15.9% Average $/ft2 $609 $501 -17.7% Dollar Volume $76,026,805 $57,838,700 -23.9% Closed Sales 39 35 -10.3% Price Address Home Ft2 Approx. $/ft2 Days on Market $2,400,000 3835 Norwood Ct 4698 $511 170 $2,460,000 1885 Quince Ave 4831 $509 64 $2,622,500 3560 16th St 3359 $781 105 $3,500,000 5344 2nd St 5039 $695 46 $6,500,000 2115 Linden Ave 5709 $1,139 17
Q4 Home sales in North Boulder
* Property data from IRES and REcolorado (past three years only). Showings data from ShowingTime and IRES listing data only. Data deemed reliable, but not guaranteed. InfoSparks © 2023 ShowingTime The Schlutz Group | www.PROS.realtor | 15
Niwot

Single-Family Homes
Q4 2022: Single-Family Homes: Niwot
v Niwot consists of homes east of Diagonal Highway and North of Mineral Road. Neighborhoods include Brittany Place, Cottonwood Hills, Johnson Farm, Niwot Hills, and Somerset.
Q4 2021 Q4 2022 % Change Average Price $1,284,071 $1,185,470 -7.7% Average $/ft2 $368 $371 +0.8% Dollar Volume $33,385,840 $16,596,580 -50.3% Closed Sales 26 14 -46.2% Price Address Home Ft2 Approx. $/ft2 Days on Market $890,000 8990 Niwot Rd 2100 $424 115 $925,000 7150 Christopher Ct 3205 $289 55 $1,075,100 7368 Dry Creek Rd 2716 $396 76 $1,280,000 6651 Secretariat Dr 4077 $314 42 $1,299,980 8861 Marathon Rd 3851 $338 146 Q4 Home sales in North Boulder
* Property data from IRES and REcolorado (past three years only). Showings data from ShowingTime and IRES listing data only. Data deemed reliable, but not guaranteed. InfoSparks © 2023 ShowingTime The Schlutz Group | www.PROS.realtor | 17

NW Single-Family Homes Longmont
Q4 2022: Single-Family Homes: Northwest Longmont
v Northwest Longmont consists of homes north of 9th Avenue and west of Hover Street. Neighborhoods include Champion Greens, Longmont Estates, Lake Shore, Lake Park Estates, and The Shores at Lake McIntosh.
Q4 2021 Q4 2022 % Change Average Price $549,210 $519,355 -5.4% Average $/ft2 $263 $278 +5.7% Dollar Volume $51,076,491 $32,199,991 -37% Closed Sales 93 62 -33.7% Price Address Home Ft2 Approx. $/ft2 Days on Market $725,000 23 Cornell Dr 3096 $234 32 $725,000 2075 Condor Ct 3440 $211 75 $740,000 2501 24th Ave 3102 $239 51 $815,000 2908 McIntosh Dr 3192 $255 42 $821,000 3555 Lakeshore Dr 3070 $267 45
Q4
Home sales in Northwest Longmont
* Property data from IRES and REcolorado (past three years only). Showings data from ShowingTime and IRES listing data only. Data deemed reliable, but not guaranteed. InfoSparks © 2023 ShowingTime The Schlutz Group | www.PROS.realtor | 19
S W Single-Family Homes Longmont
Q4 2022: Single-Family Homes: Southwest Longmont
v Southwest Longmont consists of homes south of 9th avenue and west of Hover Street. Neighborhoods include Clover Creek, Nelson Park, Renaissance, Somerset Meadows, Schlagle, and Meadowview.
Q4 2021 Q4 2022 % Change Average Price $764,226 $782,793 +2.4% Average $/ft2 $267 $275 +3% Dollar Volume $50,438,923 $33,660,114 -33.3% Closed Sales 66 43 -34.8% Price Address Home Ft2 Approx. $/ft2 Days on Market $930,000 2116 Lombardy St 3372 $276 47 $1,300,000 1641 Stones Peak Dr 5621 $231 28 $1,611,500 2300 Picadilly Cir 7276 $221 39 $1,800,000 2233 Sedgwick Ct 6755 $266 44 $2,300,000 8601 Portico Ln 7069 $325 49 Q4 Home sales in Southwest Longmont
* Property data from IRES and REcolorado (past three years only). Showings data from ShowingTime and IRES listing data only. Data deemed reliable, but not guaranteed. InfoSparks © 2023 ShowingTime The Schlutz Group | www.PROS.realtor | 21

Boulder County Condos
Townhomes
Q4 2022: Townhomes/Condos: Boulder County
The Months Supply of Inventory ended the year at 1.8%, meaning if no new homes came on the market, all existing homes would be sold in just under two months. There is a 220% increase YOY.
Months Supply of Inventory
Q4 2021 Q4 2022 % Change Average Price $533,026 $580,836 +9% Average $/ft2 $389 $400 +2.8% Dollar Volume $217,474,570 $152,759,811 -29.8% Closed Sales 408 263 -35.5%
1.3 1.8 2.2 2 2.5 2.9 2.3 1.7 2.2 2.6 2.2 1.11 0.9 1 0.7 0.4 1 1.7 2 0 0.5 1 1.5 2 2.5 3 3.5 Jan-18 Mar-18 May-18 Jul-18 Sep-18 Nov-18 Jan-19 Mar-19 May-19 Jul-19 Sep-19 Nov-19 Jan-20 Mar-20 May-20 Jul-20 Sep-20 Nov-20 Jan-21 Mar-21 May-21 Jul-21 Sep-21 Nov-21 Jan-22 Mar-22 May-22 Jul-22 Sep-22 Nov-22 MOS
* Property data from IRES and REcolorado (past three years only). Showings data from ShowingTime and IRES listing data only. Data deemed reliable, but not guaranteed. InfoSparks © 2023 ShowingTime
The Schlutz Group | www.PROS.realtor | 23
Q4 2022: Townhomes/Condos: Boulder County
Q4 had the highest number of condos/townhomes on the market since January 2021, peaking in October and coming down in December.
Inventory of Homes
This graph shows whether homes went under contract for over or under the asking price. We see a steady decrease since May 2022.
Average % of List Price
138 169 218 260 217 253 290 256 214 269 316 297 250 198 135 150 130 56 94 136 176 233 202 0 50 100 150 200 250 300 350 Jan-18 Mar-18 May-18 Jul-18 Sep-18 Nov-18 Jan-19 Mar-19 May-19 Jul-19 Sep-19 Nov-19 Jan-20 Mar-20 May-20 Jul-20 Sep-20 Nov-20 Jan-21 Mar-21 May-21 Jul-21 Sep-21 Nov-21 Jan-22 Mar-22 May-22 Jul-22 Sep-22 Nov-22 # of Homes
98.2 101.0 99.2 97.4 98.9 97.9 97.4 98.2 98.1 97.9 99.3 102.2 100.3 99.6 101.9 105.7 102.0 98.6 96.7 92.0 94.0 96.0 98.0 100.0 102.0 104.0 106.0 108.0 Jan-18 Mar-18 May-18 Jul-18 Sep-18 Nov-18 Jan-19 Mar-19 May-19 Jul-19 Sep-19 Nov-19 Jan-20 Mar-20 May-20 Jul-20 Sep-20 Nov-20 Jan-21 Mar-21 May-21 Jul-21 Sep-21 Nov-21 Jan-22 Mar-22 May-22 Jul-22 Sep-22 Nov-22 %
* Property data from IRES and REcolorado (past three years only). Showings data from ShowingTime and IRES listing data only. Data deemed reliable, but not guaranteed. InfoSparks © 2023 ShowingTime The Schlutz Group | www.PROS.realtor | 24
Q4 2022: Townhomes/Condos: Boulder County
Average Days on Market: Homes take roughly 3 – 4 weeks to close from the time they go under contract. So, homes were on the market for about 2 – 3 weeks before going under contract in Q4, seeing a 28.3% increase YOY.
Average Days on Market
New listings tend to follow seasonality. More homes are put on the market in the late Spring / early Summer, while fewer homes come on the market in the Winter. December 2022 saw a 25.51% decrease YOY.
* Property data from IRES and REcolorado (past three years only). Showings data from ShowingTime and IRES listing data only. Data deemed reliable, but not guaranteed. InfoSparks © 2023 ShowingTime
The Schlutz Group | www.PROS.realtor | 25
69 61 50 44 53 65 69 102 68 57 79 73 43 49 67 56 41 37 55 46 41 30 42 56 58 0 20 40 60 80 100 120 Jan-18 Mar-18 May-18 Jul-18 Sep-18 Nov-18 Jan-19 Mar-19 May-19 Jul-19 Sep-19 Nov-19 Jan-20 Mar-20 May-20 Jul-20 Sep-20 Nov-20 Jan-21 Mar-21 May-21 Jul-21 Sep-21 Nov-21 Jan-22 Mar-22 May-22 Jul-22 Sep-22 Nov-22 Days
125 191 122 75 165 220 171 52 171 116 226 170 65 298 435 516 578 514 382 263 354 497 586 493 323 231 0 100 200 300 400 500 600 700 Jan-18 Mar-18 May-18 Jul-18 Sep-18 Nov-18 Jan-19 Mar-19 May-19 Jul-19 Sep-19 Nov-19 Jan-20 Mar-20 May-20 Jul-20 Sep-20 Nov-20 Jan-21 Mar-21 May-21 Jul-21 Sep-21 Nov-21 Jan-22 Mar-22 May-22 Jul-22 Sep-22 Nov-22 # of Homes
New Listings
Thank you for taking the time to read our report. We hope that you found the information valuable and now have some more insight into the housing market in Boulder County. Although we won’t return to how the market was during the pandemic with unsustainable appreciation and extremely high competition, our market is still stable.
720.734.8652
logan@pros.realtor

In Closing 4450 ARAPAHOE AVE SUITE #78, BOULDER, CO 80303 PHONE 720 637 3312 © 2022 ESTATE PROFESSIONALS ALL MATERIAL PRESENTED HEREIN IS INTENDED FOR INFORMATION PURPOSES ONLY WHILE THIS INFORMATION IS BELIEVED TO BE CORRECT, IT IS REPRESENTED AS SUBJECT TO ERRORS, OMISSIONS, CHANGES, OR WITHDRAWAL WITHOUT NOTICE ALL PROPERTY INFORMATION, INCLUDING, BUT NOT LIMITED TO SQUARE FOOTAGE, ROOM COUNT, NUMBER OF BEDROOMS, AND THE SCHOOL DISTRICT IN PROPERTY LISTINGS SHOULD BE VERIFIED BY YOUR ATTORNEY, ARCHITECT, OR ZONING EXPERT EQUAL HOUSING OPPORTUNITY The Schlutz Group | www.PROS.realtor | 26
Managing Broker Estate Professionals
Dena Schlutz
Logan
Associate Broker Estate Professionals
720.734.8588 dena@pros.realtor
Schlutz
The Schlutz Group Estate Professionals