December 2021
Market Line - AUSTIN AUSTIN OVERVIEW Occupancy: Price: Rental Rate: Size:
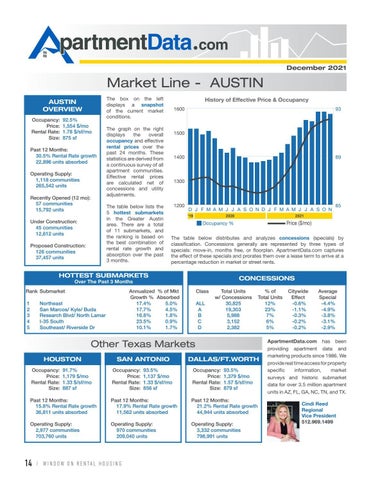
92.5% 1,554 $/mo 1.78 $/sf/mo 875 sf
Past 12 Months: 30.5% Rental Rate growth 22,896 units absorbed Operating Supply: 1,118 communities 265,542 units Recently Opened (12 mo): 57 communities 15,792 units
The box on the left displays a snapshot of the current market conditions.
Proposed Construction: 126 communities 37,457 units
93
1600
The graph on the right displays the overall occupancy and effective rental prices over the past 24 months. These statistics are derived from a continuous survey of all apartment communities. Effective rental prices are calculated net of concessions and utility adjustments. The table below lists the 5 hottest submarkets in the Greater Austin area. There are a total of 11 submarkets, and the ranking is based on the best combination of rental rate growth and absorption over the past 3 months.
Under Construction: 45 communities 12,612 units
History of Effective Price & Occupancy
1500
89
1400
1300
1200
D J F M A M J J A S O N D J F M A M J J A S O N ‘19
2020
The table below distributes and analyzes concessions (specials) by classification. Concessions generally are represented by three types of specials: move-in, months free, or floorplan. ApartmentData.com captures the effect of these specials and prorates them over a lease term to arrive at a percentage reduction in market or street rents.
CONCESSIONS
Over The Past 3 Months
1 2 3 4 5
Annualized % of Mkt Growth % Absorbed 17.4% 5.0% 17.7% 4.5% 16.8% 1.8% 23.5% 0.9% 10.1% 1.7%
Northeast San Marcos/ Kyle/ Buda Research Blvd/ North Lamar I-35 South Southeast/ Riverside Dr
2021
Price ($/mo)
Occupancy %
HOTTEST SUBMARKETS Rank Submarket
Class ALL A B C D
Total Units w/ Concessions 30,825 19,303 5,988 3,152 2,382
% of Total Units 12% 23% 7% 6% 5%
Other Texas Markets HOUSTON Occupancy: Price: Rental Rate: Size:
91.7% 1,179 $/mo 1.33 $/sf/mo 887 sf
SAN ANTONIO Occupancy: Price: Rental Rate: Size:
93.5% 1,137 $/mo 1.33 $/sf/mo 856 sf
DALLAS/FT.WORTH Occupancy: Price: Rental Rate: Size:
93.5% 1,379 $/mo 1.57 $/sf/mo 879 sf
Past 12 Months: 15.8% Rental Rate growth 36,811 units absorbed
Past 12 Months: 17.9% Rental Rate growth 11,562 units absorbed
Past 12 Months: 21.2% Rental Rate growth 44,944 units absorbed
Operating Supply: 2,977 communities 703,760 units
Operating Supply: 970 communities 209,040 units
Operating Supply: 3,332 communities 798,991 units
14
/ W I N D O W O N R E N TA L H O U S I N G
85
Citywide Effect -0.6% -1.1% -0.3% -0.2% -0.2%
Average Special -4.4% -4.9% -3.8% -3.1% -2.9%
ApartmentData.com has been providing apartment data and marketing products since 1986. We provide real time access for property specific information, market surveys and historic submarket data for over 3.5 million apartment units in AZ, FL, GA, NC, TN, and TX. Cindi Reed Regional Vice President 512.969.1499


