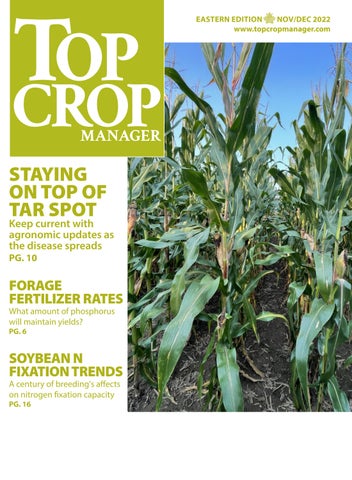
Keep current with agronomic updates as the disease spreads
PG. 10
FORAGE FERTILIZER RATES
What amount of phosphorus will maintain yields?
PG. 6
SOYBEAN N
FIXATION TRENDS
A century of breeding's affects on nitrogen fixation capacity
PG. 16
FOR FARMERS WHO BELIEVE IN BETTER.
ACCURACY TOOLS YIELD EQUIPMENT PERFORMANCE
PROFITABILITY SEED PLACEMENT FUTURE VISIBILITY
MANAGEMENT STEWARDSHIP CROP EMERGENCE
SEASONS RELATIONSHIPS SOIL HEALTH WATER USE
Believing in better is a mindset to pursue excellence in everything you do. It’s welcoming opportunities to improve your farm and knowing that your best season is simply a starting point for this season. Precision Planting is for farmers like you who Believe in Better.
6 | A fresh look at fertilizer rates for Ontario forages
What is the optimal amount of phosphorus to maintain yields?
By Carolyn King
10 | Staying on top of tar spot
As tar spot continues to spread in Ontario, keep checking for agronomic updates.
By Julienne Isaacs
Alex Barnard
16 | Nitrogen fixation trends in soybean
Has a century of breeding affected the nitrogen-fixation capacity of Ontario soybean varieties?
By Carolyn King
Donna Fleury
ON THE WEB
SEEDS CANADA ESTABLISHES PUBLIC VARIETIES DATABASE
Seeds Canada is creating a public database for farmers, members of the value chain and the public to identify which varieties were developed using gene editing. The database will be accessible through Seeds Canada’s website. It will not be a static list and will adapt as the industry’s needs evolve. TopCropManager.com
ALEX BARNARD EDITOR
FINDING WHAT FITS
Agricultural technology and innovation are occasionally discussed in monolithic terms – as though they are one, uniform thing. The sheer number and variety of different practices, tools, strategies and technologies encompassed in these terms are immense, and growing every year.
For many of the challenges facing the agriculture sector these days, there is (to borrow a phrase) an app for that. Agtech, field data analysis platforms, automation, robotics: there are a plethora of start-ups and companies stepping up to provide solutions.
However, the innovations provided aren’t always an answer to a current problem; sometimes, they’re a solution in search of a problem.
As discussed in this issue’s Shift section – focused on agricultural technology and innovation, found on page 12 – there can be miscommunications between research and development, extension, and growers. Each group has their own priorities and wants, and they don’t always overlap in neat, puzzle-piece ways.
This rift between what farmers need and what they are given by researchers or tech developers can create misunderstandings and frustration. When you only have one opportunity per year to get the job done right, there’s not a lot of room for trying out the new and untested for the sake of being cutting edge.
It’s much more complex and nuanced than saying yes or no to agtech innovation. As Amy Lemay, research fellow with Brock University’s Niagara Community Observatory, says, “There is a need to recognize that the benefits don't necessarily apply to all farms, because farms are highly diverse and tend to operate in less controllable environments.
“That some farmers choose not to adopt automation and robotic technologies should not be used as an indicator of their competitiveness. [The data] demonstrate that farmers are very open to adopting innovations that make sense for their operations and are a viable business decision, just not necessarily automation and robotics."
With innovation essentially a given in modern agriculture, it comes down to finding solutions that fit for you, if they exist, and not feeling pressured to try something for the sake of keeping up with the Joneses.
If you are interested in learning more about agtech – in general or a specific piece of tech or software – it’s worth reaching out to see if anyone else in your region or Canada more broadly has already used it and what they think.
Programs like the OMAFRA Ag Robotics Working Group, established in 2021 by OMAFRA’s Kristen Obeid, bring together industry, researchers, extension, growers and other stakeholders to evaluate current agtech in an Ontario context, and to determine what is needed in the future.
The options are out there if you’re willing to look, ask questions, and try something new – but there are risks, too. Just be sure they’re ones you can stomach.
Win the Start.
Start with Lumialza™ nematicide seed treatment, and your season bursts with potential.
Lumialza shields corn roots from harmful nematodes, providing over 80 days of powerful protection. It also cooperates with beneficial organisms and enhances plant vigour and yield potential by creating an optimal environment for root growth, crop development and uniformity. Win the start with Lumialza and deliver your best season yet.
A FRESH LOOK AT FERTILIZER RATES FOR ONTARIO FORAGES
What is the optimal amount of phosphorus to maintain yields?
by Carolyn King
Aproject is underway to update and improve information about fertilizer rates for Ontario forages, especially with regard to phosphorus-use efficiency. Improving nutrient-use efficiencies could help forage growers to sustain yields while reducing fertilizer inputs, and that makes sense economically and environmentally. The University of Guelph’s Kim Schneider is leading this project, which includes three studies that are looking at this issue from different angles.
Study 1: Fertility for 19 forage options
Study 1 is an applied field trial that aims to provide information on current forage options in terms of their quality and yields over time under some current fertilizer practices. The findings might also shed some new light on forage nutrient needs and perhaps point to possible opportunities for better nutrient-use efficiencies.
The trial was set up in 2019 by Christine O’Reilly, forage specialist with the Ontario Ministry of Agriculture, Food and Rural Affairs (OMAFRA), and Donna Hancock, forage technician at the University of Guelph. When Schneider started her new position as an assistant professor in forage and service crops in January 2020, she took on this study.
The field site is at the university’s Elora Research Station. Soil tests at the start of the trial showed the site was low in potassium (K) and a little low in phosphorus (P).
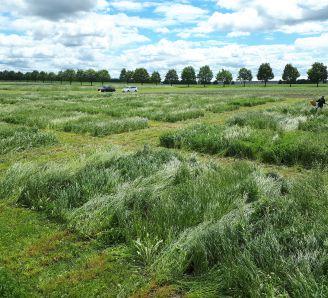
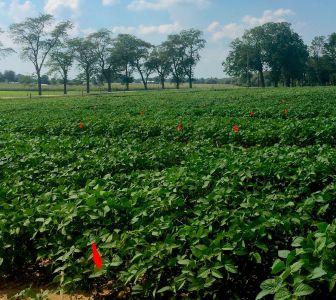
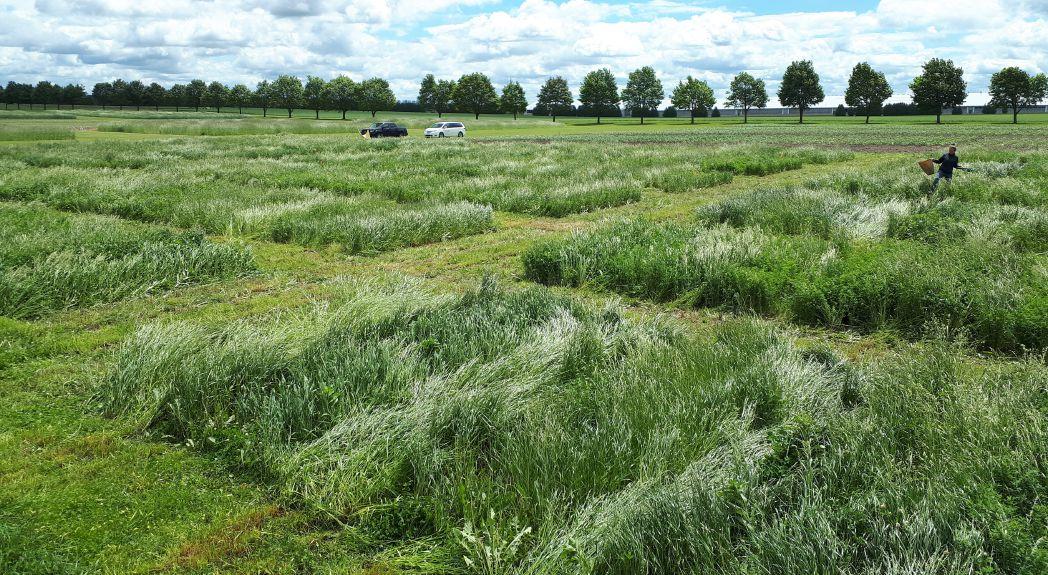
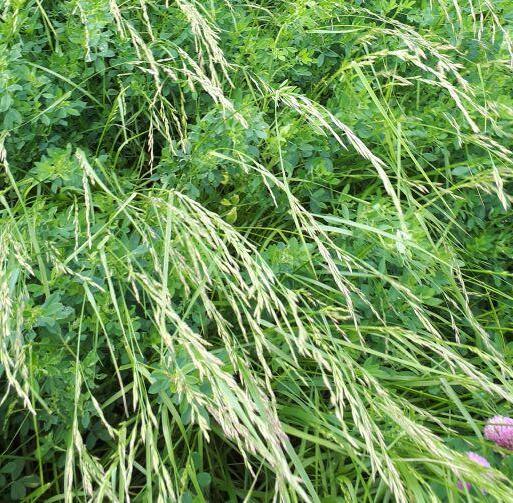
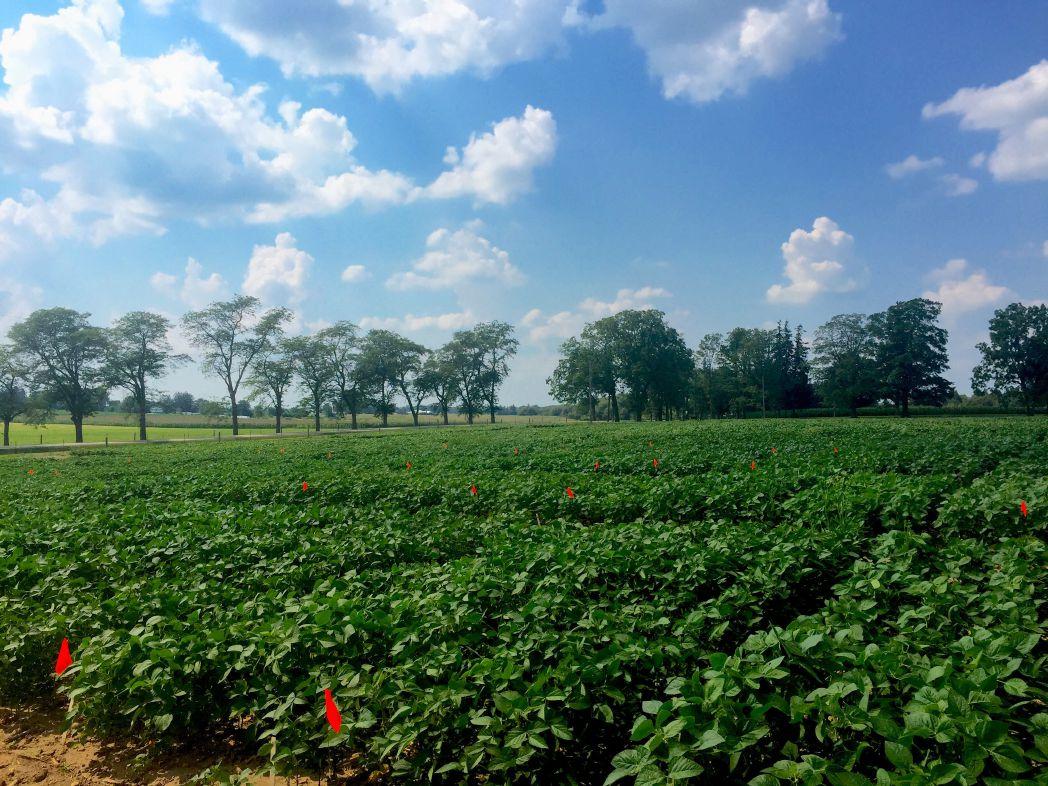
TOP: The Study 1 plots compared 19 forage species and mixtures and three fertilizer treatments.
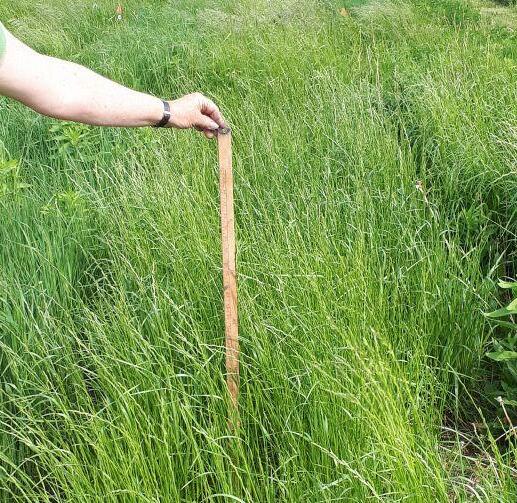
MIDDLE: Festulolium, a cross between a fescue and a ryegrass, is one of the new forage options that are part of Study 1.
The trial is comparing 19 different forage species or mixtures under three different fertilizer treatments, from 2020 to 2022.
The forage treatments encompass varieties and species available on the market in Ontario these days, including new choices like festuloliums (crosses between a fescue and a ryegrass). The plots range from legume monocultures and grass monocultures to various hay mixtures and a few pasture mixtures.
The fertility treatments are: 1) zero fertilizer as the control treatment; 2) 100 pounds per acre of triple-19 (19 per cent each of nitrogen (N), phosphorus (as P2O5), and potassium (as K2O)), applied each year; and 3) fertilize each year as needed, based on soil testing and OMAFRA’s forage fertility recommendations.
Schneider was interested in evaluating these treatments for several reasons. “We have some new mixtures of forage species on the market and some new varieties such as festuloliums. So, a lot has changed, but OMAFRA’s forage fertility recommendations have not been updated since the 1980s,” she explains.
“As well, the OMAFRA recommendations do not distinguish between hay and pasture. But hay producers obviously are removing more biomass and nutrients compared to pastures, where a lot of the nutrients come back in the manure. So, it would make sense that hay crops should receive more nutrient inputs than pasture.
“Also, Christine O’Reilly had some anecdotal evidence that many farmers are applying a very light application of nutrients, like 100 pounds per acre of a triple-19 fertilizer, to their hay and pasture,” Schneider adds. “I’ve chatted mostly with pasture managers, and some of them apply that type of light fertilizer application and some don’t apply fertilizer at all.”
Preliminary findings and tips
Schneider and her research group have finished collecting field data for Study 1. They have done some analysis of the data from 2020 and the first cut of 2021, and will complete the rest of the analysis in 2023.
The key finding so far is that the fertilize-as-needed treatment was clearly higher yielding than the other two treatments. “Those effects became more dramatic over the study’s three years. By 2022, it was very visually obvious that the control and the light application of nutrients had very low production.”
So, Schneider recommends that hay producers soil test about every two or three years to determine the field’s starting nutrient levels. Then they can consider making a fertilizer application based on the stand’s nutrient needs.
“For hay production, the study’s results are showing that, in general, following OMAFRA recommendations is reasonable,” she says. “Typically, grazing removes about 30 per cent of the nutrients. Hay removes a lot more, and alfalfa is a big user of potassium and also phosphorus. So if you’re not applying manure to hayfields, I definitely think fertilizer is important.”
Most of Study 1’s other initial findings are in line with the expected results. For example, timothy and meadow fescue had much higher forage quality, a little higher protein, and lower yields compared to the other grasses. Also, adding a legume to a grass stand reduced the stand’s N fertilizer needs and boosted forage quality and protein content.
Schneider is looking forward to seeing what the study’s final results show in terms of the changes in stand persistence and yields over the three years and the nutrient needs of the different forage options. She hopes to identify the most productive forages and the ones with greater nutrient-use efficiencies.
Study 2: P-use efficiencies and rates
“The second study’s objective is to see if forages can maintain their yields at less than the recommended phosphorus rate, and if so, does this vary by plant type, whether it is a grass or a legume, or by species,” Schneider says. The results could allow producers to reduce their P fertilizer applications while maintaining yields.
Schneider wanted to investigate this issue because of an intriguing finding in one of her previous studies, which examined soil test P levels and hay yields on organic and conventional dairy farms. “Interestingly, we found there was no real relationship between soil test P and forage yield, which went against conventional wisdom about fertility.”
Some of those hayfields had quite good yields even though they had very low soil test P levels. “Under 10 parts per million (ppm) would be considered low with the Olsen soil phosphorus test, which is the common P test we use in Ontario. Some of the hayfields had between about 3 and 7 ppm,” she notes.
She explains that the Olsen P test gives a reasonable indication of the amount of P immediately available to plants, but it has some limitations. “It gives a snapshot in time of one pool of phosphorus, and that pool is not static. There are mineral P pools and also organic P pools in the organic matter. So there is quite a bit more P in the soil than the
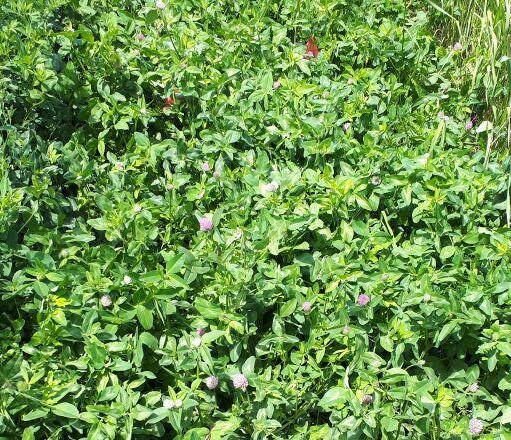
A Study 1 plot of red clover alone.
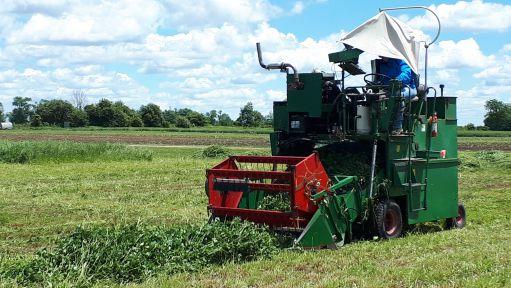
Hancock cutting red clover with a plot-scale forage harvester in Study 2, which is examining phosphorus-use efficiencies of different forage species and mixtures.
Olsen test would represent. And we don’t know how much plant-available P is being replenished and how quickly it is being replenished.”
So, Study 2 is a way to explore how some hayfields could have good yields despite low soil test P values. Schneider is particularly curious to see if legumes perform better than grasses when the soil test P is low.
“Legumes are known to have more relationships with mycorrhizal fungi than grasses,” she says, explaining that these soil fungi colonize a plant’s roots and then grow beyond the roots into the surrounding soil and gather nutrients, especially P, for the plant. “We also know the plants and these fungi form those relationships more when phosphorus is low. So, it might be good to have a low level of soil P to take advantage of this biological relationship, but not so low that the forage yield suffers.”
Study 2, which is being conducted at the Elora Research Station, was established in 2021. The first production year was 2022, and the fieldwork will continue for two more years.
Based on soil test P, the recommended P fertilizer rate at the site was 60 kilograms of P2O5 per hectare. The study’s fertility treatments are zero, 30, 60, 90 kilograms of P2O5 per hectare, applied each year.
The study’s 14 forage treatments include monocultures of alfalfa, red clover, orchard grass, timothy and tall fescue, and various mixtures of these common forage grasses and legumes.
Schneider and her group will track the forage yields under the different treatments. As well, depending on available personnel and funding, she hopes to look at how mycorrhizal colonization varies with different soil P levels and different forage types in the study’s third year.
Initial observations
“We haven’t analyzed the 2022 data yet but, visually, we did not see a big yield effect this year,” she says. This wasn’t a surprise to Schneider, given that the average soil test P at the site was 8.5 ppm, which is low but not extremely low.
“Sometimes there isn’t a yield response to phosphorus in one year because, even though the soil test P value might be a bit low, the plant can access enough P so that the plant is not deficient. Also, we may find some subtle differences this year that weren’t obvious visually. Over the three years, we will likely see more obvious differences.”
She adds, “Based on my research, I’m not always concerned the minute I see a low soil test phosphorus value in a hayfield or pasture. Perennial forages need a steady supply of phosphorus accessed over a longer growing season, unlike annual crops which need readily available phosphorus in a much shorter time frame.”
Compared to annual crops, perennial forages have more time to extend their roots and their mycorrhizal network further into the soil to find more P, and more time to access P that becomes available over the growing season.
Schneider’s tip for forage growers who are considering a P fertilizer application is to soil test for P, but also look at other factors. Those factors include: whether the stand shows signs of P deficiency, whether the field has a good potential for higher mycorrhizal fungi populations based on its cropping history, and what are the soil organic matter (SOM) levels, which will indicate potentially available organic P.
Study 3: P and soil organic matter levels
Schneider’s third study in this project is examining the effects of SOM on P recommendations. “Our hypothesis is that we might need less phosphorus to achieve the same yield when the soil has a high
soil organic matter concentration compared to when it is low.”
She thinks this hypothesis might be correct for a couple of reasons. “One is that organic matter helps the physical structure of the soil, so the roots can grow a little further and branch out a bit more. Another reason is that organic matter includes organic phosphorus –so, the more organic matter, the more organic phosphorus. And usually soils with more organic matter have more biological activity that can, over time, make more P available to plants, including organic P and some of the pools of less-available mineral P.”
Study 3 is a controlled environment pot trial that will start this winter. Schneider and her group plan to compare three different soil types collected from three locations. At each location, they want to collect two soils, both with low soil test P values, but one having high SOM and the other having low SOM. They are in the process of selecting the three locations. Interestingly, the low P/high SOM sites they have identified tend to be pastures, whereas the low P/low SOM sites tend to be annual crop fields.
Her group will be characterizing the selected soils in terms of SOM and other indicators of soil health. They plan to have one or two forage species in the trial and to apply five different P rates. They will be plotting forage yield versus P rate, and then seeing how these P response curves differ depending on the SOM level.
The results could help forage growers in their decision-making about P applications. “This study could also give us a better understanding of how soil health can impact P management,” she notes. “It might also show that it is helpful to have forages in a rotation with annual crops because the forages may provide increased organic matter, which might help nutrient-use efficiency.”
Schneider concludes, “Some people say, ‘Aren’t forages environmentally friendly anyway, with a lower risk of phosphorus loss?’ I think that is probably correct, compared to annual crops. But I think it is good for all sectors to try to increase phosphorus-use efficiency, for the water quality benefits and to reduce our reliance on mined resources.”
This project has received funding from OMAFRA (through the Ontario Agri-Food Innovation Alliance), the University of Guelph, and the Natural Sciences and Engineering Research Council of Canada.
A Study 2 plot of a tall fescue and alfalfa mix.
STAYING ON TOP OF TAR SPOT
As tar spot continues to spread in Ontario, keep checking for agronomic updates.
by Julienne Isaacs
Tar spot has been in Ontario since 2020 – not long at all, but long enough for a network of plant pathologists to get the word out about the disease and its effects on corn.
Caused by the fungus Phyllachora maydis, tar spot can be identified by raised black spots, spore-producing structures called stroma, on leaf tissue. The disease spreads via infected plant matter or wind-borne spores; it can overwinter on stubble.
Environmental conditions in 2021 were perfect for the disease in the United States and Ontario. “We saw more tar spot in 2021 than I expected,” says Albert Tenuta, field crop pathologist for the Ontario Ministry of Agriculture, Food and Rural Affairs (OMAFRA). “We saw it from Essex all the way to Wellington, Norfolk and Niagara. The southwest portion of the province had significant tar spot.”
The opposite was thankfully true in 2022: Tenuta says that, with the amount of inoculum going into the growing season, pathologists expected to see even more tar spot this year. But although tar spot was detected in many of the same regions as in 2021, environmental conditions were so different – hot and dry in June and July – that its impact will be minimal. That won’t always be the case. But Tenuta and his colleagues in Canada and across the border are developing a body of research to help producers mitigate the effects of tar spot.
This summer, they published the first results from a study conducted in 2021 across four states – Illinois, Indiana, Michigan and Wisconsin – and Ontario. The study evaluated a range of foliar fungicide products for their effectiveness against tar spot.
All nine products evaluated resulted in some level of protection against tar spot, versus an untreated check. But three products –Revytek (Mefentrifluconazole/Fluxapyroxad/Pyraclostrobin), Delaro Complete (Prothioconazole/Trifloxystrobin/Fluopyram) and Veltyma (Mefentrifluconazole/Pyraclostrobin) – resulted in significantly higher yields than the check.
“Our results are consistent with recently published data showing that, under low to moderate tar spot epidemics, fungicides can
significantly reduce tar spot severity and offer yield protection,” the authors of the study conclude.
At the time of writing, Delaro Complete and Veltyma are registered for tar spot control and Miravis Neo for tar spot suppression in Canada, but Tenuta encourages producers to always double-check which products are available with their local crop protection provider.
Application timing
Tenuta says the most important takeaway for producers is to be aware of the disease and its signs – as well as its regional spread.
“Scouting and being aware of tar spot from a regional perspective is critically important,” he says.
The Corn ipmPIPE website (corn.ipmpipe.org) hosts a real-time monitoring system on tar spot and other corn diseases.
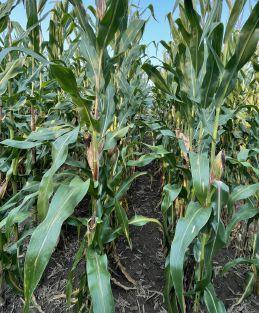
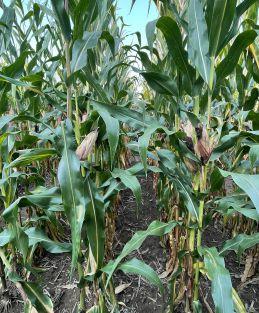
Last year, Tenuta’s research group focused on fungicide application timing for a range of fungal diseases, including tar spot. The group found fungicide applications between the tasseling (VT) and silking (R1) stages of corn development showed good efficacy against Gibberella ear rot (DON), northern corn leaf blight and tar spot. This year, Tenuta says they found, in some fields, tar spot could still become an issue three to four weeks after fungicide application.
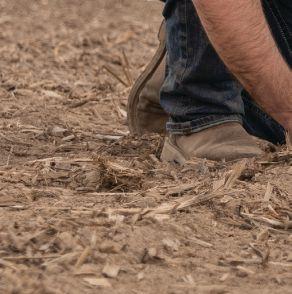
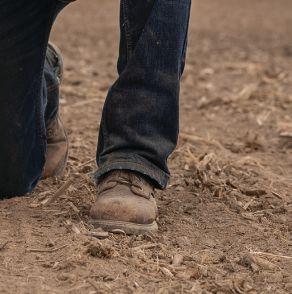
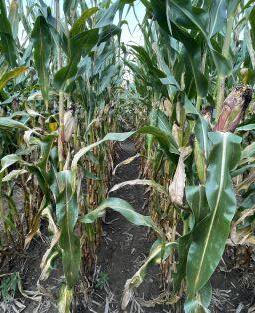
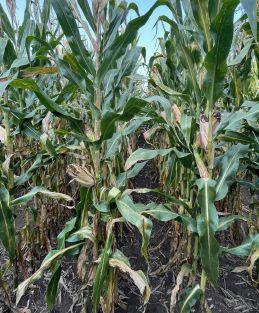
1: No fungicide applied (non-sprayed check).
2: Pre-tassel applications (7 to 12 leaf) did not reduce visual symptoms of tar spot compared to the non-sprayed check, and plants are prematurely shut down, which is expected since product wouldn’t be available when needed.
3: The VT/R1 application provided good control for those fungicides which have demonstrated good tar spot control, but some late tar spot is present.
4: VT/R1 fungicide application, with a second application at R3 (three weeks later). Applications at R3 (milk) and R4 (dough), alone or as a second application, show good control.
They’re currently evaluating whether a double fungicide application – at VT/R1 and later – pencils out for producers.
But Tenuta notes the VT/R1 application offers the most consistent and effective application timing for a range of diseases for Ontario corn producers. “When we look at other issues, such as Gibberella ear rot and DON, which we’re seeing more of in 2022 than we’ve seen in a couple of years, in certain areas that had more rainfall, it’s hard for corn farmers in Ontario to deviate from that VT/R1 [timing],” he says. “Ear moulds and DON have a significant impact not only on corn yields but corn marketing and distribution, as was seen in 2018. We need to consider our other issues, not just tar spot.”
Tenuta says the cross-border study highlights the power of collaboration in controlling the spread and management of plant diseases.
“Working on a regional tar spot management program has benefited us substantially,” he adds. “We are able to get information out to producers quickly, develop effective tar spot management strategies through research, as well as a better understanding of tar spot biology and factors which make it thrive.”
TAR SPOT RESOURCES
Producers have a range of resources at their disposal for tracking the spread of tar spot and scouting and managing the disease, says Albert Tenuta, OMAFRA field crop pathologist.
Field tours: Tenuta conducted several field tours in 2021 and 2022 to help farmers and consultants identify tar spot in the field. Contact Tenuta for information about upcoming events.
Crop Protection Network: The cross-border network offers tools and techniques to manage a range of diseases in the U.S. and Canada, including tar spot, at cropprotectionnetwork.org.
OMAFRA: The ministry website hosts a tar spot fact sheet and links to resources, including a tar spot reporting link.
Ontario Agricultural Conference: Updated information on tar spot trials will be presented at the 2023 event on Jan. 4-5.
SHIFT
Technology
insights for the progressive farm SHIFT SHIFT
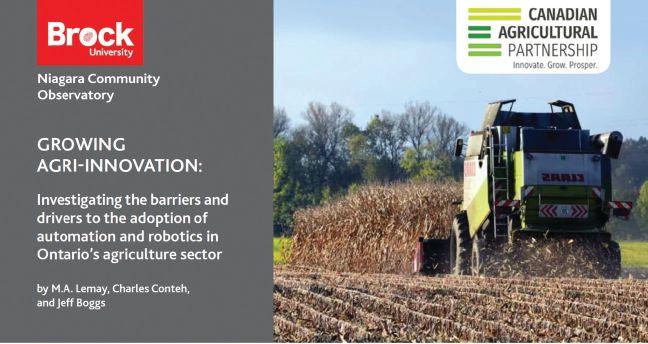
AGTECH ADOPTION A COMPLEX DECISION
Agriculture offers unique
opportunities – and poses unique challenges – to the development and adoption of agri-innovation.
BY DONNA FLEURY
The complexity of the agriculture industry and growing operational challenges across sectors are pressuring farmers to find new ways to improve competitiveness. The adoption of new technologies and innovations, such as automation and robotics, may be one opportunity. However, adopting these new tools goes beyond matching a problem to a solution. There are many factors that influence the competitiveness of production systems.
Researchers at Brock University’s Niagara Community Observatory (NCO) have set out to find out more about the opportunities and challenges associated with building competitive production systems, focusing on the issues farmers face particularly in the adoption of automation and robotics technology.
“Understanding the barriers and drivers of adoption for the agriculture industry is important for widespread investment and adoption of automation and robotics technologies," explains Amy Lemay, NCO research fellow and adjunct professor in the university’s Environmental Sustainability Research Centre.
"In this four-phase project, we are fo-
cused on all commodities in primary production in Ontario’s agriculture sector. With funding through the Ontario Ministry of Agriculture, Food and Rural Affairs and Canadian Agricultural Partnership, we want to determine how to inform future policy around technology adoption and the barriers and drivers to adoption.”
An online survey was distributed across Ontario between November 2020 and February 2021 in the first phase of the project. “In the survey, we were trying to get a snapshot of what automation and robotics technologies have been adopted by farmers, and in general what their experiences
were with adopting the technology, including challenges and barriers,” Lemay says.
“Recognizing that technology adoption is not just a yes-or-no question, but rather a process and a journey, we designed the survey for both farmers who have already adopted technology and those that have not. We followed the survey with semistructured interviews with 38 stakeholders located in the Niagara Region in July 2021 in phase two of the project.
“This geographic focus allowed us to look more closely at the social, economic and political factors to the development and adoption of automation and robotics
SHIFT SHIFT SHIFT
to better understand how stakeholders within an agri-food cluster interact. We interviewed farmers, automation and robotics researchers, technology solution developers and providers and intermediaries, including extension specialists, commodity organizations and other agriculture stakeholders, to find out their experiences or perceptions of technology adoption.”
The initial survey results from 171 Ontario respondents indicated that the overall level of adoption of automation and robotics technology was 39 per cent. This level of adoption is similar to that of other Canadian sectors recently surveyed, including manufacturers. Livestock producers were more likely to have adopted robotics and automation technology, with the highest adoption rate of 73 per cent by dairy farmers.
benefits don't necessarily apply to all farms, because farms are highly diverse and tend to operate in less controllable environments, frequently at the mercy of climatic and biological forces beyond their control,” she says.
“That some farmers choose not to adopt automation and robotic technologies should not be used as an indicator of their competitiveness. Both the survey and interviews demonstrate that farmers are very open to adopting innovations that make sense for their operations and are a viable business decision, just not necessarily automation and robotics."
A key decision factor for farmers is the importance of local, reliable access to service, parts and maintenance over the long term. Overwhelmingly, 80 per cent of adopters purchased the technology “off
I think tech developers have a tendency to fail to understand the realities of farming and the fact that farmers typically have one chance a year to produce their crops and generate their livelihood.
The top three reasons farmers adopted robotics and automation technology were increased productivity, increased production efficiency and reduced costs. The top three reasons given for not adopting technology were the high costs of acquisition, lack of relevant technology and insufficient return on investment.
"One of the important findings is the complex and nuanced set of underlying strategic calculations that inform farmers’ choices about the value of adopting automation and robotics technology," Lemay explains. "These findings challenge the broad stereotypes about farmers being 'slow adopters.' The analysis shows that farm competitiveness is not dependent on technology adoption such as automation and robotics alone, and for some operations adoption could actually reduce the competitiveness of the farm.
“There is a need to recognize that the
the shelf,” while about 18 per cent said the technology was both purchased and developed in-house. In addition, almost 70 per cent of adopters purchased off-the-shelf technology within 100 kilometres of the farm.
This factor strongly suggests that producers are acquiring proven technology that has been fully commercialized, scaled and is readily available through their local retail market. The most important criteria for technology selection was performance, followed by ease of use and then cost. Several interviewees pointed out that many automation and robotics technologies had yet to tangibly demonstrate promised benefits.
"One of the key takeaways from farmers interviewed is that technology developers tend to be great engineers with little connection to the agriculture sector, and often offer solutions in search of a problem," Lemay notes. "A recurring theme from farm-
ers is that a lot of technology being developed is just not ready for on the ground adoption.
“However, the stakeholder interviews also highlighted the perception [held by] tech developers and providers that farmers are risk-averse or non-innovative, which I found quite surprising. This perception came through very strongly; however, this is not the case, as farmers wouldn’t be farmers if they weren’t risk takers. The tech developers seem to expect that farmers should accept and adopt unvalidated technology, even if it's going to require significant adaptation of their production system.”
Lemay adds, “I think tech developers have a tendency to fail to understand the realities of farming and the fact that farmers typically have one chance a year to produce their crops and generate their livelihood. Tech developers are encouraged to engage with the farm community – whether that is through commodity organizations or individual farmers – to ensure what is being developed is suitable or will fit within a production system and make sure it solves a real problem on the farm.”
Farmers are also concerned about new robotics and automation technology coming from outside of Canada, which will require performance testing and validation within the commodity and production system in the province or region where it is being adopted. In addition, manufacturers often send international head office staff to install and commission the technology; once they leave, timely technical service and maintenance is difficult. Even in cases where there is a local supplier, farmers still face delays in obtaining parts or access to technical support and maintenance for imported equipment.
Farmers are also concerned that a lot of the new technology is coming from startups, who, unlike established dealers or multi-nationals, may not be around in five to 10 years to provide parts, support and maintenance. Given Canada’s small market, perhaps support for validation, adaptation and ground-truthing of imported technologies, and building local technical capacity, would be an effective approach for supporting adoption.
In all phases of this project so far, there is a recurring pattern of issues for farmers. Lemay notes that these themes are across
the board and not just in this region. A lot of technology sensors, automation and robotics technology generate massive volumes of data that are often on different platforms that are not compatible or harmonized. This lack of interoperability between different technology platforms makes it almost impossible to aggregate and compare the data.
Another key issue is understanding and analyzing all of this data, which developers suggest will help make better production decisions and improve productivity. However, it can be quite difficult to understand what the data is actually saying, let alone generate production decisions. Some farmers are resorting to hiring data specialists to help them analyze and try to utilize the data in their operations. Other issues related to data that were raised during the interviews include privacy, security and ownership.
“Overall, I think the information from all of the phases highlights a misalignment between expectations of agri-innovation adoption and the unique challenges agriculture poses to development and adoption,” Lemay emphasizes. “We are finding that the expectations of how long it takes to adopt and implement new technology may not be realistic, which we think may contribute to the perception that farmers are slow adopters and risk-averse.
“It is worth noting this perception that farmers are risk-averse may be a significant barrier to adoption. To address this barrier, there could be a stronger role for more demonstration farms and sites to work with tech developers to test and validate their technologies, rather than expecting farmers to hold all the risk without any compensation.”
She adds, “While not all farmers are adopting and using automation and robotics, many of them are doing other very innovative things and are adopting innovations that are viable for their operation. Therefore, another recommendation may be to find strategies to support development and adoption of innovation more generically, to allow all farmers to choose the innovations that make the most sense for their farms."
Lemay and her team are now working on the analysis from all phases of the project and expect to have a final report available early in the new year. This includes a series of interviews with tech developers and pro -
viders who had partnered with the federal Global Innovation Clusters, including Protein Industries Canada, Digital Technology, NGen Advanced Manufacturing and Scale AI. Interviews in this phase were conducted with 25 participants to provide a more national perspective on new robotics and automation technology. The results will be presented in a policy brief this fall.
The final phase of the project was a se -
ries of focus groups held in May 2022 with agriculture stakeholders to recommend potential solutions for addressing the barriers to adoption that were identified through the first three phases of the project. The final report will provide outcomes and policy recommendations to inform future policy around the barriers and drivers to adoption of robotics and automation and building competitive production systems.
Peace of mind is possible with AgExpert. Simple, secure software for the farm that connects your field data to your finances, accurately. Knowing what’s in the fields, and in the books, can help you have more success and less stress. Start for free or upgrade to premium.
NITROGEN FIXATION TRENDS IN SOYBEAN
Has a century of breeding affected the nitrogen-fixation capacity of Ontario soybean varieties?
by Carolyn King
With high nitrogen (N) fertilizer prices and increasing environmental pressures to reduce N fertilizer use, crops that fix their own N have the potential to become even more important in our world. N fixation in legumes is a key research interest of Malinda Thilakarathna; some of his recent research results could help soybean breeding programs to improve N fixation in this crop.
“One of the fascinating features of soybeans is their ability to fix nitrogen through their symbiotic association with bacteria called rhizobia,” explains Thilakarathna, who is an assistant professor in plant-microbial interactions at the University of Alberta. “The plants produce structures called root nodules on their roots. The rhizobia living inside the root nodules fix atmospheric nitrogen. This nitrogen is converted into ammonium and then supplied to the plants to meet the plants’ nitrogen demands.”
N fixation across 100 years
A few years ago, when he was a postdoctoral researcher with Manish
Raizada’s research group at the University of Guelph, Thilakarathna undertook a study to look at trends in N-fixation capacity of Ontario soybean varieties released from 1913 to 2015.
Although soybean is a relatively new crop in some parts of Canada, he notes that it has a fairly long history in southern Ontario, where it was introduced in 1881. Since then, Canadian public and private breeders have been helping to make soybean into the highly successful crop it is today.
According to Thilakarathna, modern public soybean breeding programs in Canada, like the breeding program at the University of Guelph, typically focus on traits like yield, seed oil content and quality, disease resistance, days to maturity, and lodging, and do not directly select for N-fixation capacity.
Nevertheless, N fixation is important to Ontario soybean production. “Ontario farmers usually do not apply nitrogen fertilizer
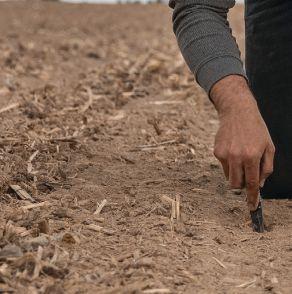
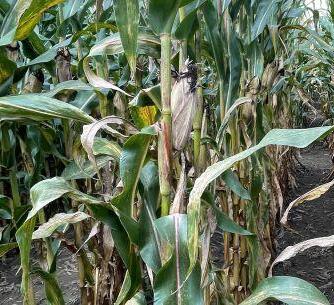
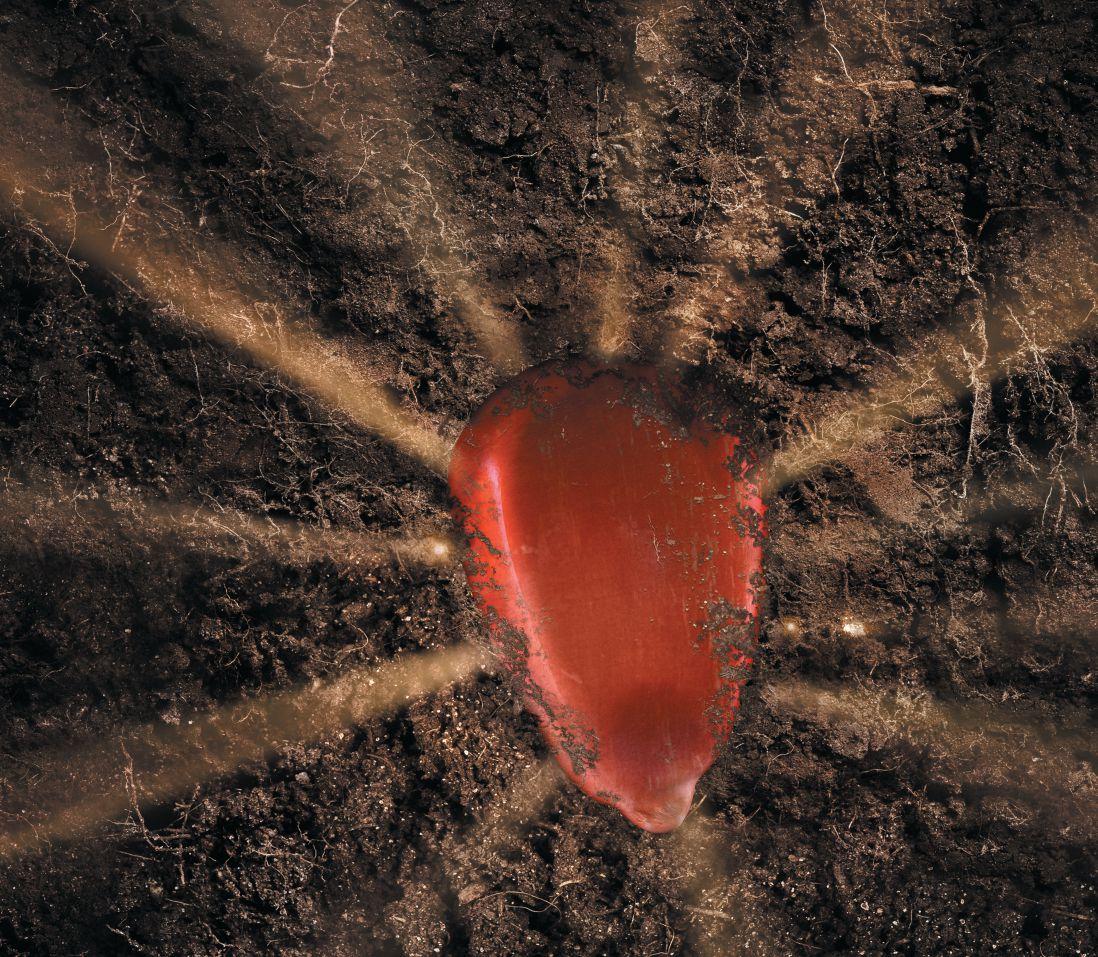
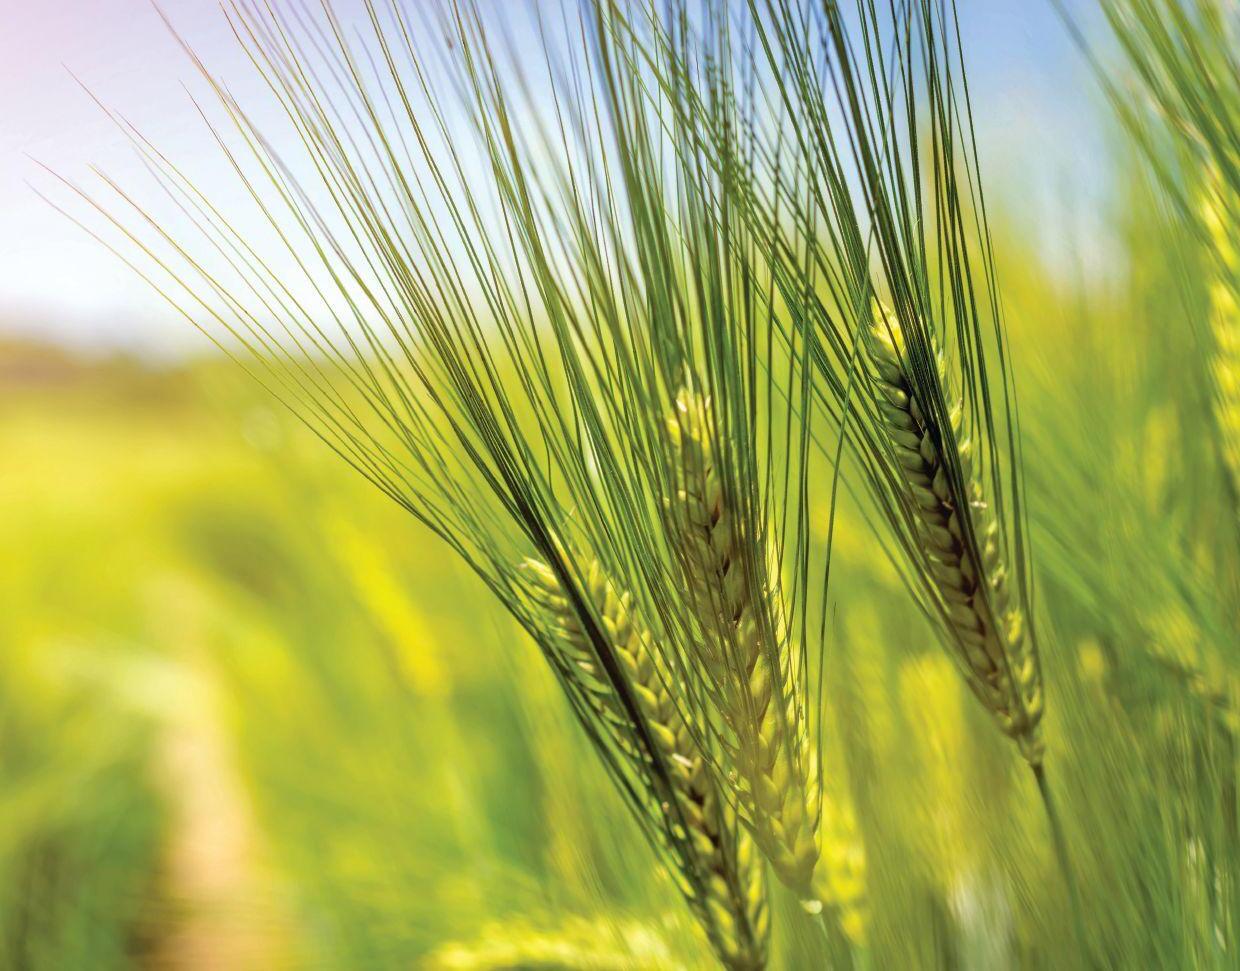
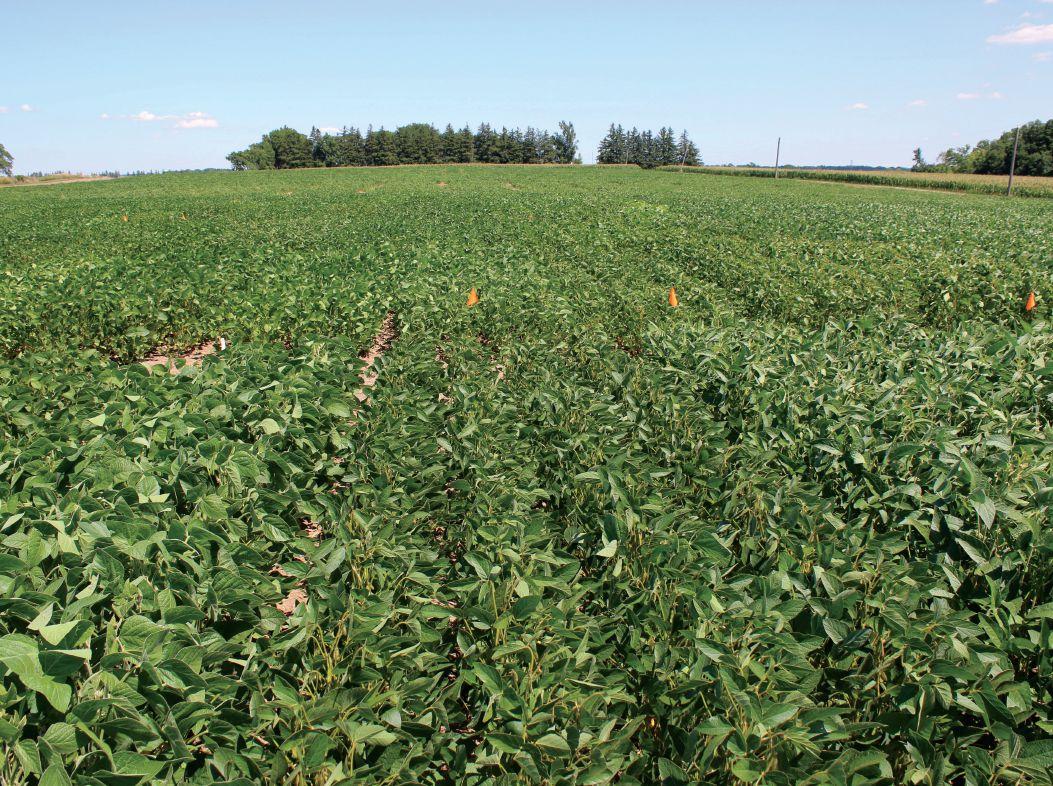
TOP: The study examined trends in nitrogen-fixation capacity of Ontario soybean varieties released from 1913 to 2015.
to their soybeans. They rely on nitrogen fixation to supply much of the plant’s nitrogen needs, with the rest of the nitrogen coming from residual nitrogen in the soil,” he says. “However, soybean nitrogenfixation capacity really varies depending on which variety is grown [as well as other factors].”
Reflecting Ontario soybean production practices, the Guelph breeding program is conducted without N fertilizer applications. So Thilakarathna wondered whether or not selecting breeding materials for high yields under these no-fertilizer conditions has resulted in indirect selection for good N-fixation capacity.
“We conducted this study to test if this breeding approach over the years has changed the nitrogen-fixation capacity in modern varieties.”
Thilakarathna’s study was a collaborative effort with Raizada, Istvan Rajcan and his Guelph breeding program, and Krzysztof Szczyglowski at Agriculture and Agri-Food Canada.
“The soybean cultivars that we selected for our study were chosen from a huge field trial led by Dr. Rajcan. His trial involved over 100 different soybean varieties and looked at yield and several other parameters,” Thilakarathna says. “We selected 19 historical cultivars, released between 1913 and 1985, and 25 modern cultivars from the Guelph breeding program, released between 1983 and 2015.”
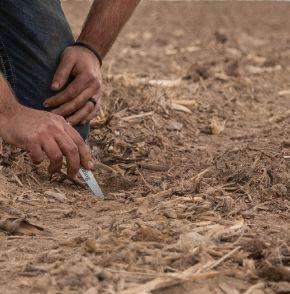
The fieldwork for Thilakarathna’s study was conducted at the University of Guelph’s Woodstock Research Station in 2016 and 2017. The sampling took place during flowering-pod initiation (R1 to R3 growth stages).
“In soybean, close to 60 per cent of the seed nitrogen comes from the remobilization of the nitrogen reserves in the vegetative plant parts. And we think that nitrogen fixation, even during the early growth stag-
es, also plays an important role in yield and protein production. Typically, nitrogen fixation rapidly increases during the R1 to R3 growth stages, and then peaks during pod-fill, R4 to R5,” he explains.
“For practical reasons, we chose to sample at R1 to R3. If we had waited until R4 to R5, the root system would have been really large, making it very difficult to uproot the entire plant. We needed the whole root system to make sure we got all the roots and nodules for our measurements.”
The study team collected data on the number of nodules, nodule dry weight, root dry weight and shoot dry weight. The shoot materials were analyzed using isotope-based methods to determine the proportion of N derived from the atmosphere in each variety, which is a measure of the variety’s N-fixation capacity. Then, the varieties were ranked based on their N-fixation capacity averaged over the two years.
Highlights of findings
“We found that, in general, across the two years, pre-pod-fill nitrogenfixation capacity in the modern soybean varieties was either similar to or moderately higher than the historical varieties. So, we think there may be some indirect selection pressure to improve nitrogen fixation in modern soybean varieties,” Thilakarathna says.
The team also found significant differences in N fixation among all the varieties. Some historical varieties had high N fixation and some had low N fixation, as was also the case for the modern varieties.
22_002995_Top_Crop_Eastern_NOV_CN Mod: September 16, 2022 9:52 AM Print: 09/23/22 page 1 v2.5
On average over the study’s two years, the variety with the lowest N-fixation capacity had 30 per cent of its plant nitrogen from N fixation, and the variety with the highest capacity had 68 per cent of its plant nitrogen from N fixation.
These findings indicate that breeding programs could make greater improvements in nitrogen fixation in soybeans if this trait becomes a higher priority for stakeholders. “Soybean breeders could use the varieties we identified with high nitrogen-fixation capacity as parental lines for crossing in future breeding programs focusing on nitrogen fixation,” Thilakarathna adds.
Several funding agencies contributed towards this research. Thilakarathna’s postdoctoral position was supported by the Canadian International Food Security Research Fund, jointly funded by the International Development Research Centre and Global Affairs Canada, as well as by the Natural Sciences and Engineering Research Council of Canada (NSERC). Rajcan’s soybean variety field trials were supported by a Collaborative Research and Development grant from NSERC.
More research coming
These days, N fixation is one of the main research areas for Thilakarathna and his research group at his Plant-Microbe Lab at the University of Alberta.
For example, his first graduate student looked at N fixation in different soybean varieties grown under drought stress, which is another factor that affects N-fixation capacity in soybeans.
“For this study, we collaborated with Dr. François Belzile and Dr. Davoud Torkamaneh from Université Laval,” Thilakarathna says. “We received a diversity of short-season varieties from Dr. Belzile, and we evaluated 103 of these for nitrogen fixation under drought conditions because drought is becoming a major problem, especially in Western Canada.”
They identified some varieties that performed well under drought conditions, with high N fixation and high yields. As well, Thilakarathna notes, “We have found some interesting QTLs for nitrogen fixation, which will probably in the future contribute to soybean breeding programs focusing on nitrogen fixation.” QTLs, or quantitative trait loci, are locations along an organism’s genome that are associated with a particular trait. QTLs help in identifying genes controlling a trait and in developing DNA markers that breeders can use to quickly identify which plants carry those genes.
Thilakarathna and his group are also interested in below-ground N transfer from soybean to associated non-legumes within intercropping systems.
“Some legume crops release amino acids and other nitrogen compounds from their root system. This released nitrogen can be absorbed by the neighbouring non-legume plants in an intercropping situation. In this scenario, there may be potential to meet part of the nitrogen requirement of the non-legume crops, especially from soybean. We are planning to do some trials to examine that.”
He adds, “I think nitrogen fixation is a very timely, needed research priority because of the high fertilizer prices and concerns about the negative environmental impact associated with nitrogen fertilizer. Nitrogen fertilizer production requires a lot of energy, which is mainly supplied through burning fossil fuels, resulting in significant greenhouse gas emissions. As well, nitrogen fertilizer applications can contribute to nitrate leaching and possibly greenhouse gas emissions like nitrous oxide.” Improvements in nitrogenfixation capacity in soybeans and other legumes could help towards a more sustainable future.
Modern public soybean breeding programs in Canada have typically focused on traits other than N-fixation capacity.
You’ve always done what’s right for you — for your farm and for your soybeans. At UPL, we respect that independent spirit and want you to know we’ll be there for you when you need smart, innovative solutions that make sense for your operation. Talk to your UPL rep or retailer to learn more or visit uplcanadaeast.ca to see our entire soybean portfolio.