The August

Page 43

THE AUGUST OFFERING MEMORANDUM

CONTENTS

LEAD AGENTS

Jordan Dickman

First Vice President Investments

Cincinnati Office

D. 513.878.7735

jordan.dickman@marcusmillichap.com

Nick Andrews

First Vice President Investments

Cincinnati Office

D. 513.878.7741

nicholas.andrews@marcusmillichap.com

Austin Sum

Senior Associate

Cincinnati Office

D. 513.878.7747

austin.sum@marcusmillichap.com

“OUR COMMITMENT IS TO HELP OUR CLIENTS CREATE

AND PRESERVE WEALTH BY PROVIDING THEM WITH

THE BEST REAL ESTATE INVESTMENT SALES, FINANCING, RESEARCH AND ADVISORY SERVICES AVAILABLE.”

NON-ENDORSEMENT & DISCLAIMER NOTICE

CONFIDENTIALITY DISCLAIMER

THIS IS A BROKER PRICE OPINION OR COMPARATIVE MARKET ANALYSIS OF VALUE AND SHOULD NOT BE CONSIDERED AN APPRAISAL. This information has been secured from sources we believe to be reliable, but we make no representations or warranties, express or implied, as to the accuracy of the information. References to square footage or age are approximate. Buyer must verify the information and bears all risk for any inaccuracies.

NON-ENDORSEMENT NOTICE

Marcus & Millichap is not affiliated with, sponsored by, or endorsed by any commercial tenant or lessee identified in this marketing package. The presence of any corporation’s logo or name is not intended to indicate or imply affiliation with, or sponsorship or endorsement by, said corporation of Marcus & Millichap, its affiliates or subsidiaries, or any agent, product, service, or commercial listing of Marcus & Millichap, and is solely included for the purpose of providing tenant lessee information about this listing to prospective customers.

01 - THE INVESTMENT 02 - RENT COMPARABLES 03 - FINANCIALS 04 - LOCAL MARKET SECTIONS
CALABASAS, CALIFORNIA | HQ 2,500 | EMPLOYEES 80+ | OFFICES

UNRIVALED SUCCESS IN THE MIDWEST

YOUR TEAM

JORDAN DICKMAN

FIRST VICE PRESIDENTS DIRECTOR, NMHG

NICK ANDREWS

FIRST VICE PRESIDENTS DIRECTOR, NMHG

AUSTIN SUM

SENIOR INVESTMENT ASSOCIATE

JD SCHMERGE INVESTMENT ASSOCIATE

BRIAN JOHNSTON INVESTMENT ASSOCIATE

TIM VANWINGERDEN INVESTMENT ASSOCIATE

AUSTIN Hall INVESTMENT ASSOCIATE

ALDEN SIMMIS INVESTMENT ASSOCIATE

BROKER SUPPORT

SAM PETROSNIO

VALUATION & RESEARCH

CORPORATE SUPPORT

LIZ POPP

MIDWEST OPERATIONS MANAGER

JOSH CARUANA

VICE PRESIDENT

REGIONAL MANAGER

INDIANAPOLIS | CINCINNATI | LOUISVILLE | ST LOUIS | KANSAS CITY

JOHN SEBREE

SENIOR VICE PRESIDENT

NATIONAL DIRECTOR

NATIONAL MULTI HOUSING GROUP

MICHAEL GLASS

SENIOR VICE PRESIDENT

MIDWEST DIVISION MANAGER

NATIONAL DIRECTOR, MANUFACTURED HOME COMMUNITIES GROUP

SKLYER WILSON

CLIENT RELATIONS MANAGER

BRITTANY CAMPBELL-KOCH

DIRECTOR OF OPERATIONS

ALEX PAPA

MARKETING COORDINATOR

THE INVESTMENT

01

PROPERTY DETAILS

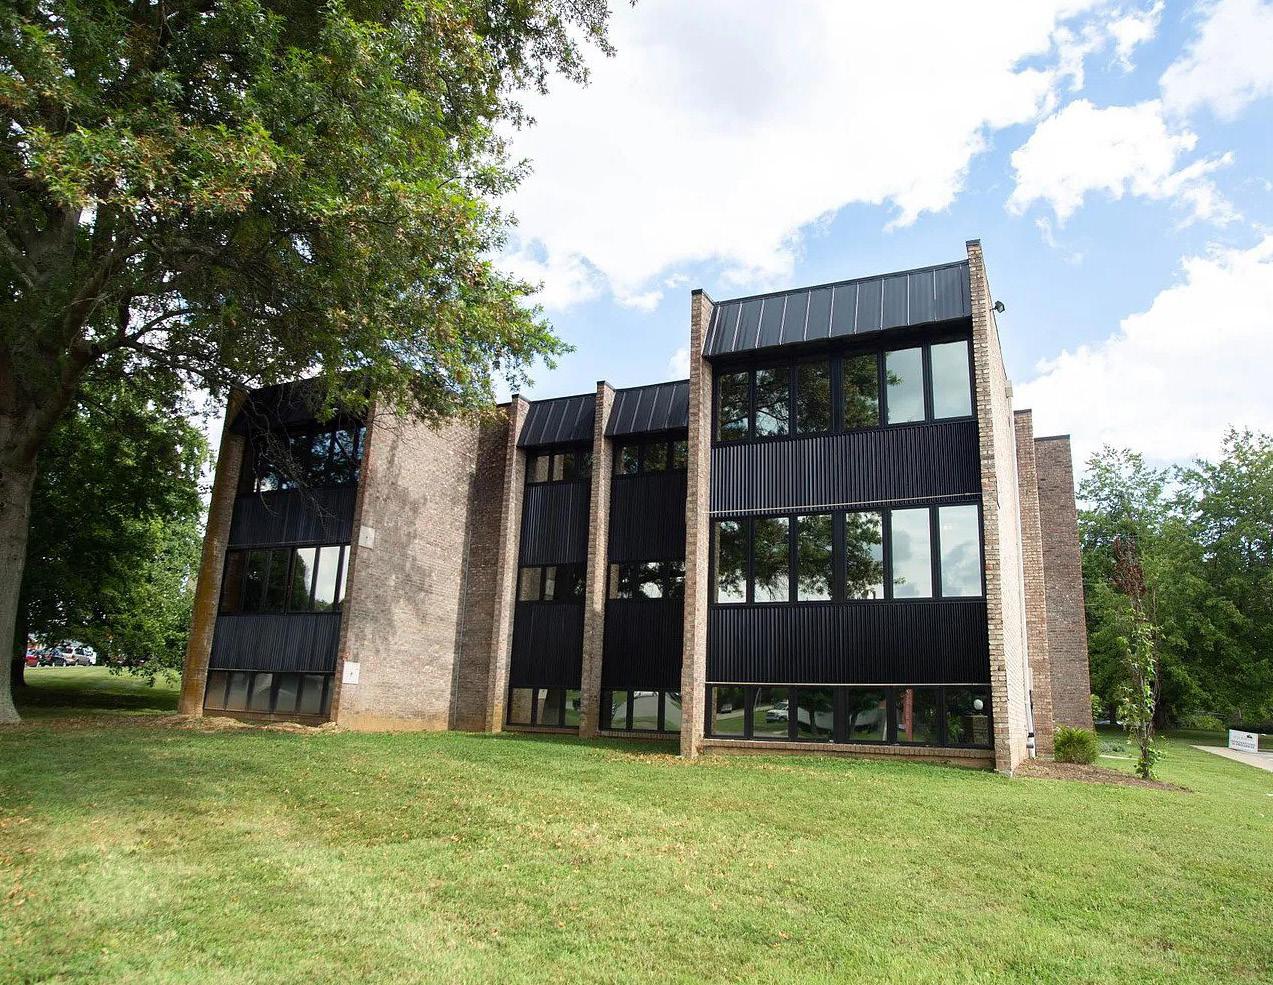
Property Address: 4070 Victoria Way

City, State, Zip: Lexington, KY 40515

Submarket: Outer South

County: Fayette

Year Built: 1977

Number Of Units: 120

Avg Unit Size: 714

Rentable Sqft: 85,680

Number of Parcels: 1

Lot Size (Acres): 7

Density: 17.14

# of Buildings: 10

# of Stories: 3

Current Occupancy: 92.00%

Parking Type: Grade Level

Foundation: Masonry

Exterior Building: Brick / Aluminum

Roofs Flat

UTILITIES

Electric: Tenant Paid

Gas: Owner Paid

Water / Sewer Owner Paid

Trash: Owner Paid

THE AUGUST
THE AUGUST *
(18
5.5 MILES
MINS)

THE AUGUST

PHOTOS

RENT COMPARABLES

02

LOCAL COMPETITORS

Bedroom
ONE
One Bedroom Property Year Built # Units Avg SF Avg Rent Avg Rent/SF Bridle Creek 2002 384 800 $1,123 $1.40 The Henry at Fritz Farm 2016 306 678 $1,100 $1.62 Shillito Park 1991 216 800 $1,062 $1.33 The Callaway 1978 136 737 $933 $1.27 Spring House 1986 223 825 $925 $1.12 MAA Mansion 1989 184 608 $883 $1.45 Subject Pro Forma 1977 120 500 $815 $1.63 Subject Average Effective 1977 120 500 $747 $1.49 Saddle Run Townhouses 1981 193 667 $658 $0.99

LOCAL COMPETITORS

TWO BEDROOM
Bedroom Property Year Built # Units Avg SF Avg Rent Avg Rent/SF The Henry at Fritz Farm 2016 306 938 $1,400 $1.49 Bridle Creek 2002 384 1000 $1,341 $1.34 Shillito Park 1991 216 1125 $1,230 $1.09 MAA Mansion 1989 184 900 $1,078 $1.20 The Callaway 1978 136 911 $1,061 $1.16 Subject Pro Forma 1977 120 740 $985 $1.33 Spring House 1986 223 900 $960 $1.07 Subject Average Effective 1977 120 740 $836 $1.13 Saddle Run Townhouses 1981 193 1043 $753 $0.72
Two

LOCAL COMPETITORS

BEDROOM
Three
Three Bedroom Property Year Built # Units Avg SF Avg Rent Avg Rent/SF The Henry at Fritz Farm 2016 306 1452 $2,300 $1.58 Bridle Creek 2002 384 1218 $1,435 $1.18 Subject Pro Forma 1977 120 970 $1,150 $1.19 Subject Average Effective 1977 120 970 $948 $0.98
UNITS 216 YEAR BUILT 1991 OCCUPANCY 95.8% UNIT MIX UNITS SQFT RENT RENT/SF One Bedroom 96 800 $1,062 $1.33 Two Bedroom 120 1125 $1,230 $1.09 Apartment Interior Amenities Private Balcony/Patio Washer/Dryer Hookups Fireplaces Common Area Amenities Fitness Center Community Room Volleyball Court Playground Swimming Pool Laundry Facilities Utilities Responsibility Resident Pays Electricity Property Pays Sewer Property Pays Trash Removal Property Pays Water
RENT COMPETITORS SHILLITO PARK APARTMENTS

RENT COMPETITORS

spring house Units 223 Year Built 1986 Occupancy 97.3% UNIT MIX UNITS SQFT RENT RENT/SF One Bedroom 96 825 $925 $1.12 Two Bedroom 127 900 $960 $1.07 Apartment Interior Amenities Washer/Dryer In All Units Fireplaces Available In Select Units Private Balcony/Patio Common Area Amenities Fitness Center Business Center Community Room Tennis Court Volleyball Court Swimming Pool Utilities Responsibility Resident Pays Electricity Property Pays Sewer Property Pays Trash Removal Property Pays Water

RENT COMPETITORS

henry at fritz farm

UNITS 306 YEAR BUILT 2016 OCCUPANCY 99.7% UNIT MIX UNITS SQFT RENT RENT/SF One Bedroom 136 678 $1,100 $1.62 Two Bedroom 158 938 $1,400 $1.49 Three Bedroom 12 1452 $2,300 $1.56 Apartment Interior Amenities Private Balcony/Patio Washer/Dryer In All Units Above Standard Ceiling Height Microwave Ovens In All Units High Speed Internet Access Common Area Amenities Controlled Access Fitness Center Business Center Clubhouse Swimming Pool Utilities Responsibility Resident Pays Electricity Resident Pays Sewer Resident Pays Trash Removal Resident Pays Water

RENT COMPETITORS

Units 48 Year Built 1972 Occupancy 99.8% UNIT MIX UNITS SQFT RENT RENT/SF One Bedroom 65 737 $933 $1.27 Two Bedroom 71 911 $1,061 $1.16 Apartment Interior Amenities Private Balcony/Patio Washer/Dryer Hookups Available In Select Units High Speed Internet Access Common Area Amenities Swimming Pool Laundry Facilities Utilities Responsibility Resident Pays Electricity Property Pays Sewer Property Pays Trash Removal Property Pays Water
the callaway

THE AUGUST

03

THE AUGUST FINANCIALS

UNIT MIX SUMMARY

UNIT DISTRIBUTION UNIT RENTS

AVERAGE EFFECTIVE MARKET PROJECTED UNIT TYPE NO. OF UNITS RENTABLE SF TOTAL SF RENT/UNIT RENT/SF TOTAL RENT POTENTIAL RENT/UNIT RENT/SF TOTAL RENT POTENTIAL RENT/UNIT RENT/SF TOTAL RENT POTENTIAL SUMMARY One Bedroom 36 Units 500 SF 18,000 SF $746.94 $1.49 $26,890 $765.00 $1.53 SF $27,540 $815.00 $1.63 SF $29,340 Two Bedroom 60 Units 740 SF 44,400 SF $835.98 $1.13 $50,159 $894.25 $1.21 SF $53,655 $985.17 $1.33 SF $59,110 Three Bedroom 24 Units 970 SF 23,280 SF $947.87 $0.98 $22,749 $975.00 $1.01 SF $23,400 $1,150.00 $1.19 SF $27,600 Totals / Wtd. Averages 120 Units 714 SF 85,680 SF $831.64 $1.16 SF $99,797 $871.63 $1.22 SF $104,595 $967.08 $1.35 SF $116,050

UNIT MIX BREAKDOWN THE AUGUST FINANCIALS

AVERAGE EFFECTIVE MARKET PROJECTED UNIT TYPE NO. OF UNITS RENTABLE SF TOTAL SF RENT/UNIT RENT/SF TOTAL RENT POTENTIAL RENT/UNIT RENT/SF TOTAL RENT POTENTIAL RENT/UNIT RENT/SF TOTAL RENT POTENTIAL One Bedroom 1BR/1BA 36 Units 500 SF 18,000 SF $746.94 $1.49 SF $26,890 $765.00 $1.53 SF $27,540 $815.00 $1.63 SF $29,340 Totals / Wtd. Averages 36 Units 500 SF 18,000 SF $746.94 $1.49 SF $26,890 $765.00 $1.53 SF $27,540 $815.00 $1.63 SF $29,340 Two Bedroom 2BR/1BA 59 Units 740 SF 43,660 SF $835.74 $1.13 SF $49,309 $895.00 $1.21 SF $52,805 $985.00 $1.33 SF $58,115 2BR/2BA 1 Units 740 SF 740 SF $850.00 $1.15 SF $850 $850.00 $1.15 SF $850 $995.00 $1.34 SF $995 Totals / Wtd. Averages 60 Units 740 SF 44,400 SF $835.98 $1.13 SF $50,159 $894.25 $1.21 SF $53,655 $985.17 $1.33 SF $59,110 Three Bedroom 3BR/1BA 24 Units 970 SF 23,280 SF $947.87 $0.98 SF $22,749 $975.00 $1.01 SF $23,400 $1,150.00 $1.19 SF $27,600 Totals / Wtd. Averages 24 Units 970 SF 23,280 SF $947.87 $0.98 SF $22,749 $975.00 $1.01 SF $23,400 $1,150.00 $1.19 SF $27,600

THE AUGUSTFINANCIALS

CURRENT YEAR 1 GROSS POTENTIAL RENT % of GPR Per Unit % of GPR Per Unit All Units at Market Rent $1,224,678 T12 10,206 $1,392,600 11,605 Gain (Loss) to Lease ($65,703) T12 5.36% (548) ($27,852) 2.00% (232) GROSS SCHEDULED RENT $1,158,975 9,658 $1,364,748 11,373 Other Income Water Reimbursement $30,824 T12 2.66% 257 $31,749 2.33% 265 Pet Fees $16,023 T12 1.38% 134 $16,504 1.21% 138 Laundry Income $8,126 T12 0.70% 68 $8,370 0.61% 70 MTM Fee $8,007 T12 0.69% 67 $8,248 0.60% 69 Early Termination Fees $6,007 T12 0.52% 50 $6,187 0.45% 52 Late Rent Fees $5,700 T12 0.49% 48 $5,871 0.43% 49 Non Refundable Pet Fee $5,500 T12 0.47% 46 $5,665 0.42% 47 Cable/Phone Commission $5,286 T12 0.46% 44 $5,445 0.40% 45 Collections $4,469 T12 0.39% 37 $4,603 0.34% 38 Admin Fees $4,000 T12 0.35% 33 $4,120 0.30% 34 Application Fees $3,830 T12 0.33% 32 $3,945 0.29% 33 Waiver Fee $1,518 T12 0.13% 13 $1,564 0.11% 13 Collections- Eviction Filing Fees $1,500 T12 0.13% 13 $1,545 0.11% 13 Total Other Income $103,132 8.90% 859 $106,225 7.78% 885 GROSS POTENTIAL INCOME $1,262,107 10,518 $1,470,973 12,258 Physical Vacancy ($64,974) T12 5.61% (541) ($68,237) 5.00% (569) Non-Revenue Units ($7,155) T12 Note 2 0.62% (60) ($2,729) 0.20% (23) Bad Debt ($18,378) T12 1.59% (153) ($27,295) 2.00% (227) Concessions Allowance ($5,043) T12 Note 3 0.44% (42) $0 0.00% 0 EFFECTIVE GROSS INCOME $1,166,557 86.39% 9,721 $1,372,712 90.80% 11,439 NON-CONTROLLABLE Real Estate Taxes % of EGI Per Unit % of EGI 2021 Taxes Paid $61,163 Auditor 5.24% 510 $61,163 4.46% 510 Total Real Estate Taxes $61,163 5.24% 510 $61,163 4.46% 510 Insurance $42,502 T12 3.64% 354 $42,000 3.06% 350 Utilities Gas & Electric $3,400 T12 0.29% 28 $3,000 0.22% 25 Gas & Electric Vacant $8,350 T12 0.72% 70 $7,200 0.52% 60 Water & Sewage $15,723 T12 1.35% 131 $15,000 1.09% 125 Trash Removal $6,615 T12 0.57% 55 $6,000 0.44% 50 Total Utilities $34,087 2.92% 284 $31,200 2.27% 260 Total Non-Controllable $219,148 18.79% 1,826 $283,893 20.68% 2,366 CONTROLLABLE Contract Services Security Expense $3,400 T12 0.29% 28 $3,000 0.22% 25 Snow Removal $8,350 T12 0.72% 70 $7,200 0.52% 60 Landscaping/Grounds $15,723 T12 1.35% 131 $15,000 1.09% 125 Pest Control $6,615 T12 0.57% 55 $6,000 0.44% 50 Total Contract Services $34,087 2.92% 284 $31,200 2.27% 260 Repairs & Maintenance $45,402 T12 3.89% 378 $72,000 5.25% 600 Marketing & Promotion $28,379 T12 2.43% 236 $24,000 1.75% 200 On-Site Payroll $189,974 T12 16.29% 1,583 $132,000 9.62% 1,100 Payroll Taxes & Benefits $18,131 T12 1.55% 151 $18,000 1.31% 150 General & Administrative $27,570 T12 2.36% 230 $18,000 1.31% 150 Management Fee $47,353 T12 4.06% 395 $68,636 5.00% 572 Telephone & Cable $3,176 T12 0.27% 26 $3,000 0.22% 25 Replacement & Reserves $30,600 Note 1 2.62% 255 $31,212 2.27% 260 Total Controllable $424,671 36.40% 3,539 $398,048 29.00% 3,317 TOTAL EXPENSES $643,820 55.19% 5,365 $619,003 45.09% 5,158 NET OPERATING INCOME $522,737 44.81% 4,356 $753,708 54.91% 6,281 EXPENSE INCOME
INCOME & EXPENSES
YEAR 2 YEAR 3 % of GPR Per Unit % of GPR Per Unit $1,434,378 11,953 $1,477,409 12,312 ($28,688) 2.00% (239) ($29,548) 2.00% (246) $1,405,690 11,714 $1,447,861 12,066 $32,701 2.33% 273 $33,682 2.33% 281 $16,999 1.21% 142 $17,509 1.21% 146 $8,621 0.61% 72 $8,880 0.61% 74 $8,495 0.60% 71 $8,750 0.60% 73 $6,373 0.45% 53 $6,564 0.45% 55 $6,047 0.43% 50 $6,229 0.43% 52 $5,835 0.42% 49 $6,010 0.42% 50 $5,608 0.40% 47 $5,776 0.40% 48 $4,741 0.34% 40 $4,884 0.34% 41 $4,244 0.30% 35 $4,371 0.30% 36 $4,063 0.29% 34 $4,185 0.29% 35 $1,611 0.11% 13 $1,659 0.11% 14 $1,591 0.11% 13 $1,639 0.11% 14 $109,375 7.78% 911 $112,619 7.78% 938 $1,515,066 12,626 $1,560,480 13,004 ($70,285) 5.00% (586) ($72,393) 5.00% (603) ($2,811) 0.20% (23) $0 0.00% 0 ($28,114) 2.00% (234) ($28,957) 2.00% (241) $0 0.00% 0 $0 0.00% 0 $1,413,856 90.80% 11,782 $1,459,130 91.00% 12,159 % of EGI Per Unit % of EGI Per Unit $61,163 4.33% 510 $61,163 4.33% 510 $61,163 4.33% 510 $61,163 4.33% 510 $42,840 3.03% 357 $43,697 3.09% 364 $3,060 0.22% 26 $3,121 0.22% 26 $7,344 0.52% 61 $7,491 0.53% 62 $15,300 1.08% 128 $15,606 1.10% 130 $6,120 0.43% 51 $6,242 0.44% 52 $31,824 2.25% 265 $32,460 2.30% 271 $287,089 20.31% 2,392 $290,349 20.54% 2,420 $3,060 0.22% 26 $3,121 0.22% 26 $7,344 0.52% 61 $7,491 0.53% 62 $15,300 1.08% 128 $15,606 1.10% 130 $6,120 0.43% 51 $6,242 0.44% 52 $31,824 2.25% 265 $32,460 2.30% 271 $73,440 5.19% 612 $74,909 5.30% 624 $24,480 1.73% 204 $24,970 1.77% 208 $134,640 9.52% 1,122 $137,333 9.71% 1,144 $18,360 1.30% 153 $18,727 1.32% 156 $18,360 1.30% 153 $18,727 1.32% 156 $70,693 5.00% 589 $72,957 5.00% 589 $3,060 0.22% 26 $3,121 0.22% 26 $31,836 2.25% 265 $32,473 2.30% 271 $406,693 28.76% 3,389 $415,677 29.24% 3,445 $630,845 44.62% 5,257 $643,088 45.48% 5,359 $783,011 55.38% 6,525 $816,042 57.72% 6,800
CURRENT YR 1 YR 2 YR 3 YR 4 YR 5 YR 6 YR 7 YR 8 YR 9 YR 10 YE JAN-2024 YE DEC-2024 YE DEC-2025 YE DEC-2026 YE DEC-2027 YE DEC-2028 YE DEC-2029 YE DEC-2030 YE DEC-2031 YE DEC-2032 GROSS POTENTIAL RENT All Units at Market Rent $1,224,678 $1,392,600 $1,434,378 $1,477,409 $1,521,732 $1,567,384 $1,614,405 $1,662,837 $1,712,722 $1,764,104 $1,817,027 Gain (Loss) to Lease ($65,703) ($27,852) ($28,688) ($29,548) ($30,435) ($31,348) ($32,288) ($33,257) ($34,254) ($35,282) ($36,341) GROSS SCHEDULED RENT $1,158,975 $1,364,748 $1,405,690 $1,447,861 $1,491,297 $1,536,036 $1,582,117 $1,629,580 $1,678,468 $1,728,822 $1,780,687 Total Other Income $103,132 $106,225 $109,375 $112,619 $114,872 $117,169 $119,512 $121,903 $124,341 $126,827 $129,364 GROSS POTENTIAL INCOME $1,262,107 $1,470,973 $1,515,066 $1,560,480 $1,606,169 $1,653,205 $1,701,629 $1,751,483 $1,802,809 $1,855,649 $1,910,051 Physical Vacancy ($64,974) ($68,237) ($70,285) ($72,393) ($74,565) ($76,802) ($79,106) ($81,479) ($83,923) ($86,441) ($89,034) Down Units ($7,155) ($2,729) ($2,811) $0 $0 $0 $0 $0 $0 $0 $0 Bad Debt ($18,378) ($27,295) ($28,114) ($28,957) ($29,826) ($30,721) ($31,642) ($32,592) ($33,569) ($34,576) ($35,614) Concessions Allowance ($5,043) $0 $0 $0 $0 $0 $0 $0 $0 $0 $0 EFFECTIVE GROSS INCOME $1,166,557 $1,372,712 $1,413,856 $1,459,130 $1,501,778 $1,545,682 $1,590,881 $1,637,412 $1,685,316 $1,734,632 $1,785,403 Real Estate Taxes $61,163 $61,163 $61,163 $61,163 $62,386 $63,634 $64,907 $66,205 $67,529 $68,879 $70,257 Insurance $42,502 $42,000 $42,840 $43,697 $44,571 $45,462 $46,371 $47,299 $48,245 $49,210 $50,194 Utilities $115,483 $117,793 $120,149 $122,552 $125,003 $127,503 $130,053 $132,654 $135,307 $138,013 $140,773 Contract Services $34,087 $31,200 $31,824 $32,460 $33,110 $33,772 $34,447 $35,136 $35,839 $36,556 $37,287 Repairs & Maintenance $45,402 $72,000 $73,440 $74,909 $76,407 $77,935 $79,494 $81,084 $82,705 $84,359 $86,047 Marketing & Promotion $28,379 $24,000 $24,480 $24,970 $25,469 $25,978 $26,498 $27,028 $27,568 $28,120 $28,682 On-Site Payroll $189,974 $132,000 $134,640 $137,333 $140,079 $142,881 $145,739 $148,653 $151,627 $154,659 $157,752 Payroll Taxes & Benefits $18,131 $18,000 $18,360 $18,727 $19,102 $19,484 $19,873 $20,271 $20,676 $21,090 $21,512 General & Administrative $27,570 $18,000 $18,360 $18,727 $19,102 $19,484 $19,873 $20,271 $20,676 $21,090 $21,512 Management Fee $47,353 $68,636 $70,693 $72,957 $75,089 $77,284 $79,544 $81,871 $84,266 $86,732 $89,270 Telephone & Cable $3,176 $3,000 $3,060 $3,121 $3,184 $3,247 $3,312 $3,378 $3,446 $3,515 $3,585 Replacement & Reserves $30,600 $31,212 $31,836 $32,473 $33,122 $33,785 $34,461 $35,150 $35,853 $36,570 $37,301 TOTAL EXPENSES $643,820 $619,003 $630,845 $643,088 $656,623 $670,449 $684,572 $698,999 $713,737 $728,792 $744,172 NET OPERATING INCOME $522,737 $753,708 $783,011 $816,042 $845,155 $875,233 $906,309 $938,413 $971,579 $1,005,840 $1,041,230 INCOME EXPENSE THE
FINANCIALS
Property Address Parcel ID Year Built Acres Market Value Assessed Value Tax Rate Taxes Payable Land Use Code 4070 Victoria Way 255-189-50 1977 7.00 $5,618,500 $5,618,500 0.010886 $61,162.99 403 M - Apartments 40 or More Units Total 7.00 $5,618,500 $5,618,500 $61,162.99
AUGUST
CASH FLOW Tax Breakdown

*Calculated as a percentage of Gross Potential Rent | **Calculated as a percentage of Effective Gross Income

CASH FLOW PROJECTION GROWTH RATE ASSUMPTIONS YR 1 YR 2 YR 3 YR 4 YR 5 YR 6 YR 7 YR 8 YR 9 Income Gross Potential Rent 13.71% 3.00% 3.00% 3.00% 3.00% 3.00% 3.00% 3.00% 3.00% (Loss) / Gain to Lease* 2.00% 2.00% 2.00% 2.00% 2.00% 2.00% 2.00% 2.00% 2.00% Other Income 3.00% 3.00% 3.00% 3.00% 3.00% 3.00% 3.00% 3.00% 3.00% Expenses Expenses 2.00% 2.00% 2.00% 2.00% 2.00% 2.00% 2.00% 2.00% Management Fee** 5.00% 5.00% 5.00% 5.00% 5.00% 5.00% 5.00% 5.00% 5.00% CASH FLOW PROJECTION GROWTH RATE ASSUMPTIONS YR 1 YR 2 YR 3 YR 4 YR 5 YR 6 YR 7 YR 8 YR 9 Physical Vacancy 5.00% 5.00% 5.00% 5.00% 5.00% 5.00% 5.00% 5.00% 5.00% Non-Revenue Units 0.20% 0.20% 0.00% 0.00% 0.00% 0.00% 0.00% 0.00% 0.00% Bad Debt 2.00% 2.00% 2.00% 2.00% 2.00% 2.00% 2.00% 2.00% 2.00% Concessions Allowance 0.00% 0.00% 0.00% 0.00% 0.00% 0.00% 0.00% 0.00% 0.00% Total Economic Loss 7.20% 7.20% 7.00% 7.00% 7.00% 7.00% 7.00% 7.00% 7.00%

LOCAL MARKET

04

LEXINGTON, KentuckY

Lexington, city, coextensive with Fayette county, north-central Kentucky, U.S., the focus of the Bluegrass region and a major centre for horse breeding. Named in 1775 for the Battle of Lexington, Massachusetts, it was chartered by the Virginia legislature in 1782 and was the meeting place (1792) for the first session of the Kentucky legislature following statehood. Lexington in the early 1880s called itself the Athens of the West, boasting Transylvania College (1780; now Transylvania University), street lights, a public subscription library, a theatre, and a musical society. In 1817 it had presented the first Beethoven symphony heard in the United States.

EMERGING TECH HUB

Metronet has invested over $100 million in fiberoptic infrastructure making Lexington the largest Gigabit city in the nation. The city’s highspeed infrastructure along with its low cost of living provides 1.54 times the purchasing power compared to Silicon Valley attracting talented tech professionals and startups alike.

Buffalo Trace distillery, based out of Kentucky, has made progress in its $1.2 billion expansion, which includes the construction of an additional still, more barrel warehouses, added fermenters and an expansion of the dry house operation.

Over the past year, a second still house has been built next to the existing 1930s structure. At 40 ft tall, it has doubled production capacity and holds 60,000 gallons.

EMPLOYERS IN THE NEWS

• The University of Kentucky approved a purchase agreement for $6.9 Million to acquire land for construciton of a new outpatient cancer treatment center and advanced ambulatory complex. (Dec 2021)

• New $37.5 million Lexington Distillery District hotel will open in spring 2023 (Dec 2021)

• The University of Kentucky gives the city of Lexington 250 acres in and near the Coldstream Research Campus where office, laboratory, residential and hospitality developments are planned. A new, $15 million hightech building currently under construction will provide office and laboratory space for early-stage, high-tech companies to develop and commercialize their products and services. (Oct 2021).

• TMMK to invest $461 million in upgrades at Georgetown Toyota plant. (Oct 2021)

• Buffalo Trace Distillery makes headway on $1.2 billion expansion (Aug 2021)

• Lexington-based Quality Logistics LLC, doing business as Longship, opened its new office in Fayette County, a $4.3 million investment creating 155 well-paying jobs for Kentucky residents (Aug 2021)

BOURBON DISTILLERY
TRACE
BUFFALO

• Prior to the pandemic, Lexington-Fayette’s real gross metropolitan product grew at an average annual rate of 1.4% from 2015 to 2019. During that same five-year period, job growth averaged 1.2% annually, with roughly 3,100 jobs added on average each year. In 2020, COVID-19 mitigation measures and limited business activity caused the local economy to contract as much as 9.7% year-over-year in 2nd quarter.

• In the year-ending 3rd quarter 2022, the metro’s inflation-adjusted economic output contracted 0.4%. At the same time, the metro recorded a

DEMOGRAPHICS: STATISTICS

Population: 514,273

Average occupancy: 96.2%

the economy the rent

net gain of 7,500 jobs, expanding the employment base 2.7%.

• Lexington-Fayette’s unemployment rate in August 2022 declined 0.8 points year-over-year to 3.0%, below the national average of 3.8%.

• During the past year, job gains in Lexington-Fayette were most pronounced in the Leisure/Hospitality Services sector followed by Trade/ Transportation/Utilities, despite job losses stemming from the pandemic, Lexington-Fayette’s current employment base now sits roughly 2,700 jobs or about 1% above the pre-pandemic level in February 2020.

Median age: 36.2

Rent growth: 12.4%

MSA median home value: $193,700

MSA median hhi: $60,729

1 - Year growth: 6.02%

1 - Year growth: 3.55%

• In 3rd quarter 2022, effective asking rents for new leases were up 12.4% year-over-year.

• Annual rent performance was above the market’s five-year average of 5.2%.

• Product classes in Lexington-Fayette, Class A led for rent performance over the past five years. In 3rd quarter 2022, annual effective rent change registered at 12. 9% in Class A units, 12.0% in Class B units and 11. 9% in Class C units.

• Among submarkets, the strongest annual rent change performance over the past year was in Downtown Lexington/University (13.5%). The weakest performance was in North Lexington (11.4%).

• The coming year, effective asking rent change in Lexington-Fayette is expected to slow from the current level.

SUPPLY & DEMAND

• The level of new apartment completions in Lexington-Fayette were modest recently, as 252 units delivered in the year-ending 3rd quarter 2021. That annual completion volume compares to a low of 24 units and a high of 900 units over the past five years. Annual new supply averaged 357 units, and annual inventory growth averaged 0.6% over the past five years.

• Completions over the past year expanded the local inventory base 0.6% and were concentrated only in the Downtown Lexing ton/University submarket.

• Over the next year, inventory growth is set to accelerate with the scheduled addition of 680 units. At the end of 3rd quarter 2021, there were 866 units under construction.

• New supply over the past five years has been concentrated in South Lexington, which received 58% of the market’s total com pletions over that time. Scheduled new deliveries in the coming year are expected to deliver in South Lexington and North Lexing ton.

MARKET DRIVERS

Market drivers are the underlying forces that compel consumers to purchase products and pay for services. These are trends that make markets develop and grow. The most common market drivers are consumer demand, government policy and demand. Before a business takes its product or service to the market, it must first understand who exactly is likely to purchase it. This is known as the target market.

1 University of Kentucky 2 Toyota 3 Baptist Health 4 Amazon.com 5 Lexmark 6 Hitachi 7 Lockheed Martin 8 Adient 9 Link-Belt 10 Webasto 11 Valvoline 12 Big Ass Fans 13 Tempur- Sealy
2 4 6 5 1 3 7 8 9 10 11 12 13

Lexington OCCUPANCY

• Over the past year, occupancy lost 1.3 points, with the 3rd quarter 2022 rate landing at 96.2%.

• Product classes in Lexington-Fayette, 3rd quarter 2022 occupancy registered at 95.7% in Class A units, 96.1% in Class B units and 97.1% in Class C units.

• Among submarkets, 3rd quarter 2022 occupancy was strongest in North Lexington.

• The weakest reading was seen in Downtown Lexington/University.

• During the coming year, occupancy in Lexington-Fayette is expected to register around 96%.

KEENELAND race track

Lexington, the heart of Kentucky “bluegrass,” has been renowned for two centuries for horse raising and horse racing. Shortly after the track’s completion in 1936, Keeneland Racetrack became the most conspicuous manifestation of this culture. Jack Keene, for whom Keeneland is named, was an extraordinary figure in American racing, and helped revive this industry during the 1930s when it was beginning to suffer. Keene was a descendant of a distinguished Lexington family and was known worldwide as a trainer of thoroughbreds. After training abroad in Russia and Japan he returned to Kentucky where he began laying out the Keeneland racecourse in 1916. The main track is one and 1/16th miles in circumference and has retained this length since its original inception by Keene. The grounds also include Keene’s mansion and training center. Constructed of limestone that was quarried on Keene’s farm, this building was designed with living quarters, a large clubroom and stalls. The two-story center section of the building is flanked on either side by stone arcades leading to three-story wings of the building.

ATTRACTIONS

KENTUCKY HORSE PARK

The Kentucky Horse Park is a working horse farm, educational theme park and equine competition facility dedicated to man’s relationship with the horse. Set on more than 1,200 acres in the heart of the Kentucky’s famous Bluegrass region, the park is THE place to get close to horses! Featuring dozens of breeds of horse at work and at play, the park showcases the horse in daily equine presentations, horse drawn tours, horseback and pony rides, and an array of horse shows and special events throughout the year.

HIGHER EDUCATION

The innovation, creativity, quality teaching, and uplifting service underway at the University of Kentucky touch the lives of people throughout the state, the nation, and the world. This is the covenant we honor through ground-breaking research, community outreach, intellectually rigorous education, and techno- logical advances that contribute to the betterment of the Commonwealth while also fostering a cultural quality of

Founded in 1865, the University of Kentucky is a single campus at the heart of the Blue-grass. More than 100 countries are represented in the student body at UK. UK has over 200 academic programs and last spring, there were 29,182 students enrolled. With more than 12,000 staff and 2,000 faculty, UK is one of the largest employers in the state.

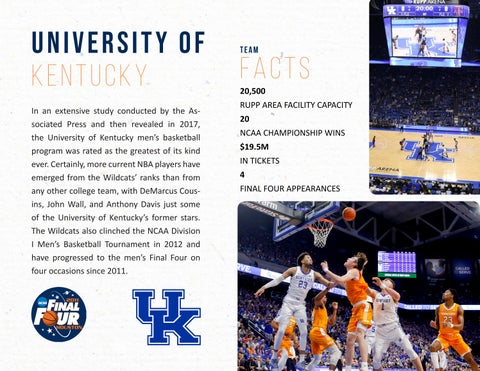
UNIVERSITY oF KENTUCKY team facts

20,500 RUPP AREA FACILITY CAPACITY

In an extensive study conducted by the Associated Press and then revealed in 2017, the University of Kentucky men’s basketball program was rated as the greatest of its kind ever. Certainly, more current NBA players have emerged from the Wildcats’ ranks than from any other college team, with DeMarcus Cousins, John Wall, and Anthony Davis just some of the University of Kentucky’s former stars. The Wildcats also clinched the NCAA Division I Men’s Basketball Tournament in 2012 and have progressed to the men’s Final Four on four occasions since 2011.

20

NCAA CHAMPIONSHIP WINS

$19.5M IN TICKETS

4 FINAL FOUR APPEARANCES

Turn static files into dynamic content formats.

Create a flipbook
Issuu converts static files into: digital portfolios, online yearbooks, online catalogs, digital photo albums and more. Sign up and create your flipbook.