toward the country’s telecom and energy infrastructures connecting the country to Western markets through Russia. It is expected that $25 billion will be invested through 2011 to 2030 in infrastructure—out of which 40 percent will be allocated to the railway system, 23 percent to highways, 25 percent to telecommunications, and 12 percent to water transport (RoK 2010b).
4.2 The Petroleum Sector 4.2.1 The Petroleum Sector in the Economy
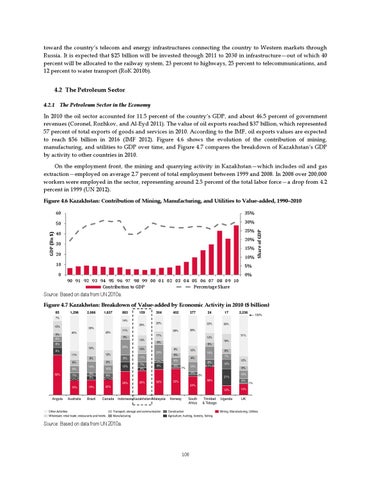
In 2010 the oil sector accounted for 11.5 percent of the country’s GDP, and about 46.5 percent of government revenues (Coronel, Rozhkov, and Al-Eyd 2011). The value of oil exports reached $37 billion, which represented 57 percent of total exports of goods and services in 2010. According to the IMF, oil exports values are expected to reach $56 billion in 2016 (IMF 2012). Figure 4.6 shows the evolution of the contribution of mining, manufacturing, and utilities to GDP over time, and Figure 4.7 compares the breakdown of Kazakhstan’s GDP by activity to other countries in 2010. On the employment front, the mining and quarrying activity in Kazakhstan—which includes oil and gas extraction—employed on average 2.7 percent of total employment between 1999 and 2008. In 2008 over 200,000 workers were employed in the sector, representing around 2.5 percent of the total labor force—a drop from 4.2 percent in 1999 (UN 2012).
60
35%
50
30% 25%
40
20%
30
15%
20
10%
10
Share of GDP
GDP (Bn $)
Figure 4.6 Kazakhstan: Contribution of Mining, Manufacturing, and Utilities to Value-added, 1990–2010
5%
0
0% 90 91 92 93 94 95 96 97 98 99 00 01 02 03 04 05 06 07 08 09 10 Contribution to GDP Percentage Share
Source: Based on data from UN 2010a. Figure 4.7 Kazakhstan: Breakdown of Value-added by Economic Activity in 2010 ($ billion) 85
1,296
2,066
1,637
883
159
304
402
377
39%
38%
24
17
22%
23%
2,236
100%
7% 14% 25%
15% 5%
33%
11%
43%
45%
11%
5%
6%
13%
8% 20%
18%
9% 8%
8% 6%
8%
9% 50%
7% 2%
14%
12%
10%
5% 5%
Angola
Australia
19%
Brazil
5% 12%
7%
3%
8%
8%
4%
3% 32%
Indonesia Kazakhstan Malaysia
2%
12%
12% 6%
21% 36%
33%
10% 6%
24%
20%
Canada
8% 0%
13%
1%
6%
7%
8%
6% 1% 30%
16%
6%
11%
4%
29% 19%
19% 8%
20%
51%
12%
5%
10%
13%
11%
20%
Norway
South Africa
Trinidad & Tobago
Other Activities
Transport, storage and communication
Construction
Wholesale, retail trade, restaurants and hotels
Manufacturing
Agriculture, hunting, forestry, fishing
Source: Based on data from UN 2010a.
108
12%
14%
Uganda
UK
1%
Mining, Manufacturing, Utilities