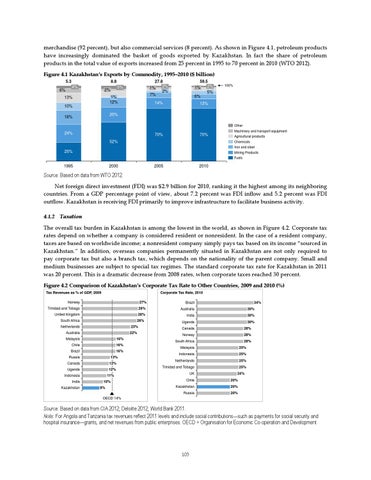
merchandise (92 percent), but also commercial services (8 percent). As shown in Figure 4.1, petroleum products have increasingly dominated the basket of goods exported by Kazakhstan. In fact the share of petroleum products in the total value of exports increased from 25 percent in 1995 to 70 percent in 2010 (WTO 2012). Figure 4.1 Kazakhstan’s Exports by Commodity, 1995–2010 ($ billion) 5.3 6%
8.8 4%
5%
2%
1% 12%
13%
27.8 2% 2% 7%
59.5 2% 5% 6%
14%
13%
1%
1%
10%
100%
20%
18%
Other Machinery and transport equipment
24%
70%
70%
52%
Agricultural products Chemicals
Iron and steel
25%
Mining Products Fuels
1995
2000
2005
2010
Source: Based on data from WTO 2012.
Net foreign direct investment (FDI) was $2.9 billion for 2010, ranking it the highest among its neighboring countries. From a GDP percentage point of view, about 7.2 percent was FDI inflow and 5.2 percent was FDI outflow. Kazakhstan is receiving FDI primarily to improve infrastructure to facilitate business activity. 4.1.2 Taxation
The overall tax burden in Kazakhstan is among the lowest in the world, as shown in Figure 4.2. Corporate tax rates depend on whether a company is considered resident or nonresident. In the case of a resident company, taxes are based on worldwide income; a nonresident company simply pays tax based on its income “sourced in Kazakhstan.” In addition, overseas companies permanently situated in Kazakhstan are not only required to pay corporate tax but also a branch tax, which depends on the nationality of the parent company. Small and medium businesses are subject to special tax regimes. The standard corporate tax rate for Kazakhstan in 2011 was 20 percent. This is a dramatic decrease from 2008 rates, when corporate taxes reached 30 percent. Figure 4.2 Comparison of Kazakhstan’s Corporate Tax Rate to Other Countries, 2009 and 2010 (%) Tax Revenues as % of GDP, 2009
Corporate Tax Rate, 2010
Norway
27%
Brazil
Trinidad and Tobago
26%
Australia
30%
India
30%
United Kingdom
26%
South Africa
26%
Netherlands
23%
Australia
22%
Malaysia
16%
Chile
16%
Brazil
16%
Russia
13%
Canada
12%
Uganda
12%
Indonesia India Kazakhstan
Uganda
10%
30%
Canada
28%
Norway
28%
South Africa
28%
Malaysia
25%
Indonesia
25%
Netherlands
25%
Trinidad and Tobago UK
11%
8%
34%
25% 24%
Chile
20%
Kazakhstan
20%
Russia
20%
OECD 14%
Source: Based on data from CIA 2012; Deloitte 2012; World Bank 2011. Note: For Angola and Tanzania tax revenues reflect 2011 levels and include social contributions—such as payments for social security and hospital insurance—grants, and net revenues from public enterprises. OECD = Organisation for Economic Co-operation and Development.
103