2.8
Poverty rates at international poverty lines 2.8c
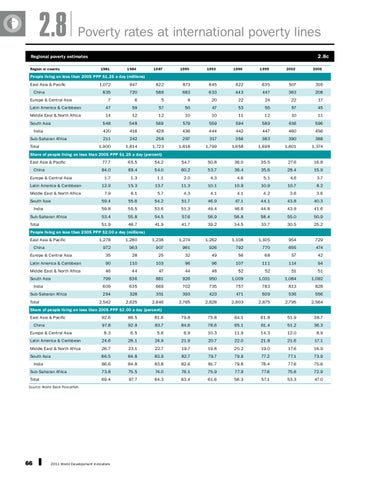
Regional poverty estimates Region or country
1981
1984
1987
1990
1993
1996
1999
2002
2005
People living on less than 2005 PPP $1.25 a day (millions) East Asia & Pacific China Europe & Central Asia
1,072
947
822
873
845
622
635
507
316
835
720
586
683
633
443
447
363
208
7
6
5
9
20
22
24
22
17 45
Latin America & Caribbean
47
59
57
50
47
53
55
57
Middle East & North Africa
14
12
12
10
10
11
12
10
11
548
548
569
579
559
594
589
616
596
South Asia India Sub-Saharan Africa Total
420
416
428
436
444
442
447
460
456
211
242
258
297
317
356
383
390
388
1,900
1,814
1,723
1,818
1,799
1,658
1,698
1,601
1,374
Share of people living on less than 2005 PPP $1.25 a day (percent) East Asia & Pacific China Europe & Central Asia Latin America & Caribbean Middle East & North Africa
77.7
65.5
54.2
54.7
50.8
36.0
35.5
27.6
16.8
84.0
69.4
54.0
60.2
53.7
36.4
35.6
28.4
15.9
1.7
1.3
1.1
2.0
4.3
4.6
5.1
4.6
3.7
12.9
15.3
13.7
11.3
10.1
10.9
10.9
10.7
8.2
7.9
6.1
5.7
4.3
4.1
4.1
4.2
3.6
3.6
59.4
55.6
54.2
51.7
46.9
47.1
44.1
43.8
40.3
59.8
55.5
53.6
51.3
49.4
46.6
44.8
43.9
41.6
Sub-Saharan Africa
53.4
55.8
54.5
57.6
56.9
58.8
58.4
55.0
50.9
Total
51.9
46.7
41.9
41.7
39.2
34.5
33.7
30.5
25.2
South Asia India
People living on less than 2005 PPP $2.00 a day (millions) East Asia & Pacific China
1,278
1,280
1,238
1,274
1,262
1,108
1,105
954
729
972
963
907
961
926
792
770
655
474
Europe & Central Asia
35
28
25
32
49
56
68
57
42
Latin America & Caribbean
90
110
103
96
96
107
111
114
94
Middle East & North Africa South Asia India Sub-Saharan Africa Total
46
44
47
44
48
52
52
51
51
799
836
881
926
950
1,009
1,031
1,084
1,092
609
635
669
702
735
757
783
813
828
294
328
351
393
423
471
509
536
556
2,542
2,625
2,646
2,765
2,828
2,803
2,875
2,795
2,564
Share of people living on less than 2005 PPP $2.00 a day (percent) East Asia & Pacific China Europe & Central Asia Latin America & Caribbean
92.6
88.5
81.6
79.8
75.8
64.1
61.8
51.9
38.7
97.8
92.9
83.7
84.6
78.6
65.1
61.4
51.2
36.3
8.3
6.5
5.6
6.9
10.3
11.9
14.3
12.0
8.9
24.6
28.1
24.9
21.9
20.7
22.0
21.8
21.6
17.1
Middle East & North Africa
26.7
23.1
22.7
19.7
19.8
20.2
19.0
17.6
16.9
South Asia
86.5
84.8
83.9
82.7
79.7
79.9
77.2
77.1
73.9
86.6
84.8
83.8
82.6
81.7
79.8
78.4
77.6
75.6
Sub-Saharan Africa
73.8
75.5
74.0
76.1
75.9
77.9
77.6
75.6
72.9
Total
69.4
67.7
64.3
63.4
61.6
58.3
57.1
53.3
47.0
India
Source: World Bank PovcalNet.
66
2011 World Development Indicators